25 Business Analytics: An Approach to Develop Applied Research Competency
Debora Linehan and Nicolle Bourget
Debora Linehan (deb.linehan@royalroads.ca) is an Assistant Professor in the School of Business at Royal Roads University, Victoria BC Canada; Nicolle Bourget (nicolle.1bourget@royalroads.ca) is an Associate Faculty member in the School of Business at Royal Roads University, Victoria BC Canada.
Rationale
How might graduate students gain research competencies for application in the business organization environment that enhances their professional management skills? Increasing emphasis is being directed to problem solving based on scientific practice and evidence-based decision making (Davenport & Harris, 2017; Rousseau, 2006; Watson, 2013). Further, companies are beginning to use data analytics to predict the future rather than rely only on historical information (Rippert et al., 2021). The capacity to store and use big data sets has presented an opportunity to optimize and understand how data management may provide a competitive advantage for innovation and effective management (Davenport & Harris, 2017). Like data scientists, business managers also need to develop analytic capabilities to harness and understand data; graduate business students can learn the skills of applied research and data analytics to enhance their management competencies (Anderson & Raine, 2012).
Organizations have failed to develop practices based on scientific evidence: aptly described as the “research-practice gap” (Rousseau, 2006). Researchers and educators could play an important role in building those capabilities and practices (Watson, 2013). Business analytics represents a bridge to cross the research-practice gap that may easily be adopted in business organizations. A useful definition of business analytics is “The scientific process of transforming data into insight for making better decisions. By analytics, we mean the extensive use of data, statistical and quantitative analysis, explanatory and predictive models, and fact-based management to drive decisions and actions” (Davenport & Harris, 2017, p. 25). The skills of business analysts include techniques that are quantitative, qualitative, and mixed methods using statistical techniques, systematic reasoning, and working with models (Holsapple et al., 2014). The complex and dynamic nature of organizations and businesses continues to require a systemic approach to analyze complex business issues and develop insights to support the decision-making process. Here, I present an approach using business analytics to develop applied research competencies that build the necessary foundational skills for future managers and analysts.
Overview
At Royal Roads University, the MGMT 580 Applied Research and Business Analytics course (delivered in both on-campus and blended modes) for management-based graduate students presents a unique design to teaching research and problem solving in organizations. The course integrates the two approaches of traditional academic research and business analytics and is a prerequisite to the Global Management Project (GMP) which is the capstone research thesis for the completion of the Master of Global Management degree. There exist many parallels between a business analytics approach (which is taught first), and academic research approaches. The combination thereby provides a solid grounding and practice in basic research concepts. Throughout the course, students develop scholarly attributes that are needed for both academic and professional contexts, define problematic researchable areas, develop and design appropriate applied research, develop data analysis skills and techniques, and develop relevant insights that could be communicated to practitioners and academics.
The following outlines the course scaffolding of concepts culminating in a team assignment (delivered midway through the course) that is an example of business modelling used as a research method. The process is more fully defined in Powell & Baker (2016).
Course outline weeks 1-5
- Explore problem-solving. Academic readings are augmented by a class exercise that examines real-world issues which move from a complex set of circumstances to well-defined business problems. News stories/issues are selected by the instructor and students. Through a thinking process of diverging and converging problem-solving, students analyze the components of the story – its structural elements, context, stakeholders, and evaluating potential options for analysis. In most cases, several well-structured researchable problems are extracted from the story. Objectives are clearly defined, assumptions are made, and checks are conducted to ensure the necessary data are readily available. The parallel to developing a research project is made.
- Sketch the influence chart (Appendix A, Figures 1 and 2). Effective modelling takes place within a larger problem-solving process. As a precursor to modelling, an influence chart is sketched out that further distills a focused objective, and associated variables that may directly and indirectly impact outcomes. Students appreciate this visual way to conceptualize insights about the problem. At this stage students begin to clearly understand the impact of managing project scope to bring clarity to their selected research proposal, through learning to understand key relationships and parameters for data collection. The parallel is akin to deconstructing a problem and developing researchable problems that would lead to a research question(s).
- Differentiate quantitative and qualitative analysis and define variable types. Students engage in a preliminary review of varied ways that data is presented and practice recognizing nominal and ordinal data in existing journal articles and data sets. This step allows for an understanding of how statistical manipulations could or could not be used and informs business modelling. Further, visual depictions of data analysis are discussed. The ability to present data in a visual way is an important management skill for communication within an organization (Powell & Baker, 2016). We refer to TedGlobal talk by David McCandless for an example of the power of visualization (McCandless, 2010).
- Business modelling. The student teams begin to translate their influence charts into a diagnostic model. While many technology platforms might be used, most students are familiar with the breadth and ease of use of Microsoft Excel. This provides a familiar and non-threatening introduction to the practice of spreadsheet engineering to build a diagnostic model. Additional Excel tutorials are provided for those with less experience. Spreadsheet models are commonplace in organizations, but not always well designed to solve the problems they are built for (Powell & Baker, 2016). Students find this is a useful exercise to enhance their management skills and frequently comment they will use modelling skills in the future. Student teams have selected their own business problem and present initial work for instructor feedback before refinement of the research problem and final model design.
- Student teams present their research problem, research question, method assumptions and business model in class and engage in dialogue, receive feedback, and effectively argue their approaches. A description of the assignment follows here.
Team assignment: Building a decision model
The purpose of this assignment is to work in teams to build a decision model that captures a real-life problem situation. Consider the learning outcomes outlined below for guidance on the objectives of the assignment. For this assignment, students are required to create both an Excel model and narrated PowerPoint video that address the following:
- Select a real-life problem situation. Refer to the course practice in week one to determine appropriate problems and scope.
- Explore the complex issues presented to distill a researchable focus by answering the following questions:
- o What do we know?
- o What can we assume?
- o What could the result look like?
- o What information/research can be brought to bear?
- o What can we ask the client?
- o Are there any similar situations or problems?
- Formulate a problem statement.
- Draw an influence chart for the problem.
- Discuss the decisions, decision variables, potential outcomes, and relationships in the problem.
- Outline the parameters of the problem.
- Create an Excel model for the problem per instructions (Powell & Baker, 2016).
- Discuss the problem model.
- Create a narrated presentation that addresses the points above.
The learning outcome that was constructed for this assessment is to: Effectively use research methodologies, data sources, concepts, and theories to investigate, evaluate, and analyze findings that inform planning, decision-making and actions. The foregoing represents a typical business analytics course framework, and yet there are close parallels to the scholarly research competencies and the practice of applied research.
Reflection
I have taught this course since its inception in 2019 and am continually struck by the breadth and depth of the business problems in many industries that students tackle and their level of engagement in the modeling process. For example, excellent projects have analyzed airline passenger patterns, the efficiency of drone deliveries, real estate investment returns, chocolate sales in retail and virtual distribution channels, and the feasibility testing of new business operating models during the Covid-19 pandemic. In every case, the project is an iterative puzzle to solve. Teams gain confidence when they achieve their final projects, but initially struggle as they muddle through the ambiguity of refining and designing their research. The instructor is actively supervising teams throughout, forming an important relationship and creating an ability to connect deeply in the learning process. At the close of the first five weeks, the class transitions to the next five weeks when they prepare to write a research proposal. In a wrap-up exercise, we assess a list of research questions for effectiveness. Students demonstrate an ability to identify weaknesses in scope, definition, and clarity. The business analytics process has helped them to translate key research and scholarly competencies into the next phase of their studies. Many of the students comment that they will use the analytic skills in their professional lives. I confess it is a difficult course to teach as it covers many concepts in a short period of time; however, refinements have improved the flow and I have come to appreciate the many parallels between business analytics and traditional research methods.
References
Anderson, J., & Raine, L. (2012). The future of big data: Influence of big data in 2020. (pp. 1–41). Pew Research Center.
Davenport, T. H., Harris, J. G., & Morison, R. (2010). Analytics at work: Smarter decisions, better results. Harvard Business School Press.
Davenport, T. H., & Harris, J. G. (2017). Competing on analytics: The new science of winning. Harvard Business Review Press.
Goodreads. (n.d.) W. Edwards Deming: Quotes. https://www.goodreads.com/author/quotes/310261.W_Edwards_Deming
Holsapple, C., Lee-Post, A., & Pakath, R. (2014). A unified foundation for business analytics. Science Direct, 64(August), 130–141.
McCandless, D. (2010). The beauty of data visualization. Ted Global 2010. https://www.ted.com/talks/david_mccandless_the_beauty_of_data_visualization
Powell, S., & Baker, K. (2016). Business Analytics: The art of modeling with spreadsheets (5th ed.). John Wiley & Sons.
Rippert, A., O’Reilly, K., Bartels, R., Deryckere, K., Sage-Gavin, E., & Nunes, P. (2021). Business futures 2021: Signals of change (p. 41). Accenture. https://www.accenture.com/ca-en/insights/consulting/_acnmedia/Thought-Leadership-Assets/PDF-5/Accenture-Signals-Of-Change-Business-Futures-2021-Executive-Summary.pdf
Rousseau, D. (2006). Is there such a thing as “evidence-based management”? Academy of Management Review, 31(2), 13.
Watson, H. J. (2013, May). The Business Case for Analytics. BizEd AACSB International. https://bized.aacsb.edu/articles/2013/05/the-business-case-for-analytics
Appendix A: Influence Charts
Figure 1
Building an influence chart
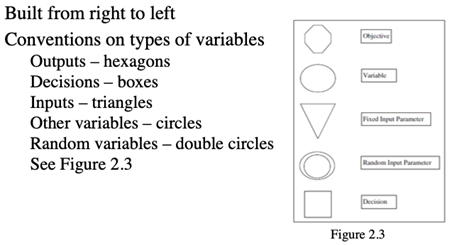
Permission granted from Powell, S., & Baker, K. (2016). Business Analytics: The art of modeling with spreadsheets (5th ed.). John Wiley & Sons. Not included under Creative Commons licence – all rights reserved.
Figure 2
Example: A pricing decision
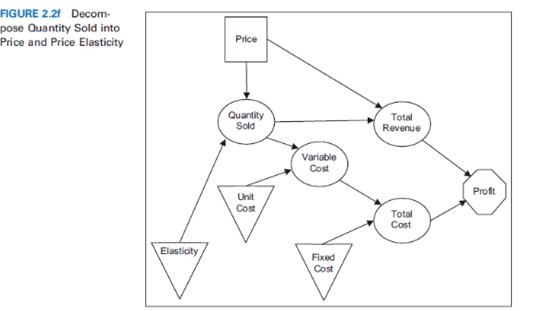
Permission granted from Powell, S., & Baker, K. (2016). Business Analytics: The art of modeling with spreadsheets (5th ed.). John Wiley & Sons. Not included under Creative Commons licence – all rights reserved.
