24 The Importance of Playing with your Qualitative Data—Get Messy!
Moira McDonald
Moira McDonald (moira.3mcdonald@royalroads.ca) is an Assistant Professor in the School of Tourism and Hospitality Management, Royal Roads University, Victoria BC Canada.
Helping novice graduate students relax about analyzing their qualitative data is the aim of this workshop; while the activities may appear elementary, that is the essence of its charm.
Rationale
This activity can bring your novice researchers closer to understanding their qualitative data by engaging and asking questions and working with themes and categories in a highly visual and tangible manner. I have used this workshop to help novice graduate students make sense and ask questions about their qualitative data, while learning from their peers, and having fun understanding their data. I first experienced this playful qualitative data analysis in a workshop led by Dr. Jude Spiers. Focusing on novice graduate student qualitative researchers and inspired by Morse and Field (1995), Spiers (2019) shared her ideas for better understanding qualitative data through inductive analysis and cognitive processes. Getting everyone to relax and fearlessly engage is an essential part of this active learning experience.
The tools you will use and the process involved should make this powerful visual activity resonate with your students long after the workshop ends.
Overview
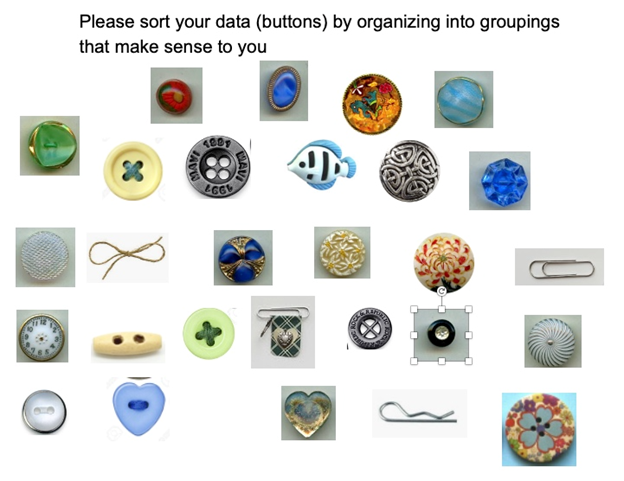
The workshop is three hours in length and requires students ideally in small groups of three to five people. You may design your groups in any size that suits your needs, but smaller may be better. Gather something to use to represent the data that is “the same but different.” In this example, I use a large bag of assorted buttons (Spiers, 2019); buttons represent the data. When you have an assortment of buttons of many shapes, sizes, designs, to help students begin the activity, you will also need to include objects that might not be a button. You may include a paperclip, or a string, or other items that do not appear to be a button. At one stage in your workshop, as the instructor, you will learn from students why they did not include these objects in their groupings. Or, if they did include the string or the paperclip, what were they thinking about when playing with this ‘data.’ The grouping of buttons and the non-buttons become a part of your inquiry as you engage with the students about how they sorted what you gave them, their ‘data.’
Preparatory step
Begin by using the guiding questions handout in Appendix A to warm up the students for the activities. These guiding questions will prompt the students to reflect on what makes them anxious about their research journey; for example, your students might be anxious about their data analysis for a major research project, thesis or dissertation. Once you have allotted approximately five minutes to this activity from Appendix A, move to the second preparatory activity. This activity can be found in Appendix B. The handout includes guiding questions pertaining to their coping strategies. These handouts are personal, and the students will keep them to themselves. There is no need to share their thoughts and concerns with others, but you will ask the students to return to what they wrote when the workshop ends and to keep their handwritten notes available for that time.
Step One: setting the stage
Now that the preparatory step is complete, introduce your visual data tool. In my example, I present a large bag of assorted buttons as the visual data tool. I tell a simple story on how I came to have accumulated or collected so many buttons. It is important to keep the story simple and authentic and remove any possible suspicion about perceived hidden meaning about the visual tool items. Other visual data tools could include sea glass, bottle caps, stamps, anything that can be shared freely with your students that are variations of the same thing. Include in your assorted items some things that may not be traditionally identified as belonging. In my example of assorted buttons, I will include items such as paperclips, random pieces of string, or other small artifacts. These items, included in my assorted buttons, are typically not viewed as a traditional button in our frame of reference. These ‘non-buttons’ will find their way into your visual data for students to see and take some action. Whatever visual data tool you choose, create a relaxed and familiar atmosphere for your students to speak freely throughout the workshop.
A brief interruption
Some students will have fun and question each other during Step Three regarding how the string or paperclip function might be the same as the button and how our contextual understanding shapes our understanding of the data analysis – might a paperclip also be a button? Stand by for that excellent conversation when you are overhearing explanations during Step Three! If students do not question the non-button, this is where you can invite that conversation in Step Six. There is a flow to these steps, and opportunities will arise that you will take as key learning and teaching moments.
Step Two: organizing the data
The instructor produces their bag of things, in my case it was assorted buttons of different shapes, sizes, colours, textures, and some essential non-buttons, as mentioned earlier. The instructor uses a cup to scoop from the bag, placing the contents onto the desks for each team. With the randomly poured cup, you will attempt to have at least one non-button in the data. Invite your students to sort their buttons in a way that makes sense to them (see Appendix E). This instruction allows for minimal direction from you and enables student viewpoints. Each team will then actively organize their buttons/data in whatever groupings they would like to use. This process is fun and engaging. Students will be overheard explaining to each other why the groupings are being sorted in this way or that way, as they go about the process of sorting. Sometimes, there is a level of suspicion and attempts to overthink what “sort your buttons in a way that makes sense” might mean. In Step Two, students may choose to observe what others are doing to get a sense of the instruction you provided. Observation may occur when a group member feels this exercise is too simple or they might be looking for the ‘trick’ that lies ahead. The simple approach to the practice is part of the charm. After about four or five minutes, while students continue to sort, move to Step Three.
Step Three: surfacing assumptions
As the instructor, you can move freely from table to table to overhear student explanations. Make mental notes of what you hear.
After you have walked from table to table, you invite the students to report out and share with their peers how they sorted their buttons. Examples might be if you hear a student from one team declare, “put all the gold buttons in this pile,” you will be able to ask that team precisely what they mean by the term gold. Is it real gold, a colour gold? How did they define this word? What assumptions were they making? Sometimes a student can be overheard saying, “Put the cool-looking buttons in this pile.” By asking the student what they mean by the term “cool,” you are helping the student understand the subsets of their qualitative data, paradigms and perspectives. The conversation you engage them in helps make sense of their findings and construct meaning; Denzin and Lincoln (2017) describe this as the interpretative approach that qualitative research uses. In this instance, the student is learning to question and interpret. As you move to Step Four, you will have the opportunity to probe and question further.
Step Four: presenting interpretations
After ten minutes, invite each group to share their qualitative data sorting process and resulting groupings. This can be best done as you move from group to group, inviting each group to report out how they sorted their data. During this exchange, you will have opportunities to refer to earlier conversations and probe further any conversations you overheard when you were moving freely from table to table. Student responses to your probing will again present opportunity for students to make sense of their data, as described by Denzin and Lincoln (2017).
Step Five: collapsing categories
Once you have travelled the room and all teams have shared their qualitative data sorting process and resulting groupings (as in Step Four), invite the students to take their piles and re-sort them but this time, sort down from, say, five piles to three. Ask them to take notes on how they made their re-sorting decisions. When they finish, ask them to sort again but this time into two piles and again take notes on how they made their resorting decisions. This step allows them to rethink their understanding of their data and categories. By taking notes, they will be able to report out to the room of students, which is the next instruction. To achieve maximum engagement and understanding, ask all students to stand and gather around each table as peers share their sorting explanations of what they did to create the smaller piles of buttons.
Step Six: Debriefing and next steps.
The workshop’s essence is to show how messy data analysis is, and that evolving and changing codes and categories is fine as novice researchers comprehend and synthesize and recontextualize their qualitative data analysis (Morse & Field, 1995; Richards & Morse, 2013). To carry out the debriefing, remind students of the notes they took when they were reorganizing their piles. In this instance they were abstracting and “theme-ing” or “thinking up” from the data (Richards et al., 2013, p. 13). The researcher is interpreting the data to construct meaning and it is here that novice researcher can be made aware of their assumptions, limitations, and delimitations during the debrief.
Step 7: Getting feedback on your workshop: the student experience
Invite students to return to what they wrote in the first two preparatory exercise handouts (Appendices A and B). This process helps situate the student where they were when they began and where they are after the workshop. At the end of the session, I use a simple handout titled, The Muddiest Point(s) (Appendix C), which I invite students to hand in before leaving. The premise of the handout is to garner areas that are still unclear or require more information, resources, or practice. Based on your practice and teaching style, there are many ways to structure your feedback and amplify this conclusion to the workshop.
Conceptual Underpinnings and Methodological Viewpoints
The workshop’s conceptual ideas are from Richards and Morse (2013), regarding inductive analysis’s cognitive processes. The intention is to have the novice qualitative researcher actively connecting terms and concepts with what they are doing while also demonstrating the importance of playing with data. As mentioned earlier, the workshop’s essence is to engage in data analysis’s messiness and share the insight that evolving and changing codes and categories is part of the process. These processes can hinder and freeze novice analysts, according to Spiers (2019). Involving students in the visual and tactile activity and getting everyone to relax and feel playful is essential for this active learning activity.
Making this a remote learning activity
I have made modifications to this activity to include a remote delivery modality. Using a shared file resource (such as Google Slides or Microsoft Word), have each team of students use graphics of buttons on a slide filled with buttons. Students can use the drag and drop feature to sort as a team. Appendix D offers a visual example of a Google Slide for remote workshop delivery.
Reflection
In conducting this teaching and learning activity in the workshop setting, some teams start quickly and with enthusiasm while others hold back, unsure of what to do. When the instructor invites students to play with the ‘data’ (buttons, bottle caps, sea glass), they become engaged in a qualitative analysis process involving coding, questioning, describing, and interpreting. This activity of inquiry and description is highly memorable for adult learners. As described by Spiers (2019) it is okay to make mistakes, encounter dead-end lines of inquiry or coding, to code all sorts of pieces of data, or not to code at all, depending on your stance as a researcher, your research question, and your method.
References
Denzin, N.K. & Lincoln, Y.S. (1994). Part II: Major paradigms and perspectives. Handbook of Qualitative Research, Sage, pp. 99-198.
Lincoln, Y. S., Lynham, A., & Guba, E. G. (2017). Paradigmatic controversies, contradictions, and emerging confluences, revisited. In N. K. Denzin & Y. S. Lincoln (Eds.), The Sage handbook of qualitative research (5th ed., pp. 108-150). Sage.
Morse, J. M. (2008). Confusing categories and themes. Qualitative Health Research, 18(6), 727-728. https://doi.org/10.1177/1049732308314930
Morse, J. M., & Field, P. A. (1995). Nursing research: The application of qualitative approaches. Nelson Thornes.
Richards, L., & Morse, J. M. (2013). Readme first for a user’s guide to qualitative methods (3rd ed.). Sage.
Spiers, J. (2019). Thinking Qualitative Conference, June, Edmonton, University of Alberta.
Spiers, J. A., Paul, P., Weaver, K., & Jennings, D. (2012). Strategies for engaging undergraduate nursing students in reading and using qualitative research. The Qualitative Report, 17(Art. 48), 1-22. https://doi.org/10.7939/R3NS0M131
Appendix A
Activity One Handout: What makes you anxious about your research journey?
In your experience, which cycles of deliberation are the slowest and most frustrating?
- The hardest part at the moment is…
- Why is this so hard for me?
- The hardest part I anticipate is…
- Why is this so hard for me?
Appendix B
Activity Two Handout: Coping with Research Distress
Identify your 3 dominant coping strategies
1. __
2. __
3. __
- Are these strategies beneficial or not?
- How do you know?
- When do you move from constructive to non-constructive copying?
- At what point does a bad coping strategy undermine your progress?
- When stressed, do you withdraw or reach out?
- Is it difficult to help you? Why?
Appendix C
The Muddiest Point Handout
Thank you for participating in this workshop. Before leaving, please take a moment to share any concepts or information you would like more clarity and assistance in the future. What resources do you need for your next steps? How can we help?
Appendix D
Remote Learning Adaptation
A visual example of adapting this workshop to a remote learning activity is shared here.
Also available on a google sheet for simultaneous group activity.
And an MS PowerPoint slide is included for your ease of use.
Appendix E