Module 4: Risk Under Deep Uncertainty
Climate surprises: Fat tails
Here, we’re interested in cases in which climate change does not proceed in an orderly, gradual and predictable way but, rather, presents us with surprises: an extreme weather event that our probability distributions suggest should occur very rarely, if ever; or, a sudden abrupt shift in the state or dynamics of the climate system itself.
If we wish to predict the probable frequency of future events, we’d like our probability distributions to take on a familiar and reliable bell-shape with a clearly defined central tendency within a fairly narrow range of values beyond which their likelihood approaches zero. That distribution would look similar to the red curve in the diagram below.
But what if the actual distribution looks more like the one illustrated with the violet curve? In that curve, the likelihood of extreme high values does not fully dissipate. Some likelihood of their occurrence remains. The violet curve is a “fat-tailed distribution.”
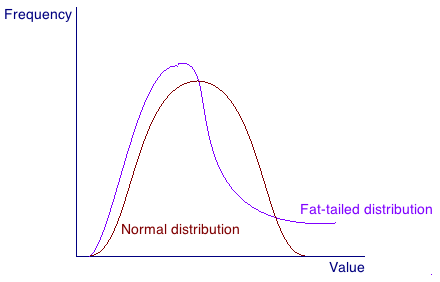
Image attribution: Image 4.1 by Todd Thexton, Financial Impact of Climate Change, Adaptation Learning Network is licensed under CC BY 4.0.
As Nordhaus (2011) points out, if a normal distribution applies to the likelihood of an event’s occurrence, then an unusually large event will only be slightly larger than historical events. But, fat-tailed distributions can produce outliers that are many times greater than historical events. Nordhaus illustrates the difference by comparing the distribution of women’s heights (a normal distribution) with the distribution of earthquake intensities (a fat-tailed distribution): “If you thought earthquakes had a normal distribution, such a tail event [as the 2011 Fukushima earthquake] would be equivalent to observing a twenty-foot-tall woman striding down the street” (Nordhaus, 2011, p. 249.)
The figure below clearly illustrates the higher probability of “surprises” (events that deviate substantially from normal variation) if the likelihood of an event follows a fat-tailed distribution compared to a normal distribution. It illustrates that, with a fat-tailed distribution, even values that are many standard deviations above the mean have probabilities that are not trivial. In the context of climate, those tail surprises could include unimaginably extreme weather events (heatwaves, precipitation events, storms, hurricanes, typhoons).
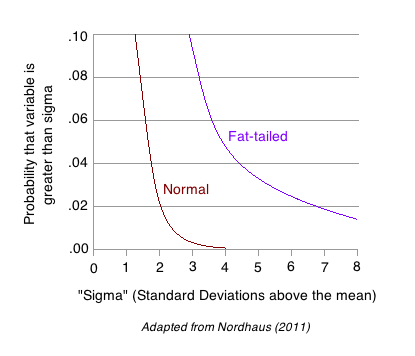
Image attribution: Image 4.2 by Todd Thexton, Financial Impact of Climate Change, Adaptation Learning Network is licensed under CC BY 4.0. This image is adapted from Nordhaus (2011).
The implications of fat-tailed distributions for forecasting financial impacts or for making adaption decisions are significant. If we base our models on averages or the “middle of the distribution” (Weitzman, 2009) and we assume that extreme outliers are too unlikely to be relevant to policy- or strategy-making, we risk both grossly underestimating (human and financial) risks and grossly. Some (for example, Weitzman, 2009, 2011) even go so far to question whether fat-tailed distributions render our typical cost-benefit models obsolete.
