Module 5: Plant and Forest Ecosystem Water, Carbon, and Nutrient Relations
Topic 5.2: Light and Photosynthesis
Forest managers seldom get directly involved in measuring light or rates of photosynthesis, but understanding both well can influence silvicultural decisions substantially. Both light and photosynthesis are tricky to measure in any meaningful way because they vary so much in space and time. For example, it is extremely problematic to predict growth rates of entire plants from knowledge of the photosynthetic rates of portions of single leaves measured over a few minutes under very specific light and moisture conditions. Likewise, light intensities can vary by several orders of magnitude over a few minutes or seconds, or over a few meters or centimeters. Light, photosynthesis, and plant growth are obviously related, the nature of this relationship is extremely complex.
Light not only varies in intensity, it also varies in quality or spectral composition (i.e., representation of different wavelengths). Light intensity and quality affect plants differently, are measured using different equipment, and will be discussed separately.
Intensity of light of the wavelengths required for photosynthesis is referred to as “photosynthetically active radiation” or “PAR” (wavelengths of 400-700 nm, or 0.0000004-0.000007 m). PAR is generally measured using sensors that emit different electrical currents depending on the rate at which they are hit by photons of these wavelengths. Light intensity at noon on a clear day in the center of an open field in the tropics might be 3000 uE/cm2/s. Similar light intensities might be experienced for a few minutes by a forest understory leaf when the sun passes over a small hole in the canopy. A few minutes or seconds later when the “sunflect” has passes, the light intensity experience by the same leaf might plummet to 30 or even 3 uE/cm2/s. Due to this tremendous temporal heterogeneity, plant physiologists prefer measures of light intensity that are integrated over a day, a season, or a full year. Small scale spatial heterogeneity in light intensity an similarly be accounted for by averaging the results from a large number of measurements made on a grid of closely-spaced points. An expensive but convenient alternative to making large numbers of separate measurements is to use a light transect (Figure 5.2.1). Devices for measuring light intensities.) with numerous sensors from which an integrated measure of mean light intensity is calculated automatically.
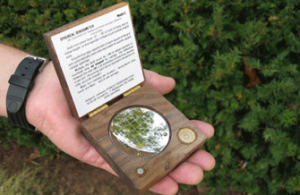
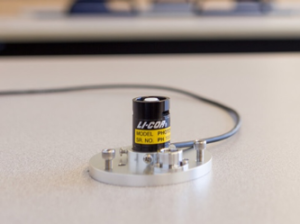
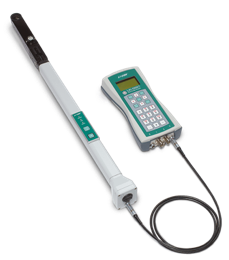
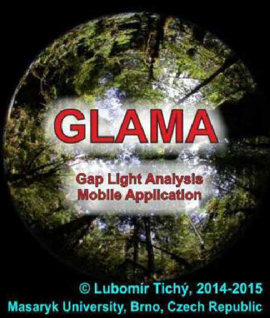
Figure 5.2.1. Devices for measuring light and/or canopy cover. A. A canopy densitometer. B. A light sensor (that needs to be attached to a recording device. C. LiCor 2200C Plant Canopy Analyzer. D. A cell-phone app for canopy cover analysis
The spectral composition, also referred to as the quality, or light is less often measured than intensity, but can be important to consider when conducting shading experiments. Of particular importance is the fact that the ratio of visible red light (670 nm) to the slightly longer wavelength far red light (720 nm), which is invisible to the human eye, can have a variety of influences on seed germination and the ways plants grow. The red:far red ratio varies mostly because red light is absorbed by chlorophyll molecules and used in photosynthesis, whereas far red light is transmitted directly through leaves. Due to differential absorption of these wavelengths by leaves, light under a forest canopy is depleted in the red wavelengths and relatively enriched in far red light. Seeds of some light-demanding species are stimulated to germinate by light with a high red:far red ratio; it is the relative proportions of these two wavelengths, not the light intensity, that triggers germination. A low red:far red ratio, as is found under plant shade, stimulates internode elongation of many species, a response that might increase the likelihood of their escaping from shade. One reason to be aware that light quality as well as intensity affect the ways plants grow is when experimenting with shade. In particular, commercially available shade cloths that transmit a known percentage of light do not mimic the shade cast by plants insofar as they are not differentially transparent to red and far red wavelengths.
Instead of measuring light directly, it is often more convenient or otherwise better to measure characteristics of the overtopping canopy that are related to light intensity. Such measures range greatly in sophistication, cost, and precision. For predicting tree growth rates it is often sufficient to classify trees into crown exposure classes ranging from dominant trees that have fully exposed crowns, to suppressed trees that are entirely overtopped by neighbors (Figure 4.1.1). Crown exposure classes useful for predicting tree growth rates.). Canopy openness over the forest floor can be estimated by isolated points, or lines of points, as being overtopped the canopy or open to the sky. Percent canopy cover over a point in the forest can be estimated using a canopy densiometer, a simple device consisting of a concave or convex mirror with an enscribed grid (Figure 5.2.1). Methods for estimating canopy cover.). Canopy cover or canopy openness is estimated by counting grid points that are either exposed to the sky or covered by a leaf or branch. Users disagree about the precision of canopy densiometer data, but measures by experienced and careful users are replicable and accurate to =-5-10%. For somewhat more accurate measures of canopy cover that can also be used to predict hours of direct sun, many well-funded researchers use hemisphaerical canopy photographs that are digitized and computer analyzed (Figure 5.2.1). Canopy photograph analysis requires training and substantial investments in computer hardware and software, but can predict light availability over a point on the forest floor or over the top of a seedling to =-2-5%. Given the extreme spatial, seasonal, and shorter-term variation in light penetration of forest canopies, however light is assessed, a large number of measurements is usually needed.
Measuring photosynthetic rates is even more complicated and technologically demanding than measuring light. The primary approach is to estimate the rate at which CO2 is absorbed or released by leaves, but O2 flux is often measured in studies of aquatic plants. Although gas exchange rates for entire forests can be estimated by the eddy-flux method Diagrammatic and written explanation of the eddy-flux method.), photosynthetic rates of individual leaves are more commonly measured. By sealing a leaf in a closed chamber and measuring the rate of change in CO2 concentration in the enclosed air, physiologists can estimate rates of photosynthesis or respiration. Simultaneous measurement of light intensity allows construction of “light-curves” such as those shown in Figure 5.2.2). Light curves can suggest a great deal about how a plant responds to different light intensities.
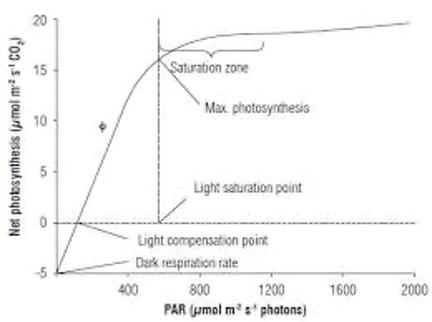
Figure 5.2.2. A light response curve in which CO2 uptake rates are plotted against the intensity of photosynthetically active radiation (PAR).
There are several features of light curves that are of particular relevance to understanding plant growth requirements and for predicting growth rates under different conditions. Perhaps the most important is called the “light compensation point”, which is the intensity of light at which the rate of fixation of CO2 by photosynthesis exactly compensates for the release of CO2 by respiration. Light-demanding plants generally have higher light compensation points than shade tolerant plants. Light-demanding plants also have higher rates of light-saturated photosynthesis and higher light saturation points than shade tolerant plants. These differences are related to the tradeoffs between the benefits of having the photosynthetic machinery needed to benefit from high light intensities, but having to support the substantial respiratory costs of maintaining this machinery, even in the darkThere are several features of light curves that are of particular relevance to understanding plant growth requirements and for predicting growth rates under different conditions. Perhaps the most important is called the “light compensation point”, which is the intensity of light at which the rate of fixation of CO2 by photosynthesis exactly compensates for the release of CO2 by respiration. Light-demanding plants generally have higher light compensation points than shade tolerant plants. Light-demanding plants also have higher rates of light-saturated photosynthesis and higher light saturation points than shade tolerant plants. These differences are related to the tradeoffs between the benefits of having the photosynthetic machinery needed to benefit from high light intensities, but having to support the substantial respiratory costs of maintaining this machinery, even in the darkThere are several features of light curves that are of particular relevance to understanding plant growth requirements and for predicting growth rates under different conditions. Perhaps the most important is called the “light compensation point”, which is the intensity of light at which the rate of fixation of CO2 by photosynthesis exactly compensates for the release of CO2 by respiration. Light-demanding plants generally have higher light compensation points than shade tolerant plants. Light-demanding plants also have higher rates of light-saturated photosynthesis and higher light saturation points than shade tolerant plants. These differences are related to the tradeoffs between the benefits of having the photosynthetic machinery needed to benefit from high light intensities, but having to support the substantial respiratory costs of maintaining this machinery, even in the dark.
It seems like it should be possible to accurately predict growth rates from measures of photosynthetic rates, but such efforts at scaling up from single leaves to whole plants are fraught with difficulties. First of all, spatial and temporal variability in light environments, as has already been stressed, can be substantial even within the crown of a small sapling. To this variability is added the varying effects of water availability on stomatal opening and closing (and hence rates of water loss and CO2 uptake), temperature effects on all biochemical processes, nutrient limitations, leaf and root losses to herbivores, pathogen impacts, and the carbon requirements of mycorrhizal fungi and other symbionts, to mention just a few of the more important factors.
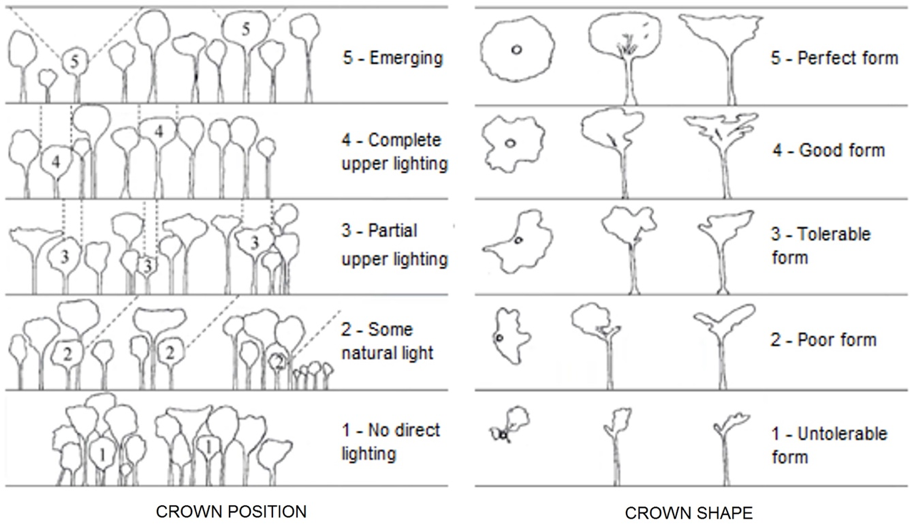
Figure 5.2.3. Crown exposure categories and crown form classes.