Chapter 12: Digital Storytelling
- Expert use of the voice
- Vocal and body expression
- Intonation
- The use of verbal imagery
- Facial animation
- Context
- Plot and character development
- Natural pacing of the telling, and
- Careful authentic recall of the story
So, how can we apply these storytelling techniques to our own organizational stories?
Imagery
Imagery is not just visual. Building on the previous point, there is visual imagery and verbal imagery. Visual imagery describes what we see and is what we traditionally think about when we think of imagery, e.g., photographs, charts, icons, etc. Verbal imagery represents the words and sounds one uses to paint a clear picture in your audience’s minds. In many ways, verbal imagery can trigger stronger memories or emotions by connecting key words and sounds to important concepts, ideas, feelings, and, yes, even brands. This is why jingles can be so effective in branding activities.
Facial Animation
Sharing facial expressions can have a significant impact on your viewers. Are the people in your video smiling or frowning? Are they excited or indifferent? Are they puzzled or enlightened? And remember that even when writing a story, think about the words you are using (verbal imagery) to describe that facial expression and/or animation in your story. This is a good time to point out how emojis have been used to achieve in short-form what authentic facial animation historically achieved for real.
Context (or Setting)
Context orients us in place and time. Context tells the audience what the presented information means to them and why they should care. But be careful about just providing facts. Great communicators provide rich context. Rich context goes beyond merely sharing what is the context and explores why this context is important or how this context might be applicable to even further-reaching circumstances. Rich context has multiple layers, allowing it to resonate with a wider range of audiences.
Plot and Character Development
Every story must have a beginning, middle, and end. The following image, also known as Freytag’s Pyramid, is a commonly used framework when developing stories. Please note that this approach can be used for any length of story.
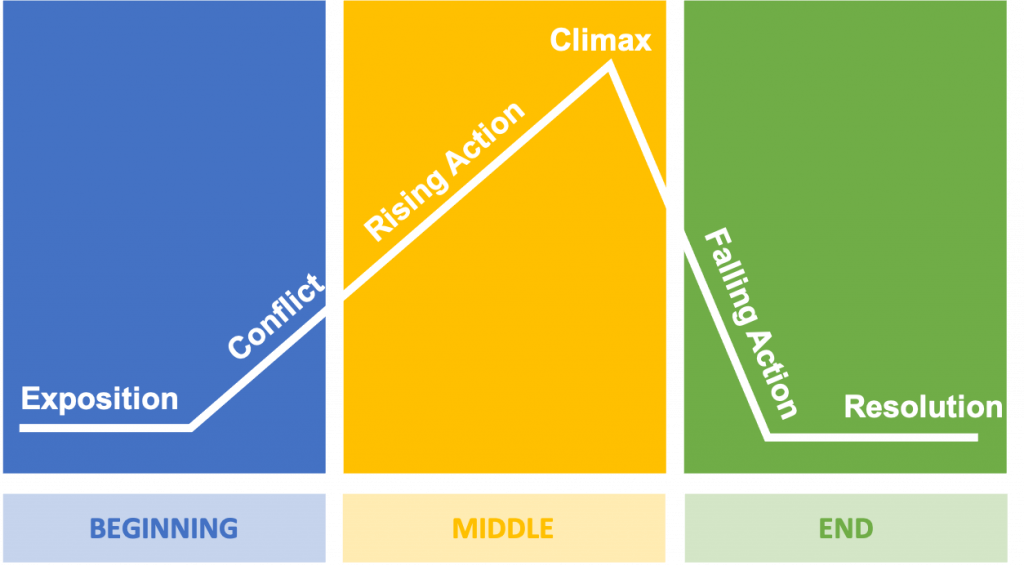
Freytag’s Pyramid
- Exposition
Exposition is the beginning of your story that introduces the three Cs: conflict (key issue/problem), characters (often customers in marketing settings), and the context. - Rising Actions
Rising actions present the events before the climax, where your characters attempt to solve the problem (conflict), but fail. - Climax
The climax represents the turning point or point of greatest suspense/action in your story. - Falling Actions
Falling Actions are the actions and events that happen after the climax. - Resolution
End of the story where the conflicts or problems are solved.
When you are telling your organizational stories, are you clearly including all of these elements? And are you walking your audiences through this entire storytelling journey?
Natural Pacing of the Telling
You need to spend time building your story by setting the foundational pieces in the beginning and middle of your story. Getting to your resolution too quickly can undermine the journey and steps required to get to that point. Take the appropriate time to build your story so that your climax truly presents a turning point in the audiences’ journey.
Careful Authentic Recall of the Story
The best stories are those that are authentic, truthful, and clearly present the issues (conflict) and resolution. While many communicators may try to embellish their stories, stick to the facts and let the story tell the compelling narrative. If you feel the story needs to be embellished to make it more captivating, you may not have a story worth sharing.
As you begin to create your own organizational stories, think about the following questions:
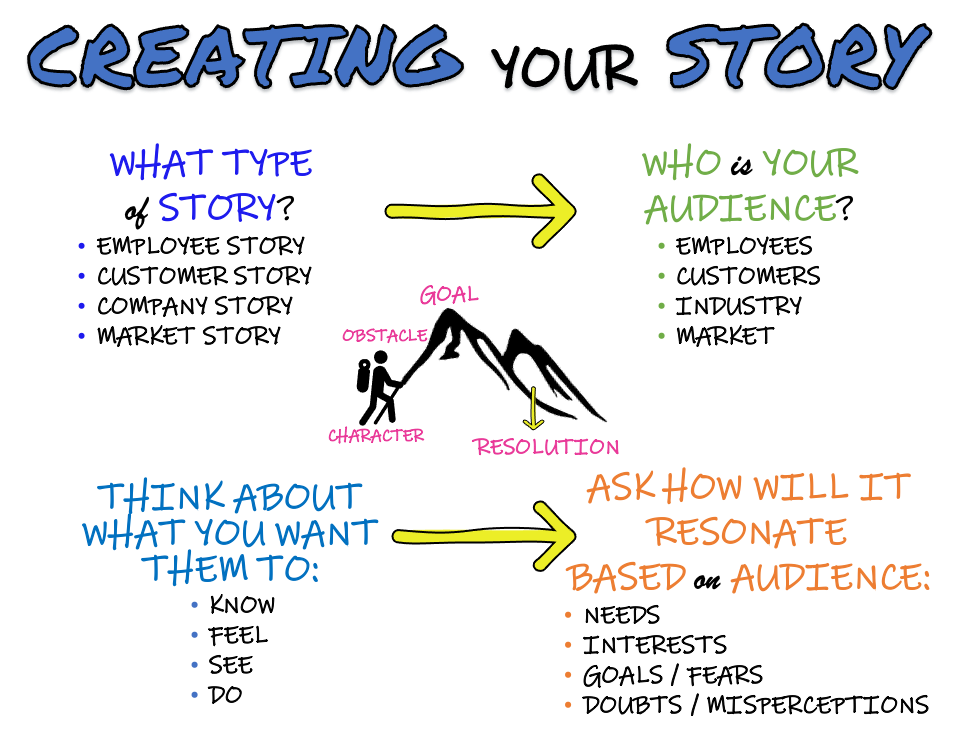
- What kind of story are you creating?
- employee story
- customer story
- organizational story
- sector or industry story
- Who is your audience?
(This should align with the kind of story you are creating.)- employees
- customers (potential and/or existing)
- industry
- market
- What do you want your audience to:
- know
- feel
- see
- do
- How will it resonate with your audience’s mindset:
(This should align with what you want your target audience’s responses to be.)- needs
- interests
- goals/fears
- doubts/misconceptions
Visual Storytelling
![]()
The Importance of Visuals and Why
Now that we’ve discussed how to tell compelling stories, let’s look at visual storytelling and how it has become a critical way stories are told and shared today.
According to Wikipedia,
“Visual storytelling (also visual narrative) is a story told primarily through the use of visual media. The story may be told using still photography, illustration, or video, and can be enhanced with graphics, music, voice and other audio.”
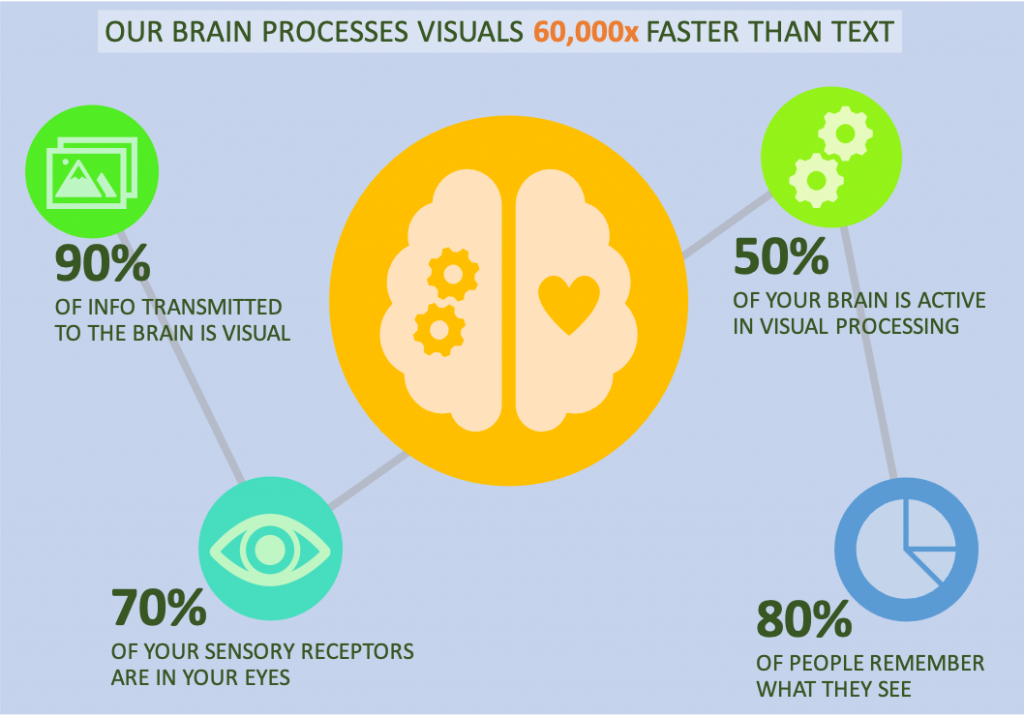
One of the reasons visual storytelling is so powerful is because our brains are wired “visually.” Here are several mind-boggling statistics that explain why visual storytelling is so critical to the digital world we now live in:
- 90% of information transmitted to the brain is visual[1]
- 50% of your brain is active in visual processing[2]
- 70% of your sensory receptors are in your eyes[3]
- It takes only 13 milliseconds for the human brain to process an image.[4]
- Our brain processes visuals 60,000 times faster than text.[5]
- 80% of people remember what they see, [6] compared to 10% what they hear and 20% of what they read.
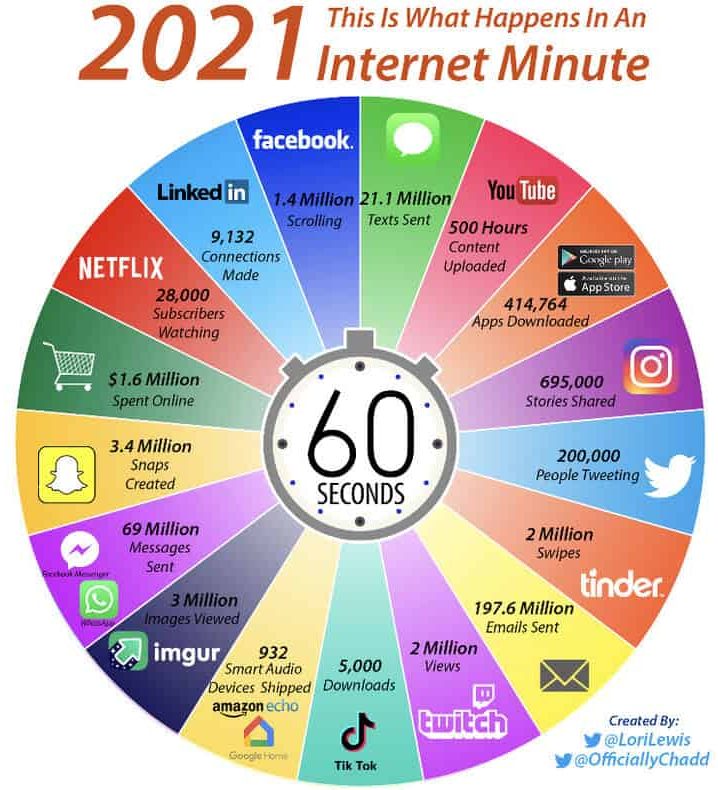
But, what if some of the above information were presented as follows?
 Do you prefer the bullets or the infographic?
In responses to a 2014 survey, 95% of B2B buyers said that they wanted shorter and highly visual content.[7] And, organizations that feature visual content grow traffic 12 times faster than those that don’t.[8]
Also, in comparison, we don’t have much patience for text.
- Most people only read 20-28% of the words on the page.[9]
- 80% of people will watch a video[10], but only 20% of people will read text on a page.
- 55% of website visitors spend less than 15 seconds actively reading.[11]
Unfortunately, we are not great listeners, either. When people hear information, they’re likely to remember only 10% of that information three days later. However, if a relevant image is paired with that same information, people retained 65% of the information[12] three days later.
We also love to consume and share pictures, infographics, and videos:
- More than 100 million photos and videos are posted daily on Instagram.[13]
- Tweets with images receive 150% more retweets[14] than tweets without them.
- On Facebook, photos have an interaction rate of 87%, [15] compared to 4% or less for other types of posts, such as links or text.
- 100 million hours of video are watched every day on Facebook, [16] 85% of them with the sound off.
- 6 billion video ads[17] are watched online each year.
- Posts that include images produce 650% higher engagement[18] than text-only posts.
- People share infographics three times more[19] than any other type of content.
- Using the word “video” in an email subject line[20] boosts open rates by 19% and clickthrough rates by 65%.
And, finally, from an organizational perspective, video drives our purchasing and/or conversion decisions:
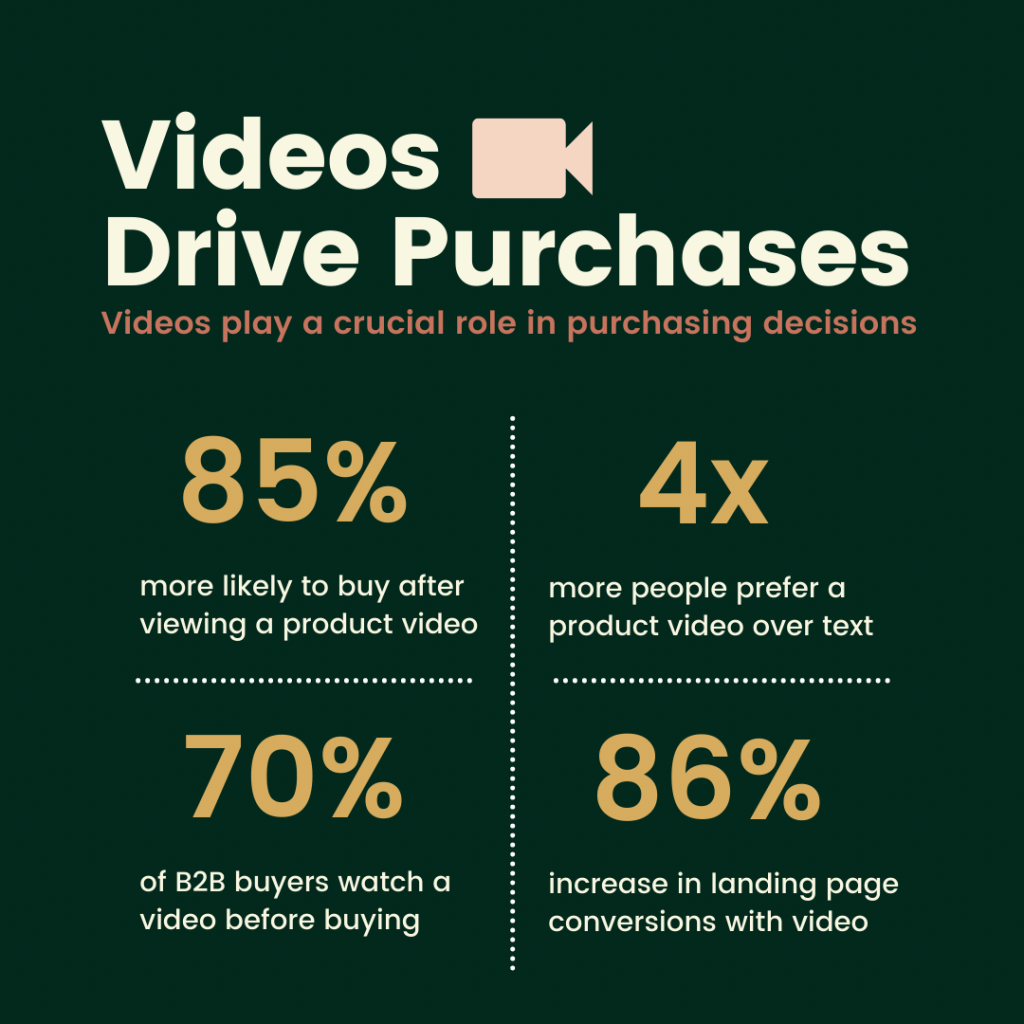
- 70% of B2B buyers and researchers watch a video during their purchase process.[21]
- Four times as many consumers would rather watch a video about a product than read about it.[22]
- People are 85 percent more likely to buy a product after viewing a product video.[23]
- Videos on landing pages increase conversions by up to 86%.[24]
Visuals are an important and inherent part of how we process information. And, as communicators with global audiences, relying on universal imagery—instead of specific written languages or words—allows your messages and stories to be much more accessible to a wider audience. So, if you are looking to have the greatest impact, internally or externally, you will need to understand how to present your story and information in a visual way that grabs your audience’s attention and tells a compelling story.
Media Attributions
- Freytag’s Pyramid by Rochelle Grayson is licensed under a CC BY 4.0 licence.
- Creating your story by Rochelle Grayson is licensed under a CC BY 4.0 licence.
- Visually thinking icon by Rochelle Grayson is licensed under a CC BY 4.0 licence.
- The reasons visuals are important by Rochelle Grayson is licensed under a CC BY 4.0 licence.
- What happens in an Internet minute – 2021 © Lori Lewis and Chadd LunaLeKat is for educational, non-commercial use only.
- Videos drives purchases by Rochelle Grayson is licensed under a CC BY 4.0 licence.
- First Nations Pedagogy Online ↵
- Humans Process Visual Data Better ↵
- How do we transform an ever-changing jumble of visual stimuli into the rich and coherent three-dimensional perception we know as sight? Rochester vision scientists are helping reshape our understanding of how the brain ‘sees.’ ↵
- The Eye and Vision ↵
- What is the Impact of Visual Content Marketing? ↵
- Humans Process Visual Data Better ↵
- 12 Hard Stats That Proof The Power Of Images ↵
- B2B Content Preferences Survey: Buyers Want Short, Visual, Mobile-Optimized Content ↵
- The Rising Power of Visual Content [Infographic] ↵
- The Power of Visual Communication ↵
- Digital Marketing by the Numbers: Stats, Demographics & Fun Facts ↵
- Visual Content Statistics Infographic ↵
- Brain rule rundown ↵
- Instagram by the Numbers: Stats, Demographics & Fun Facts ↵
- Link Tweet with an Image vs. Tweet with Twitter Cards, Does it Matter? ↵
- Six Reasons to Embrace Visual Commerce in 2018 ↵
- 52 Video Marketing Statistics 2022 [Infographic] ↵
- 52 Video Marketing Statistics 2022 [Infographic] ↵
- 16 Visual Content Marketing Statistics That Will Wake You Up ↵
- 15 Visual Content Marketing Statistics That’ll Blow Your Mind ↵
- How to Increase Your Email Open and Click-through Rates ↵
- A Step-by-Step Guide to Develop a Content Marketing Strategy That Converts ↵
- The Rising Power of Visual Content [Infographic] ↵
- 16 Eye-Popping Statistics You Need to Know About Visual Content MarketingVisual content marketing is one big trend you need to embrace. And for good reason. ↵
- 52 Video Marketing Statistics 2022 [Infographic] ↵
Attributions
This chapter was adapted from Foundations in Digital Marketing: Building Meaningful Customer Relationships and Engaged Audiences by Rochelle Grayson, which is licensed under a Creative Commons Attribution 4.0 International License, except where otherwise noted.
