2.3 Project Estimating Process
Project Estimating Process apply estimating techniques to deliver project estimates with known level of accuracy. There are different ways of presenting and adjusting estimates given a particular context as follows:
Deterministic and Probabilistic estimating: Deterministic estimates are also known as point estimates and it presents a single number or amount such as 24 months. Probabilistic estimating include a range of estimates along with associated probabilities within the range.
Absolute and relative estimating: Absolute estimates are specific information and use actual numbers – eg. 100 hours of work. Relative estimates are shown in comparison to other estimates. Relative estimates only have meaning within a given context.
Flow-based estimating: Flow-based estimating provide an estimate to complete a specific quantity of work. The estimates are developed by determining the cycle time and throughput. Cycle time is the total elapsed time it takes one unit to get through a process. Throughput is the number of items that can complete a process in a given amount of time.
Adjusting estimates for uncertainty: Estimates are inherently uncertain and therefore associated with risk. It is important to establish the range of uncertainty for various parameters.
Evolving Estimates and the Concept of Progressive Elaboration
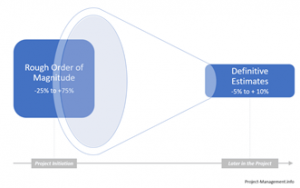
Rough Order of Magnitude vs. Definitive Estimate
All project estimates involve assumptions, constraints, uncertainty and risk. Estimate confidence level is directly related to activity definition and available data therefore project estimation is an iterative and evolving process which aligns with the concept of progressive elaboration. As more information about the project becomes available the estimates are fine-tuned to higher levels of precision and confidence.
According to the PMBOK and the Practice Standard for Estimating, a project in the Start-up phase may have a rough order of magnitude (ROM) estimate with an accuracy in the range of -25% to +75%. As more information is known, the estimates could narrow to a range of -10% to +15 or to a definitive estimate with an accuracy range of -5% to +10%. Therefore the definitive estimate is determined in the course of the project when more information and resources for accurate estimates are available. Note that every industry is different and there are industry-specific types of estimates such as design and bid estimates in construction projects.
Types of Project Estimation Approaches – Estimating Techniques
The PMI Practice Standard for Estimating Projects identifies three estimating techniques categories:
Quantitative estimation are most likely applied to numerically estimate effort, duration and cost. This technique may not be applicable to all situations applicable data, experience or time may not be applicable.
Relative estimating techniques are high level estimating techniques that uses information that is currently available and known to the team doing the estimating work. This approach takes advantage of human capacity to compare things to other things and avoids comparisons with abstract concepts such as dollars and days.
Qualitative estimates rely on understanding of processes, behaviours and conditions as perceived by individuals or team. Qualitative estimation generate textual or non-numeric estimates and range from semi structured to unstructured techniques. Qualitative estimates are technique used where the project have elements that are difficult to quantify.
Note that it is important to consider the complexities of projects and the fact that activities vary. Some projects may apply one techniques or various techniques may be applied at different stages during the project life cycle. For example many agile teams adopt unique estimating techniques like planning poker, ideal hours, or story points to determine a numeric value for the task at hand.

Quantitative Estimation
Analogous Estimating (Top down Estimating)
Analogous estimating also refers to as Top-down Estimating uses observed cost figures and related values in previous projects. In order to be accurate, the type and nature of these reference activities must be comparable with the current project. This technique uses historical data in the form of values and parameters to determine the expected resource requirements of a current project. The historic values are adopted for the current work and can be adjusted for differences in scope or complexity. In general, analogous estimates are used if a project has access to historical data on similar types of work while the details and resources for more accurate estimates in the current project, such as parametric or bottom-up estimating, are not available. It is important to make sure that projects are really comparable since projects that appear similar, such as road construction, can actually cost vastly different amounts depending on other factors — such as local landscapes and climates. Types of analogous estimation include: ratio and range estimations
With estimation by analogy in Agile, story sizes are compared with other stories. This relative sizing approach is helpful when making assumptions relevant to agile estimations. For effective Agile estimation using analogy, the triangulation method is widely used. According to the triangulation method, the user story is estimated against similar intent user stories that have already been estimated. Analogous Estimating in Agile uses cases:
- If retrospectives are a part of the process
- Among teams that have a good mutual understanding
- Among highly experienced teams
Parametric Estimating
Parametric estimating is a statistical approach to estimating resources. It is based on the assumed or proven relationship of parameters and values. Examples are the building cost per square foot in construction projects or the implementation cost per data field in IT projects.
Parametric estimates are often used in construction projects, e.g. to determine cost of the material. However, differences between the current project and historical projects need to be taken into account when using parametric estimates.
Because of the fact that complexities of projects and activities vary certain adjustments may be required. For example, building a highway in a mountainous region will likely produces a higher cost per mile than in a flat area. Another example to consider is the project environment. Where an IT development projects is complex and requires a complex IT architectures, more resources will be required compared to a less complex environment.
Another consideration concerns the expertise and experience of the project team. If a previous project was delivered by highly skilled and experienced resources while the current team is just at the beginning of its learning curve, using unadjusted historic data may understate the estimated cost.
Similar to analogous estimates, adjustments can be made to adapt the parametric estimates to the current project.
Depending on the quality of the input data and its applicability to the current type of work, the parametric estimation technique can produce very accurate figures. However, the higher the accuracy desired the more resources are needed to perform the data gathering and statistical analyses.
Bottom-up Estimation
Bottom-up estimation refers to a technique that involves estimating the cost at a granular level of work units. The estimates for all components of a project are then aggregated in order to determine the overall project cost estimate. These estimates are often performed at the lowest level of the work breakdown structure (WBS), e.g. for work packages or even activities. Project team members who are operationally in charge of the respective work packages or activities are the right people to estimate the work. This techniques comes with significantly higher accuracy than top-down estimations. However, obtaining and aggregating these granular estimates normally requires some resources and can potentially become political challenge, especially in large or complex projects.
Three-Point Estimating
As the name suggests, this technique requires determining three different duration estimates:
- an optimistic,
- a pessimistic, and
- a ‘most likely’ estimate.
It can be used as a range estimate or further processed, e.g. by calculating a final estimate using a triangular or PERT distribution. Expert judgment and analogous estimating are typically done without calculations.
Assuming a triangular distribution of the three estimates the calculation of the final estimate is:
E = (O + M + P) / 3
where:
E = Estimation using three-point estimation,
O = Optimistic duration estimate,
M = Most likely duration estimate,
P = Pessimistic duration estimate.
An alternative to this triangular calculation is the PERT method.
The PERT beta distribution takes into account the ‘most likely’ case is more likely to occur which is reflected in a multiplier for that estimate. The PMI methodology suggests this calculation as an alternative to the triangular distribution for cost estimates. In this method, the most likely estimate receives a multiplier of 4 while the overall divisor is increased to 6. The formula is as follows:
E = (O + 4*M + P) / 6
where:
E = Expected amount of time or cost,
O = Optimistic estimate,
M = Most likely estimate,
P = Pessimistic estimate.
The Standard Deviation of the PERT distribution is calculated using the formula:
Standard Deviation = (P – O) / 6
Example of a Three-Point Estimate and PERT
A team of subject matter experts is estimating the time it takes to complete an activity. In this example, the duration of an activity is estimated using the three-point estimating technique. They come up with the following numbers:
| Optimistic estimate | 10 days |
| Pessimistic estimate | 25 days |
| Most likely estimate | 19 days |
The values range from 10 days (optimistic) to 25 days (pessimistic). A duration of 19 days is deemed to be the most likely amount of time needed for the completion of the work.
Calculating the Expected Duration with a Triangular Distribution
The expected duration using a triangular distribution is calculated as follows:
Final Estimate = (10 + 25 + 19) / 3.
The resulting final estimate under this method is 18, which is basically the unweighted average of the 3 estimates.
Calculating the Expected Duration Using PERT Beta Distribution
The expected duration can also be calculated with the PERT method:
Final Estimate (expected value) = (10 + 4×19 + 25) / 6.
The resulting expected value is 18.5 days which is greater than the final estimate determined under the triangular method. This is due to the higher weight (i.e. the multiplier of 4) that is assigned to the ‘most likely’ estimate.
The standard deviation of this estimation is:
Standard Deviation = (25 – 10) / 6 = 2.5
Using the PERT method allows taking probabilities of value ranges into account. This is useful if the quality of estimates varies, e.g. if the difference between optimistic and pessimistic estimates is significantly deviating among different activities. In this case, using ranges and their probabilities will reflect the scattering and level of confidence of the underlying estimates.
- The team is new to Agile estimation
- Running later-stage estimations
- There are highly prioritized backlogs
Relative Estimation Techniques
Estimating resources and in particular cost using agile development approach involves everyone on the team. Each team member brings a different perspective on the product and the work required to deliver a user story. Relative estimating is a method for creating estimates that are derived from performing a comparison against a similar body of work, taking effort, complexity, and uncertainty into consideration.
Affinity Grouping
Affinity Estimating is a technique many Agile teams use to quickly and easily estimate a large number of user stories in story points. This is a great technique starting a project with a backlog that has not been estimated yet.
Affinity grouping can be used as a collaborative prioritization activity. It works by having your group of participants brainstorm ideas and opportunities on Post-It Notes. The team then works to put the sticky notes into groups of similar items. Once the groups are created, the team votes on the groups to rank them.

Affinity Mapping use cases:
- Estimating a long-term plan for a project
- Gaining mutual understanding in the team
- There are large backlogs to handle
- Running early-stage estimations
Planning Poker
Planning Poker is an agile estimating technique which is a consensus-based technique used to estimate the product backlogs by Agile teams. To estimate the Product Backlog, a customer or Product Owner reads the user stories or describes the features of the product to the estimators.
Number-coded playing cards are used to estimate an item. The cards are distributed across the team (sized 2-10), with each of the cards representing a valid estimate.
The reading on the cards could be something such as — 0, 1, 2, 3, 5, 8, 13, 20, 40, and 100. Now, the product owner or the analyst describes the user story to the team, and the team can ask any related queries.
Each team member secretly selects a card number for an estimate, which is revealed when all the cards are turned over. The card with the most voting is the finalized estimate for the item under discussion. In case of uneven estimates, meetings are held, and the next round of voting commences to come up with an estimate everyone agrees with

Planning Poker use cases:
- There are a small number of items
- Establishing mutual understanding among team members
- Running late-stage estimations
- The backlogs are highly prioritized
Qualitative Estimation Techniques
Expert judgement: Besides being an estimation technique on its own, expert judgment is inherent to the other estimation techniques such as bottom-up and top-down estimating. Its accuracy depends on the number and experience of the experts involved, the clarity of the planned activities and the type of project.
Observations, interviews and surveys are other types of qualitative techniques.
Other considerations include:
- Labour costs: The people who will be working on the project are often also the largest cost component of it. Taking the time to estimate the labour rates is important and may require market analysis.
- Vendor bid analysis: Sometimes external organizations are required on the project. The project may send out RFQs (Request for Quotations) or RFPs (Request for Proposals). RFQs are used when the project team knows the required solution but is unable to provide it internally. RFPs are used when the project team does not know the required solution and requests proposals from organizations with relevant expertise. In both instances, the bids must be analyzed and evaluated in order to determine which is best for the project.
- Cost of quality: Many project teams overlook the costs associated with the quality-related tasks for a project. This includes measures to error-proof solutions, create checklists, and inspect deliverables before they are presented to stakeholders for review and sign-off. Since it is cheaper to identify flaws earlier than later in the project, there are always quality costs associated with everything a project produces. Cost of quality is a way of tracking the cost of those tasks. It is the amount of money it takes to assure that the project is executed efficiently.
- Reserve analysis: Is a method used to evaluate the amount of risk on the project and amount of schedule and budget reserve to determine whether the reserve is sufficient for the remaining risk. It is important to set aside some money for cost overruns. Higher-risk projects require more reserve than lower-risk projects. The reserve is intended to assist the project team with managing risks by putting mitigating strategies in place.
Additional Considerations
It is important to determine the level of detail needed to effectively manage the project. Large, complex projects require more coordination. The level of detail that can be achieved at the beginning of the project will depend on the clarity of the end outcome. In projects with clear outcomes (predictive/waterfall), it is possible to develop detailed estimates from the onset. In projects that do not have clear outcomes (agile), the detailed estimates can only be produced as the user requirements become clear.
There are two types of reserves:
- Contingency reserves are funds set aside to manage the identified risks. Because there is a chance that these funds will be required, the contingency reserve is incorporated into the project budget. If this fund is adequate to meet the project’s unplanned expenses, then the project will be complete within the budget.
- Management reserves are funds set aside to manage situations that are not anticipated. These situations can be positive and negative. An example of a positive situation is the discovery of new technology that will revolutionize the way the project objectives are achieved. The necessary funds can be made available to take advantage of this opportunity at the project sponsor’s discretion. If such an opportunity were pursued, it would result in a significant change in the project’s scope, especially if the predictive/waterfall development methodology was used. Unlike contingency reserves, management reserves are unlikely to be spent and are not part of the project’s cost baseline. However, they may be included in the funding made available to the project.
Estimates can change over time and it is important to consider new information as it becomes available. In addition, it is also important to document the assumptions you make and the source of the supporting information used to make the assumptions. This makes it easier to analyze variances and revise projections as needed.