Chapter 15 The Sun: A Garden-Variety Star
15.4 Space Weather
Learning Objectives
By the end of this section, you will be able to:
- Explain what space weather is and how it affects Earth
In the previous sections, we have seen that some of the particles coming off the Sun—either steadily as in the solar wind or in great bursts like CMEs—will reach Earth and its magnetosphere (the zone of magnetic influence that surrounds our planet). As if scientists did not have enough trouble trying to predict weather on Earth, this means that they are now facing the challenge of predicting the effects of solar storms on Earth. This field of research is called space weather; when that weather turns stormy, our technology turns out to be at risk.
With thousands of satellites in orbit, astronauts taking up long-term residence in the International Space Station, millions of people using cell phones, GPS, and wireless communication, and nearly everyone relying on the availability of dependable electrical power, governments are now making major investments in trying to learn how to predict when solar storms will occur and how strongly they will affect Earth.
Some History
What we now study as space weather was first recognized (though not yet understood) in 1859, in what is now known as the Carrington Event. In early September of that year, two amateur astronomers, including Richard Carrington in England, independently observed a solar flare. This was followed a day or two later by a significant solar storm reaching the region of Earth’s magnetic field, which was soon overloaded with charged particles (see Earth as a Planet).
As a result, aurora activity was intense and the northern lights were visible well beyond their normal locations near the poles—as far south as Hawaii and the Caribbean. The glowing lights in the sky were so intense that some people reported getting up in the middle of the night, thinking it must be daylight.
The 1859 solar storm happened at a time when a new technology was beginning to tie people in the United States and some other countries together: the telegraph system. This was a machine and network for sending messages in code through overhead electrical wires (a bit like a very early version of the internet). The charged particles that overwhelmed Earth’s magnetic field descended toward our planet’s surface and affected the wires of the telegraph system. Sparks were seen coming out of exposed wires and out of the telegraph machines in the system’s offices.
The observation of the bright flare that preceded these effects on Earth led to scientific speculation that a connection existed between solar activity and impacts on Earth—this was the beginning of our understanding of what today we call space weather.
Sources of Space Weather
Three solar phenomena—coronal holes, solar flares, and CMEs—account for most of the space weather we experience. Coronal holes allow the solar wind to flow freely away from the Sun, unhindered by solar magnetic fields. When the solar wind reaches Earth, as we saw, it causes Earth’s magnetosphere to contract and then expand after the solar wind passes by. These changes can cause (usually mild) electromagnetic disturbances on Earth.
More serious are solar flares, which shower the upper atmosphere of Earth with X-rays, energetic particles, and intense ultraviolet radiation. The X-rays and ultraviolet radiation can ionize atoms in Earth’s upper atmosphere, and the freed electrons can build up a charge on the surface of a spacecraft. When this static charge discharges, it can damage the electronics in the spacecraft—just as you can receive a shock when you walk across a carpet in your stocking feet in a dry climate and then touch a light switch or some other metal object.
Most disruptive are coronal mass ejections. A CME is an erupting bubble of tens of millions of tons of gas blown away from the Sun into space. When this bubble reaches Earth a few days after leaving the Sun, it heats the ionosphere, which expands and reaches farther into space. As a consequence, friction between the atmosphere and spacecraft increases, dragging satellites to lower altitudes.
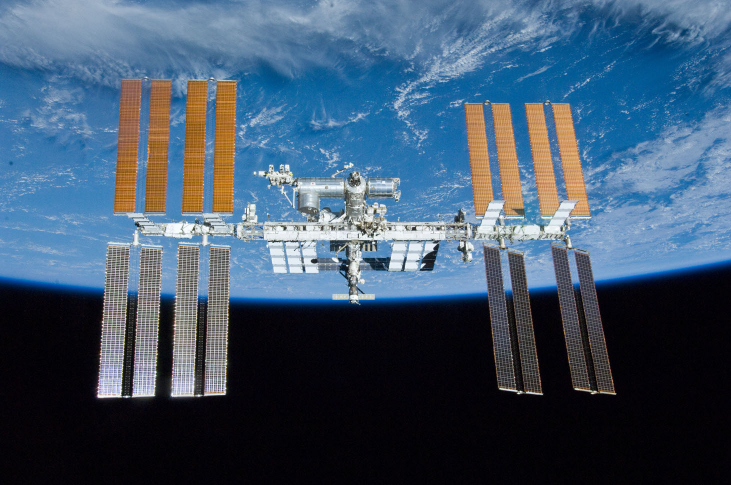
At the time of a particularly strong flare and CME in March 1989, the system responsible for tracking some 19,000 objects orbiting Earth temporarily lost track of 11,000 of them because their orbits were changed by the expansion of Earth’s atmosphere. During solar maximum, a number of satellites are brought to such a low altitude that they are destroyed by friction with the atmosphere. Both the Hubble Space Telescope and the International Space Station ([link]) require reboosts to higher altitude so that they can remain in orbit.
Solar Storm Damage on Earth
When a CME reaches Earth, it distorts Earth’s magnetic field. Since a changing magnetic field induces electrical current, the CME accelerates electrons, sometimes to very high speeds. These “killer electrons” can penetrate deep into satellites, sometimes destroying their electronics and permanently disabling operation. This has happened with some communications satellites.
Disturbances in Earth’s magnetic field can cause disruptions in communications, especially cell phone and wireless systems. In fact, disruptions can be expected to occur several times a year during solar maximum. Changes in Earth’s magnetic field due to CMEs can also cause surges in power lines large enough to burn out transformers and cause major power outages. For example, in 1989, parts of Montreal and Quebec Province in Canada were without power for up to 9 hours as a result of a major solar storm. Electrical outages due to CMEs are more likely to occur in North America than in Europe because North America is closer to Earth’s magnetic pole, where the currents induced by CMEs are strongest.
Besides changing the orbits of satellites, CMEs can also distort the signals sent by them. These effects can be large enough to reduce the accuracy of GPS-derived positions so that they cannot meet the limits required for airplane systems, which must know their positions to within 160 feet. Such disruptions caused by CMEs have occasionally forced the Federal Aviation Administration to restrict flights for minutes or, in a few cases, even days.
Solar storms also expose astronauts, passengers in high-flying airplanes, and even people on the surface of Earth to increased amounts of radiation. Astronauts, for example, are limited in the total amount of radiation to which they can be exposed during their careers. A single ill-timed solar outburst could end an astronaut’s career. This problem becomes increasingly serious as astronauts spend more time in space. For example, the typical daily dose of radiation aboard the Russian Mir space station was equivalent to about eight chest X-rays. One of the major challenges in planning the human exploration of Mars is devising a way to protect astronauts from high-energy solar radiation.
Advance warning of solar storms would help us minimize their disruptive effects. Power networks could be run at less than their full capacity so that they could absorb the effects of power surges. Communications networks could be prepared for malfunctions and have backup plans in place. Spacewalks could be timed to avoid major solar outbursts. Scientists are now trying to find ways to predict where and when flares and CMEs will occur, and whether they will be big, fast events or small, slow ones with little consequence for Earth.
The strategy is to relate changes in the appearance of small, active regions and changes in local magnetic fields on the Sun to subsequent eruptions. However, right now, our predictive capability is still poor, and so the only real warning we have is from actually seeing CMEs and flares occur. Since a CME travels outward at about 500 kilometers per second, an observation of an eruption provides several days warning at the distance of Earth. However, the severity of the impact on Earth depends on how the magnetic field associated with the CME is oriented relative to Earth’s magnetic field. The orientation can be measured only when the CME flows past a satellite we have put up for this purpose. However, it is located only about an hour upstream from Earth.
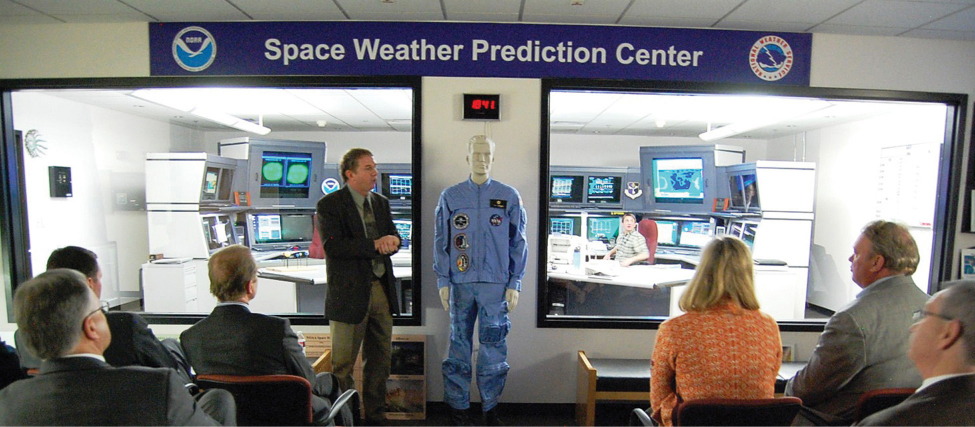
Space weather predictions are now available online to scientists and the public. Outlooks are given a week ahead, bulletins are issued when there is an event that is likely to be of interest to the public, and warnings and alerts are posted when an event is imminent or already under way ([link]).
Fortunately, we can expect calmer space weather for the next few years, since the most recent solar maximum, which was relatively weak, occurred in 2014, and scientists believe the current solar cycle to be one of the least active in recent history. We expect more satellites to be launched that will allow us to determine whether CMEs are headed toward Earth and how big they are. Models are being developed that will then allow scientists to use early information about the CME to predict its likely impact on Earth.
The hope is that by the time of the next maximum, solar weather forecasting will have some of the predictive capability that meteorologists have achieved for terrestrial weather at Earth’s surface. However, the most difficult events to predict are the largest and most damaging storms—hurricanes on Earth and extreme, rare storm events on the Sun. Thus, it is inevitable that the Sun will continue to surprise us.
A basic equation is useful in figuring out when events on the Sun will impact Earth:
Dividing both sides by v, we get
Suppose you observe a major solar flare while astronauts are orbiting Earth. If the average speed of solar wind is 400 km/s and the distance to the Sun as 1.496 × 10⁸ km, how long it will before the charged particles ejected from the Sun during the flare reach the space station?
Solution
The time required for solar wind particles to reach Earth is T = D/v.
Check Your Learning
How many days would it take for the particles to reach Earth if the solar wind speed increased to 500 km/s?
$$\frac{1.496\phantom{\rule{0.2em}{0ex}}\times\phantom{\rule{0.2em}{0ex}}{10}^{8}\phantom{\rule{0.2em}{0ex}}\text{km}}{500\phantom{\rule{0.2em}{0ex}}\text{km/s}}=2.99\phantom{\rule{0.2em}{0ex}}\times\phantom{\rule{0.2em}{0ex}}{10}^{5}\phantom{\rule{0.2em}{0ex}}\text{s},\phantom{\rule{0.2em}{0ex}}\text{or}\phantom{\rule{0.5em}{0ex}}\frac{2.99\phantom{\rule{0.2em}{0ex}}\times{10}^{5}\phantom{\rule{0.2em}{0ex}}\text{s}}{60\phantom{\rule{0.2em}{0ex}}\text{s/min}\phantom{\rule{0.2em}{0ex}}\times\phantom{\rule{0.2em}{0ex}}60\phantom{\rule{0.2em}{0ex}}\text{min/h}\phantom{\rule{0.2em}{0ex}}\times\phantom{\rule{0.2em}{0ex}}24\phantom{\rule{0.2em}{0ex}}\text{h/d}}=3.46\phantom{\rule{0.2em}{0ex}}\text{d}$$
Earth’s Climate and the Sunspot Cycle: Is There a Connection?
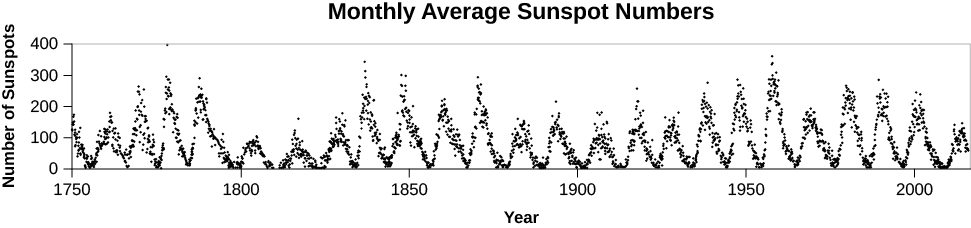
While the Sun rises faithfully every day at a time that can be calculated precisely, scientists have determined that the Sun’s energy output is not truly constant but varies over the centuries by a small amount—probably less than 1%. We’ve seen that the number of sunspots varies, with the time between sunspot maxima of about 11 years, and that the number of sunspots at maximum is not always the same. Considerable evidence shows that between the years 1645 and 1715, the number of sunspots, even at sunspot maximum, was much lower than it is now. This interval of significantly low sunspot numbers was first noted by Gustav Spӧrer in 1887 and then by E. W. Maunder in 1890; it is now called the Maunder Minimum. The variation in the number of sunspots over the past three centuries is shown in [link]. Besides the Maunder Minimum in the seventeenth century, sunspot numbers were somewhat lower during the first part of the nineteenth century than they are now; this period is called the Little Maunder Minimum.
When the number of sunspots is high, the Sun is active in various other ways as well, and, as we will see in several sections below, some of this activity affects Earth directly. For example, there are more auroral displays when the sunspot number is high. Auroras are caused when energetically charged particles from the Sun interact with Earth’s magnetosphere, and the Sun is more likely to spew out particles when it is active and the sunspot number is high. Historical accounts also indicate that auroral activity was abnormally low throughout the several decades of the Maunder Minimum.
The Maunder Minimum was a time of exceptionally low temperatures in Europe—so low that this period is described as the Little Ice Age. This coincidence in time caused scientists to try to understand whether small changes in the Sun could affect the climate on Earth. There is clear evidence that it was unusually cold in Europe during part of the seventeenth century. The River Thames in London froze at least 11 times, ice appeared in the oceans off the coasts of southeast England, and low summer temperatures led to short growing seasons and poor harvests. However, whether and how changes on the Sun on this timescale influence Earth’s climate is still a matter of debate among scientists.
Other small changes in climate like the Little Ice Age have occurred and have had their impacts on human history. For example, explorers from Norway first colonized Iceland and then reached Greenland by 986. From there, they were able to make repeated visits to the northeastern coasts of North America, including Newfoundland, between about 1000 and 1350. (The ships of the time did not allow the Norse explorers to travel all the way to North America directly, but only from Greenland, which served as a station for further exploration.)
Most of Greenland is covered by ice, and the Greenland station was never self-sufficient; rather, it depended on imports of food and other goods from Norway for its survival. When a little ice age began in the thirteenth century, voyaging became very difficult, and support of the Greenland colony was no longer possible. The last-known contact with it was made by a ship from Iceland blown off course in 1410. When European ships again began to visit Greenland in 1577, the entire colony there had disappeared.
The estimated dates for these patterns of migration follow what we know about solar activity. Solar activity was unusually high between 1100 and 1250, which includes the time when the first European contacts were made with North America. Activity was low from 1280 to 1340 and there was a little ice age, which was about the time regular contact with North America and between Greenland and Europe stopped.
One must be cautious, however, about assuming that low sunspot numbers or variations in the Sun’s output of energy caused the Little Ice Age. There is no satisfactory model that can explain how a reduction in solar activity might cause cooler temperatures on Earth. An alternative possibility is that the cold weather during the Little Ice Age was related to volcanic activity. Volcanoes can eject aerosols (tiny droplets or particles) into the atmosphere that efficiently reflect sunlight. Observations show, for example, that the Pinatubo eruption in 1991 ejected SO2 aerosols into the atmosphere, which reduced the amount of sunlight reaching Earth’s surface enough to lower global temperatures by 0.4 °C.
Satellite data show that the energy output from the Sun during a solar cycle varies by only about 0.1%. We know of no physical process that would explain how such a small variation could cause global temperature changes. The level of solar activity may, however, have other effects. For example, although the Sun’s total energy output varies by only 0.1% during a solar cycle, its extreme ultraviolet radiation is 10 times higher at times of solar maximum than at solar minimum. This large variation can affect the chemistry and temperature structure of the upper atmosphere. One effect might be a reduction in the ozone layer and a cooling of the stratosphere near Earth’s poles. This, in turn, could change the circulation patterns of winds aloft and, hence, the tracks of storms. There is some recent evidence that variations in regional rainfall correlate better with solar activity than does the global temperature of Earth. But, as you can see, the relationship between what happens on the Sun and what happens to Earth’s climate over the short term is still an area that scientists are investigating and debating.
Whatever the effects of solar activity may be on local rainfall or temperature patterns, we want to emphasize one important idea: Our climate change data and the models developed to account for the data consistently show that solar variability is not the cause of the global warming that has occurred during the past 50 years.
Key Concepts and Summary
Space weather is the effect of solar activity on our own planet, both in our magnetosphere and on Earth’s surface. Coronal holes allow more of the Sun’s material to flow out into space. Solar flares and coronal mass ejections can cause auroras, disrupt communications, damage satellites, and cause power outages on Earth.
For Further Exploration
Articles
Berman, B. “How Solar Storms Could Shut Down Earth.” Astronomy (September 2013): 22. Up-to-date review of how events on the Sun can hurt our civilization.
Frank, A. “Blowin’ in the Solar Wind.” Astronomy (October 1998): 60. On results from the SOHO spacecraft.
Holman, G. “The Mysterious Origins of Solar Flares.” Scientific American (April 2006): 38. New ideas involving magnetic reconnection and new observations of flares.
James, C. “Solar Forecast: Storm Ahead.” Sky & Telescope (July 2007): 24. Nice review on the effects of the Sun’s outbursts and on Earth and how we monitor “space weather.”
Schaefer, B. “Sunspots That Changed the World.” Sky & Telescope (April 1997): 34. Historical events connected with sunspots and solar activity.
Schrijver, C. and Title, A. “Today’s Science of the Sun.” Sky & Telescope (February 2001): 34; (March 2001): 34. Excellent reviews of recent results about the solar atmosphere.
Wadhwa, M. “Order from Chaos: Genesis Samples the Solar Wind.” Astronomy (October 2013): 54. On a satellite that returned samples of the Sun’s wind.
Websites
Dr. Sten Odenwald’s “Solar Storms” site: http://www.solarstorms.org/.
ESA/NASA’s Solar & Heliospheric Observatory: http://sohowww.nascom.nasa.gov. A satellite mission with a rich website to explore.
High Altitude Observatory Introduction to the Sun: http://www.hao.ucar.edu/education/basic.php. For beginners.
NASA’s Solar Missions: https://www.nasa.gov/mission_pages/sunearth/missions/index.html. Good summary of the many satellites and missions NASA has.
NOAA Profile of Space Weather: http://www.swpc.noaa.gov/sites/default/files/images/u33/primer_2010_new.pdf. A primer.
NOAA Space Weather Prediction Center Information Pages: http://www.swpc.noaa.gov/content/education-and-outreach. Includes primers, videos, a curriculum and training modules.
Nova Sun Lab: http://www.pbs.org/wgbh/nova/labs/lab/sun/. Videos, scientist profiles, a research challenge related to the active Sun from the PBS science program.
Space Weather: Storms on the Sun: http://www.swpc.noaa.gov/sites/default/files/images/u33/swx_booklet.pdf. An illustrated booklet from NOAA.
Stanford Solar Center: http://solar-center.stanford.edu/. An excellent site with information for students and teachers.
Apps
These can tell you and your students more about what’s happening on the Sun in real time.
NASA’s 3-D Sun: http://3dsun.org/.
NASA Space Weather: https://itunes.apple.com/us/app/nasa-space-weather/id422621403?mt=8.
Solaris Alpha: https://play.google.com/store/apps/details?id=com.tomoreilly.solarisalpha.
Solar Monitor Pro: http://www.solarmonitor.eu/.
Videos
Journey into the Sun: https://www.youtube.com/watch?v=fqKFQ7z0Nuk. 2010 KQED Quest TV Program mostly about the Solar Dynamics Observatory spacecraft, its launch and capabilities, but with good general information on how the Sun works (12:24).
NASA | SDO: Three Years in Three Minutes--With Expert Commentary: https://www.youtube.com/watch?v=QaCG0wAjJSY&src. Video of 3 years of observations of the Sun by the Solar Dynamics Observatory made into a speeded up movie, with commentary by solar physicist Alex Young (5:03).
Our Explosive Sun: http://www.youtube.com/watch?v=kI6YGSIJqrE. Video of a 2011 public lecture in the Silicon Valley Astronomy Lecture Series by Dr. Thomas Berger about solar activity and recent satellite missions to observe and understand it (1:20:22).
Out There Raining Fire: http://www.nytimes.com/video/science/100000003489464/out-there-raining-fire.html?emc=eta1. Nice overview and introduction to the Sun by science reporter Dennis Overbye of the NY Times (2:28)
Space Weather Impacts: http://www.swpc.noaa.gov/content/education-and-outreach. Video from NOAA (2:47); https://www.youtube.com/playlist?list=PLBdd8cMH5jFmvVR2sZubIUzBO6JI0Pvx0. Videos from the National Weather Service (four short videos) (14:41).
Space Weather: Storms on the Sun: http://www.youtube.com/watch?v=vWsmp4o-qVg. Science bulletin from the American Museum of Natural History, giving the background to what happens on the Sun to cause space weather (6:10).
Sun Storms: http://www.livescience.com/11754-sun-storms-havoc-electronic-world.html. From the Starry Night company about storms from the Sun now and in the past (4:49).
Sunspot Group AR 2339 Crosses the Sun: http://apod.nasa.gov/apod/ap150629.html. Short video (with music) animates Solar Dynamics Observatory images of an especially large sunspot group going across the Sun’s face (1:15).
What Happens on the Sun Doesn’t Stay on the Sun: https://www.youtube.com/watch?v=bg_gD2-ujCk. From the National Oceanic and Atmospheric Administration: introduction to the Sun, space weather, its effects, and how we monitor it (4:56).
Collaborative Group Activities
- Have your group make a list of all the ways the Sun personally affects your life on Earth. (Consider the everyday effects as well as the unusual effects due to high solar activity.)
- Long before the nature of the Sun was fully understood, astronomer (and planet discoverer) William Herschel (1738–1822) proposed that the hot Sun may have a cool interior and may be inhabited. Have your group discuss this proposal and come up with modern arguments against it.
- We discussed how the migration of Europeans to North America was apparently affected by short-term climate change. If Earth were to become significantly hotter, either because of changes in the Sun or because of greenhouse warming, one effect would be an increase in the rate of melting of the polar ice caps. How would this affect modern civilization?
- Suppose we experience another Maunder Minimum on Earth, and it is accompanied by a drop in the average temperature like the Little Ice Age in Europe. Have your group discuss how this would affect civilization and international politics. Make a list of the most serious effects that you can think of.
- Watching sunspots move across the disk of the Sun is one way to show that our star rotates on its axis. Can your group come up with other ways to show the Sun’s rotation?
- Suppose in the future, we are able to forecast space weather as well as we forecast weather on Earth. And suppose we have a few days of warning that a big solar storm is coming that will overload Earth’s magnetosphere with charged particles and send more ultraviolet and X-rays toward our planet. Have your group discuss what steps we might take to protect our civilization?
- Have your group members research online to find out what satellites are in space to help astronomers study the Sun. In addition to searching for NASA satellites, you might also check for satellites launched by the European Space Agency and the Japanese Space Agency.
- Some scientists and engineers are thinking about building a “solar sail”—something that can use the Sun’s wind or energy to propel a spacecraft away from the Sun. The Planetary Society is a nonprofit organization that is trying to get solar sails launched, for example. Have your group do a report on the current state of solar-sail projects and what people are dreaming about for the future.
Review Questions
1: Describe the main differences between the composition of Earth and that of the Sun.
2: Describe how energy makes its way from the nuclear core of the Sun to the atmosphere. Include the name of each layer and how energy moves through the layer.
3: Make a sketch of the Sun’s atmosphere showing the locations of the photosphere, chromosphere, and corona. What is the approximate temperature of each of these regions?
4: Why do sunspots look dark?
5: Which aspects of the Sun’s activity cycle have a period of about 11 years? Which vary during intervals of about 22 years?
6: Summarize the evidence indicating that over several hundreds of years or more there have been variations in the level of the solar activity.
7: What it the Zeeman effect and what does it tell us about the Sun?
8: Explain how the theory of the Sun’s dynamo results in an average 22-year solar activity cycle. Include the location and mechanism for the dynamo.
9: Compare and contrast the four different types of solar activity above the photosphere.
10: What are the two sources of particles coming from the Sun that cause space weather? How are they different?
11: How does activity on the Sun affect human technology on Earth and in the rest of the solar system?
12: How does activity on the Sun affect natural phenomena on Earth?
Thought Questions
13: [link] indicates that the density of the Sun is 1.41 g/cm3. Since other materials, such as ice, have similar densities, how do you know that the Sun is not made of ice?
14: Starting from the core of the Sun and going outward, the temperature decreases. Yet, above the photosphere, the temperature increases. How can this be?
15: Since the rotation period of the Sun can be determined by observing the apparent motions of sunspots, a correction must be made for the orbital motion of Earth. Explain what the correction is and how it arises. Making some sketches may help answer this question.
16: Suppose an (extremely hypothetical) elongated sunspot forms that extends from a latitude of 30° to a latitude of 40° along a fixed of longitude on the Sun. How will the appearance of that sunspot change as the Sun rotates? ([link] should help you figure this out.)
17: The text explains that plages are found near sunspots, but [link] shows that they appear even in areas without sunspots. What might be the explanation for this?
18: Why would a flare be observed in visible light, when they are so much brighter in X-ray and ultraviolet light?
19: How can the prominences, which are so big and ‘float’ in the corona, stay gravitationally attached to the Sun while flares can escape?
20: If you were concerned about space weather and wanted to avoid it, where would be the safest place on Earth for you to live?
21: Suppose you live in northern Canada and an extremely strong flare is reported on the Sun. What precautions might you take? What might be a positive result?
Figuring for Yourself
22: The edge of the Sun doesn’t have to be absolutely sharp in order to look that way to us. It just has to go from being transparent to being completely opaque in a distance that is smaller than your eye can resolve. Remember from Astronomical Instruments that the ability to resolve detail depends on the size of the telescope’s aperture. The pupil of your eye is very small relative to the size of a telescope and therefore is very limited in the amount of detail you can see. In fact, your eye cannot see details that are smaller than 1/30 of the diameter of the Sun (about 1 arcminute). Nearly all the light from the Sun emerges from a layer that is only about 400 km thick. What fraction is this of the diameter of the Sun? How does this compare with the ability of the human eye to resolve detail? Suppose we could see light emerging directly from a layer that was 300,000 km thick. Would the Sun appear to have a sharp edge?
23: Show that the statement that 92% of the Sun’s atoms are hydrogen is consistent with the statement that 73% of the Sun’s mass is made up of hydrogen, as found in [link]. (Hint: Make the simplifying assumption, which is nearly correct, that the Sun is made up entirely of hydrogen and helium.)
24: From Doppler shifts of the spectral lines in the light coming from the east and west edges of the Sun, astronomers find that the radial velocities of the two edges differ by about 4 km/s, meaning that the Sun’s rotation rate is 2 km/s. Find the approximate period of rotation of the Sun in days. The circumference of a sphere is given by 2πR, where R is the radius of the sphere.
25: Assuming an average sunspot cycle of 11 years, how many revolutions does the equator of the Sun make during that one cycle? Do higher latitudes make more or fewer revolutions compared to the equator?
26: This chapter gives the average sunspot cycle as 11 years. Verify this using [link].
27: The escape velocity from any astronomical object can be calculated as $${v}_{\text{escape}}=\sqrt{2GM\text{/}R}$$. Using the data in Appendix E, calculate the escape velocity from the photosphere of the Sun. Since coronal mass ejections escape from the corona, would the escape velocity from there be more or less than from the photosphere?
28: Suppose you observe a major solar flare while astronauts are orbiting Earth. Use the data in the text to calculate how long it will before the charged particles ejected from the Sun during the flare reach them.
29: Suppose an eruptive prominence rises at a speed of 150 km/s. If it does not change speed, how far from the photosphere will it extend after 3 hours? How does this distance compare with the diameter of Earth?
30: From the information in [link], estimate the speed with which the particles in the CME in parts (c) and (d) are moving away from the Sun.
