Chapter 20 Between the Stars: Gas and Dust in Space
20.6 Interstellar Matter around the Sun
Learning Objectives
By the end of this section, you will be able to:
- Describe how interstellar matter is arranged around our solar system
- Explain why scientists think that the Sun is located in a hot bubble
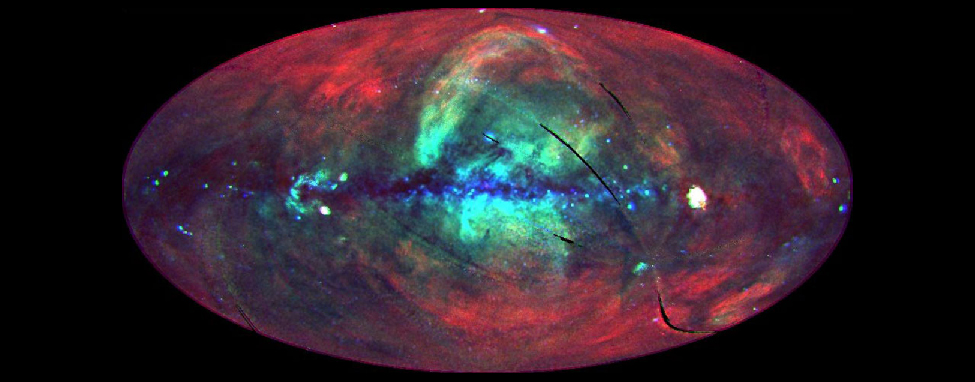
We want to conclude our discussion of interstellar matter by asking how this material is organized in our immediate neighborhood. As we discussed above, orbiting X-ray observatories have shown that the Galaxy is full of bubbles of hot, X-ray-emitting gas. They also revealed a diffuse background of X-rays that appears to fill the entire sky from our perspective ([link]). While some of this emission comes from the interaction of the solar wind with the interstellar medium, a majority of it comes from beyond the solar system. The natural explanation for why there is X-ray-emitting gas all around us is that the Sun is itself inside one of the bubbles. We therefore call our “neighborhood” the Local Hot Bubble, or Local Bubble for short. The Local Bubble is much less dense—an average of approximately 0.01 atoms per cm3—than the average interstellar density of about 1 atom per cm3. This local gas has a temperature of about a million degrees, just like the gas in the other superbubbles that spread throughout our Galaxy, but because there is so little hot material, this high temperature does not affect the stars or planets in the area in any way.
What caused the Local Bubble to form? Scientists are not entirely sure, but the leading candidate is winds from stars and supernova explosions. In a nearby region in the direction of the constellations Scorpius and Centaurus, a lot of star formation took place about 15 million years ago. The most massive of these stars evolved very quickly until they produced strong winds, and some ended their lives by exploding. These processes filled the region around the Sun with hot gas, driving away cooler, denser gas. The rim of this expanding superbubble reached the Sun about 7.6 million years ago and now lies more than 200 light-years past the Sun in the general direction of the constellations of Orion, Perseus, and Auriga.
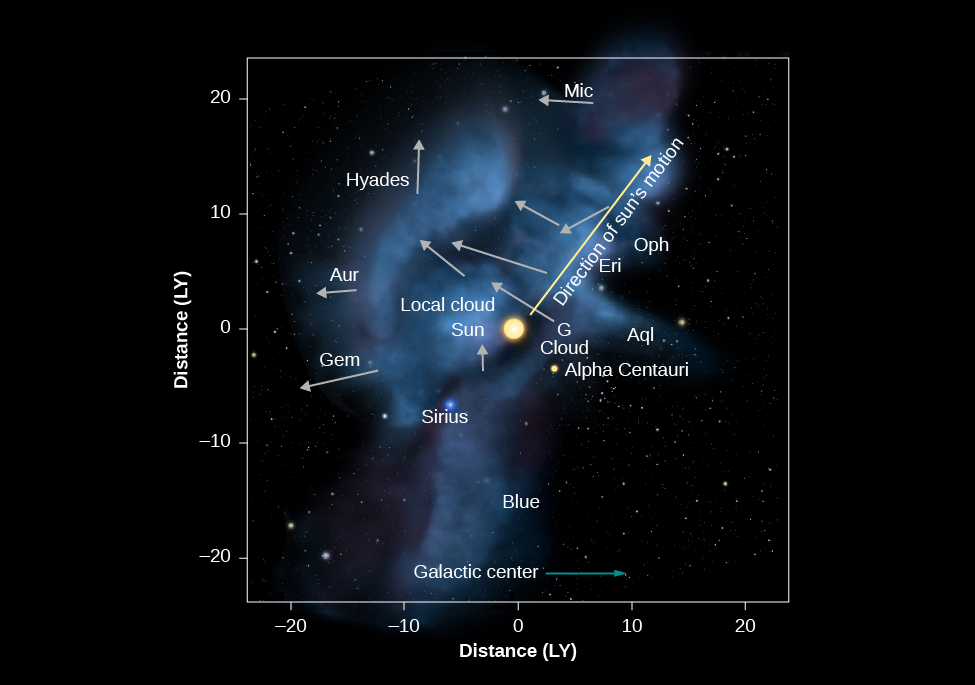
A few clouds of interstellar matter do exist within the Local Bubble. The Sun itself seems to have entered a cloud about 10,000 years ago. This cloud is warm (with a temperature of about 7000 K) and has a density of 0.3 hydrogen atom per cm3—higher than most of the Local Bubble but still so tenuous that it is also referred to as Local Fluff ([link]). (Aren’t these astronomical names fun sometimes?)
While this is a pretty thin cloud, we estimate that it contributes 50 to 100 times more particles than the solar wind to the diffuse material between the planets in our solar system. These interstellar particles have been detected and their numbers counted by the spacecraft traveling between the planets. Perhaps someday, scientists will devise a way to collect them without destroying them and to return them to Earth, so that we can touch—or at least study in our laboratories—these messengers from distant stars.
Key Concepts and Summary
The Sun is located at the edge of a low-density cloud called the Local Fluff. The Sun and this cloud are located within the Local Bubble, a region extending to at least 300 light-years from the Sun, within which the density of interstellar material is extremely low. Astronomers think this bubble was blown by some nearby stars that experienced a strong wind and some supernova explosions.
For Further Exploration
Articles
Goodman, A. “Recycling the Universe.” Sky & Telescope November (2000): 44. Review of how stellar evolution, the interstellar medium, and supernovae all work together to recycle cosmic material.
Greenberg, J. “The Secrets of Stardust.” Scientific American December (2000): 70. The makeup and evolutionary role of solid particles between the stars.
Knapp, G. “The Stuff between the Stars.” Sky & Telescope May (1995): 20. An introduction to the interstellar medium.
Nadis, S. “Searching for the Molecules of Life in Space.” Sky & Telescope January (2002): 32. Recent observations of water in the interstellar medium by satellite telescopes.
Olinto, A. “Solving the Mystery of Cosmic Rays.” Astronomy April (2014): 30. What accelerates them to such high energies.
Reynolds, R. “The Gas between the Stars.” Scientific American January (2002): 34. On the interstellar medium.
Websites and Apps
Barnard, E. E., Biographical Memoir: http://www.nasonline.org/publications/biographical-memoirs/memoir-pdfs/barnard-edward.pdf.
Cosmicopia: http://helios.gsfc.nasa.gov/cosmic.html. NASA’s learning site explains about the history and modern understanding of cosmic rays.
DECO: https://wipac.wisc.edu/deco. A smart-phone app for turning your phone into a cosmic-ray detector.
Hubble Space Telescope Images of Nebulae: http://hubblesite.org/gallery/album/nebula/. Click on any of the beautiful images in this collection, and you are taken to a page with more information; while looking at these images, you may also want to browse through the slide sequence on the meaning of colors in the Hubble pictures (http://hubblesite.org/gallery/behind_the_pictures/meaning_of_color/).
Interstellar Medium Online Tutorial: http://www-ssg.sr.unh.edu/ism/intro.htm. Nontechnical introduction to the interstellar medium (ISM) and how we study it; by the University of New Hampshire astronomy department.
Messier Catalog of Nebulae, Clusters, and Galaxies: http://astropixels.com/messier/messiercat.html. Astronomer Fred Espenak provides the full catalog, with information and images. (The Wikipedia list does something similar: https://en.wikipedia.org/wiki/List_of_Messier_objects.)
Nebulae: What Are They?: http://www.universetoday.com/61103/what-is-a-nebula/. Concise introduction by Matt Williams.
Videos
Barnard 68: The Hole in the Sky: https://www.youtube.com/watch?v=8No6I0Uc3No. About this dark cloud and dark clouds in interstellar space in general (02:08).
Horsehead Nebula in New Light: http://www.esa.int/spaceinvideos/Videos/2013/04/The_Horsehead_Nebula_in_new_light. Tour of the dark nebula in different wavelengths; no audio narration, just music, but explanatory material appears on the screen (03:03).
Hubblecast 65: A Whole New View of the Horsehead Nebula: http://www.spacetelescope.org/videos/heic1307a/. Report on nebulae in general and about the Horsehead specifically, with ESO astronomer Joe Liske (06:03).
Interstellar Reddening: https://www.youtube.com/watch?v=H2M80RAQB6k. Video demonstrating how reddening works, with Scott Miller of Penn State; a bit nerdy but useful (03:45).
Collaborative Group Activities
- The Sun is located in a region where the density of interstellar matter is low. Suppose that instead it were located in a dense cloud 20 light-years in diameter that dimmed the visible light from stars lying outside it by a factor of 100. Have your group discuss how this would have affected the development of civilization on Earth. For example, would it have presented a problem for early navigators?
- Your group members should look through the pictures in this chapter. How big are the nebulae you see in the images? Are there any clues either in the images or in the captions? Are the clouds they are part of significantly bigger than the nebulae we can see? Why? Suggest some ways that we can determine the sizes of nebulae.
- How do the members of your group think astronomers are able to estimate the distances of such nebulae in our own Galaxy? (Hint: Look at the images. Can you see anything between us and the nebula in some cases. Review Celestial Distances, if you need to remind yourself about methods of measuring distances.)
- The text suggests that a tube of air extending from the surface of Earth to the top of the atmosphere contains more atoms than a tube of the same diameter extending from the top of the atmosphere to the edge of the observable universe. Scientists often do what they call “back of the envelope calculations,” in which they make very rough approximations just to see whether statements or ideas are true. Try doing such a “quick and dirty” estimate for this statement with your group. What are the steps in comparing the numbers of atoms contained in the two different tubes? What information do you need to make the approximations? Can you find it in this text? And is the statement true?
- If your astronomy course has involved learning about the solar system before you got to this chapter, have your group discuss where else besides interstellar clouds astronomers have been discovering organic molecules (the chemical building blocks of life). How might the discoveries of such molecules in our own solar system be related to the molecules in the clouds discussed in this chapter?
- Two stars both have a reddish appearance in telescopes. One star is actually red; the other’s light has been reddened by interstellar dust on its way to us. Have your group make a list of the observations you could perform to determine which star is which.
- You have been asked to give a talk to your little brother’s middle school class on astronomy, and you decide to talk about how nature recycles gas and dust. Have your group discuss what images from this book you would use in your talk. In what order? What is the one big idea you would like the students to remember when the class is over?
- This chapter and the next (on The Birth of Stars) include some of the most beautiful images of nebulae that glow with the light produced when starlight interacts with gas and dust. Have your group select one to four of your favorite such nebulae and prepare a report on them to share with the rest of the class. (Include such things as their location, distance, size, way they are glowing, and what is happening within them.)
Review Questions
1: Identify several dark nebulae in photographs in this chapter. Give the figure numbers of the photographs, and specify where the dark nebulae are to be found on them.
2: Why do nebulae near hot stars look red? Why do dust clouds near stars usually look blue?
3: Describe the characteristics of the various kinds of interstellar gas (HII regions, neutral hydrogen clouds, ultra-hot gas clouds, and molecular clouds).
4: Prepare a table listing the different ways in which dust and gas can be detected in interstellar space.
5: Describe how the 21-cm line of hydrogen is formed. Why is this line such an important tool for understanding the interstellar medium?
6: Describe the properties of the dust grains found in the space between stars.
7: Why is it difficult to determine where cosmic rays come from?
8: What causes reddening of starlight? Explain how the reddish color of the Sun’s disk at sunset is caused by the same process.
9: Why do molecules, including H2 and more complex organic molecules, only form inside dark clouds? Why don’t they fill all interstellar space?
10: Why can’t we use visible light telescopes to study molecular clouds where stars and planets form? Why do infrared or radio telescopes work better?
11: The mass of the interstellar medium is determined by a balance between sources (which add mass) and sinks (which remove it). Make a table listing the major sources and sinks, and briefly explain each one.
12: Where does interstellar dust come from? How does it form?
Thought Questions
13: [link] shows a reddish glow around the star Antares, and yet the caption says that is a dust cloud. What observations would you make to determine whether the red glow is actually produced by dust or whether it is produced by an H II region?
14: If the red glow around Antares is indeed produced by reflection of the light from Antares by dust, what does its red appearance tell you about the likely temperature of Antares? Look up the spectral type of Antares in Appendix J. Was your estimate of the temperature about right? In most of the images in this chapter, a red glow is associated with ionized hydrogen. Would you expect to find an H II region around Antares? Explain your answer.
15: Even though neutral hydrogen is the most abundant element in interstellar matter, it was detected first with a radio telescope, not a visible light telescope. Explain why. (The explanation given in Analyzing Starlight for the fact that hydrogen lines are not strong in stars of all temperatures may be helpful.)
16: The terms H II and H2 are both pronounced “H two.” What is the difference in meaning of those two terms? Can there be such a thing as H III?
17: Suppose someone told you that she had discovered H II around the star Aldebaran. Would you believe her? Why or why not?
18: Describe the spectrum of each of the following:
- starlight reflected by dust,
- a star behind invisible interstellar gas, and
- an emission nebula.
19: According to the text, a star must be hotter than about 25,000 K to produce an H II region. Both the hottest white dwarfs and main-sequence O stars have temperatures hotter than 25,000 K. Which type of star can ionize more hydrogen? Why?
20: From the comments in the text about which kinds of stars produce emission nebulae and which kinds are associated with reflection nebulae, what can you say about the temperatures of the stars that produce NGC 1999 ([link])?
21: One way to calculate the size and shape of the Galaxy is to estimate the distances to faint stars just from their observed apparent brightnesses and to note the distance at which stars are no longer observable. The first astronomers to try this experiment did not know that starlight is dimmed by interstellar dust. Their estimates of the size of the Galaxy were much too small. Explain why.
22: New stars form in regions where the density of gas and dust is relatively high. Suppose you wanted to search for some recently formed stars. Would you more likely be successful if you observed at visible wavelengths or at infrared wavelengths? Why?
23: Thinking about the topics in this chapter, here is an Earth analogy. In big cities, you can see much farther on days without smog. Why?
24: Stars form in the Milky Way at a rate of about 1 solar mass per year. At this rate, how long would it take for all the interstellar gas in the Milky Way to be turned into stars if there were no fresh gas coming in from outside? How does this compare to the estimated age of the universe, 14 billion years? What do you conclude from this?
25: The 21-cm line can be used not just to find out where hydrogen is located in the sky, but also to determine how fast it is moving toward or away from us. Describe how this might work.
26: Astronomers recently detected light emitted by a supernova that was originally observed in 1572, just reaching Earth now. This light was reflected off a dust cloud; astronomers call such a reflected light a “light echo” (just like reflected sound is called an echo). How would you expect the spectrum of the light echo to compare to that of the original supernova?
27: We can detect 21-cm emission from other galaxies as well as from our own Galaxy. However, 21-cm emission from our own Galaxy fills most of the sky, so we usually see both at once. How can we distinguish the extragalactic 21-cm emission from that arising in our own Galaxy? (Hint: Other galaxies are generally moving relative to the Milky Way.)
28: We have said repeatedly that blue light undergoes more extinction than red light, which is true for visible and shorter wavelengths. Is the same true for X-rays? Look at [link]. The most dust is in the galactic plane in the middle of the image, and the red color in the image corresponds to the reddest (lowest-energy) light. Based on what you see in the galactic plane, are X-rays experiencing more extinction at redder or bluer colors? You might consider comparing [link] to [link].
29: Suppose that, instead of being inside the Local Bubble, the Sun were deep inside a giant molecular cloud. What would the night sky look like as seen from Earth at various wavelengths?
30: Suppose that, instead of being inside the Local Bubble, the Sun were inside an H II region. What would the night sky look like at various wavelengths?
Figuring for Yourself
31: A molecular cloud is about 1000 times denser than the average of the interstellar medium. Let’s compare this difference in densities to something more familiar. Air has a density of about 1 kg/m3, so something 1000 times denser than air would have a density of about 1000 kg/m3. How does this compare to the typical density of water? Of granite? (You can find figures for these densities on the internet.) Is the density difference between a molecular cloud and the interstellar medium larger or smaller than the density difference between air and water or granite?
32: Would you expect to be able to detect an H II region in X-ray emission? Why or why not? (Hint: You might apply Wien’s law)
33: Suppose that you gathered a ball of interstellar gas that was equal to the size of Earth (a radius of about 6000 km). If this gas has a density of 1 hydrogen atom per cm3, typical of the interstellar medium, how would its mass compare to the mass of a bowling ball (5 or 6 kg)? How about if it had the typical density of the Local Bubble, about 0.01 atoms per cm3? The volume of a sphere is V = (4/3)πR3.
34: At the average density of the interstellar medium, 1 atom per cm3, how big a volume of material must be used to make a star with the mass of the Sun? What is the radius of a sphere this size? Express your answer in light-years.
35: Consider a grain of sand that contains 1 mg of oxygen (a typical amount for a medium-sized sand grain, since sand is mostly SiO2). How many oxygen atoms does the grain contain? What is the radius of the sphere you would have to spread them out over if you wanted them to have the same density as the interstellar medium, about 1 atom per cm3? You can look up the mass of an oxygen atom.
36: H II regions can exist only if there is a nearby star hot enough to ionize hydrogen. Hydrogen is ionized only by radiation with wavelengths shorter than 91.2 nm. What is the temperature of a star that emits its maximum energy at 91.2 nm? (Use Wien’s law from Radiation and Spectra.) Based on this result, what are the spectral types of those stars likely to provide enough energy to produce H II regions?
37: In the text, we said that the five-times ionized oxygen (OVI) seen in hot gas must have been produced by supernova shocks that heated the gas to millions of degrees, and not by starlight, the way H II is produced. Producing OVI by light requires wavelengths shorter than 10.9 nm. The hottest observed stars have surface temperatures of about 50,000 K. Could they produce OVI?
38: Dust was originally discovered because the stars in certain clusters seemed to be fainter than expected. Suppose a star is behind a cloud of dust that dims its brightness by a factor of 100. Suppose you do not realize the dust is there. How much in error will your distance estimate be? Can you think of any measurement you might make to detect the dust?
39: How would the density inside a cold cloud (T = 10 K) compare with the density of the ultra-hot interstellar gas (T = 106 K) if they were in pressure equilibrium? (It takes a large cloud to be able to shield its interior from heating so that it can be at such a low temperature.) (Hint: In pressure equilibrium, the two regions must have nT equal, where n is the number of particles per unit volume and T is the temperature.) Which region do you think is more suitable for the creation of new stars? Why?
40: The text says that the Local Fluff, which surrounds the Sun, has a temperature of 7500 K and a density 0.1 atom per cm3. The Local Fluff is embedded in hot gas with a temperature of 106 K and a density of about 0.01 atom per cm3. Are they in equilibrium? (Hint: In pressure equilibrium, the two regions must have nT equal, where n is the number of particles per unit volume and T is the temperature.) What is likely to happen to the Local Fluff?
Glossary
- Local Bubble
- (or Local Hot Bubble) a region of low-density, million degree gas in which the Sun and solar system are currently located
- Local Fluff
- a slightly denser cloud inside the Local Bubble, inside which the Sun also lies
