Chapter 17 Analyzing Starlight
17.4 Using Spectra to Measure Stellar Radius, Composition, and Motion
Learning Objectives
By the end of this section, you will be able to:
- Understand how astronomers can learn about a star’s radius and composition by studying its spectrum
- Explain how astronomers can measure the motion and rotation of a star using the Doppler effect
- Describe the proper motion of a star and how it relates to a star’s space velocity
Analyzing the spectrum of a star can teach us all kinds of things in addition to its temperature. We can measure its detailed chemical composition as well as the pressure in its atmosphere. From the pressure, we get clues about its size. We can also measure its motion toward or away from us and estimate its rotation.
Clues to the Size of a Star
As we shall see in The Stars: A Celestial Census, stars come in a wide variety of sizes. At some periods in their lives, stars can expand to enormous dimensions. Stars of such exaggerated size are called giants. Luckily for the astronomer, stellar spectra can be used to distinguish giants from run-of-the-mill stars (such as our Sun).
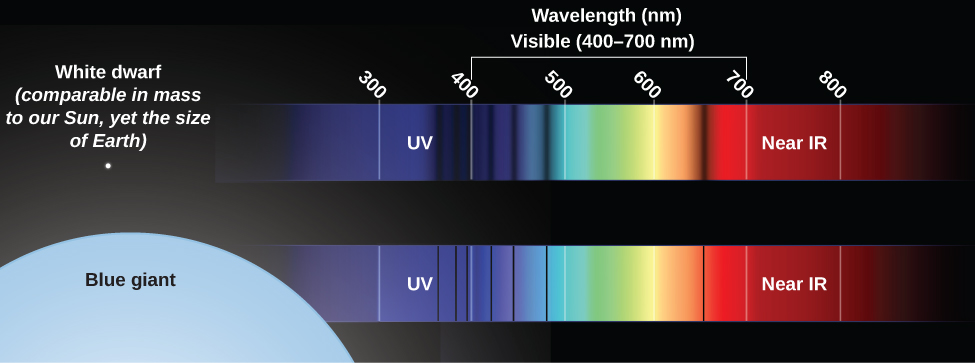
Suppose you want to determine whether a star is a giant. A giant star has a large, extended photosphere. Because it is so large, a giant star’s atoms are spread over a great volume, which means that the density of particles in the star’s photosphere is low. As a result, the pressure in a giant star’s photosphere is also low. This low pressure affects the spectrum in two ways. First, a star with a lower-pressure photosphere shows narrower spectral lines than a star of the same temperature with a higher-pressure photosphere ([link]). The difference is large enough that careful study of spectra can tell which of two stars at the same temperature has a higher pressure (and is thus more compressed) and which has a lower pressure (and thus must be extended). This effect is due to collisions between particles in the star’s photosphere—more collisions lead to broader spectral lines. Collisions will, of course, be more frequent in a higher-density environment. Think about it like traffic—collisions are much more likely during rush hour, when the density of cars is high.
Second, more atoms are ionized in a giant star than in a star like the Sun with the same temperature. The ionization of atoms in a star’s outer layers is caused mainly by photons, and the amount of energy carried by photons is determined by temperature. But how long atoms stay ionized depends in part on pressure. Compared with what happens in the Sun (with its relatively dense photosphere), ionized atoms in a giant star’s photosphere are less likely to pass close enough to electrons to interact and combine with one or more of them, thereby becoming neutral again. Ionized atoms, as we discussed earlier, have different spectra from atoms that are neutral.
Abundances of the Elements
Absorption lines of a majority of the known chemical elements have now been identified in the spectra of the Sun and stars. If we see lines of iron in a star’s spectrum, for example, then we know immediately that the star must contain iron.
Note that the absence of an element’s spectral lines does not necessarily mean that the element itself is absent. As we saw, the temperature and pressure in a star’s atmosphere will determine what types of atoms are able to produce absorption lines. Only if the physical conditions in a star’s photosphere are such that lines of an element should (according to calculations) be there can we conclude that the absence of observable spectral lines implies low abundance of the element.
Suppose two stars have identical temperatures and pressures, but the lines of, say, sodium are stronger in one than in the other. Stronger lines mean that there are more atoms in the stellar photosphere absorbing light. Therefore, we know immediately that the star with stronger sodium lines contains more sodium. Complex calculations are required to determine exactly how much more, but those calculations can be done for any element observed in any star with any temperature and pressure.
Of course, astronomy textbooks such as ours always make these things sound a bit easier than they really are. If you look at the stellar spectra such as those in [link], you may get some feeling for how hard it is to decode all of the information contained in the thousands of absorption lines. First of all, it has taken many years of careful laboratory work on Earth to determine the precise wavelengths at which hot gases of each element have their spectral lines. Long books and computer databases have been compiled to show the lines of each element that can be seen at each temperature. Second, stellar spectra usually have many lines from a number of elements, and we must be careful to sort them out correctly. Sometimes nature is unhelpful, and lines of different elements have identical wavelengths, thereby adding to the confusion. And third, as we saw in the chapter on Radiation and Spectra, the motion of the star can change the observed wavelength of each of the lines. So, the observed wavelengths may not match laboratory measurements exactly. In practice, analyzing stellar spectra is a demanding, sometimes frustrating task that requires both training and skill.
Studies of stellar spectra have shown that hydrogen makes up about three-quarters of the mass of most stars. Helium is the second-most abundant element, making up almost a quarter of a star’s mass. Together, hydrogen and helium make up from 96 to 99% of the mass; in some stars, they amount to more than 99.9%. Among the 4% or less of “heavy elements,” oxygen, carbon, neon, iron, nitrogen, silicon, magnesium, and sulfur are among the most abundant. Generally, but not invariably, the elements of lower atomic weight are more abundant than those of higher atomic weight.
Take a careful look at the list of elements in the preceding paragraph. Two of the most abundant are hydrogen and oxygen (which make up water); add carbon and nitrogen and you are starting to write the prescription for the chemistry of an astronomy student. We are made of elements that are common in the universe—just mixed together in a far more sophisticated form (and a much cooler environment) than in a star.
As we mentioned in The Spectra of Stars (and Brown Dwarfs) section, astronomers use the term “metals” to refer to all elements heavier than hydrogen and helium. The fraction of a star’s mass that is composed of these elements is referred to as the star’s metallicity. The metallicity of the Sun, for example, is 0.02, since 2% of the Sun’s mass is made of elements heavier than helium.
Appendix K lists how common each element is in the universe (compared to hydrogen); these estimates are based primarily on investigation of the Sun, which is a typical star. Some very rare elements, however, have not been detected in the Sun. Estimates of the amounts of these elements in the universe are based on laboratory measurements of their abundance in primitive meteorites, which are considered representative of unaltered material condensed from the solar nebula (see the Cosmic Samples and the Origin of the Solar System chapter).
Radial Velocity
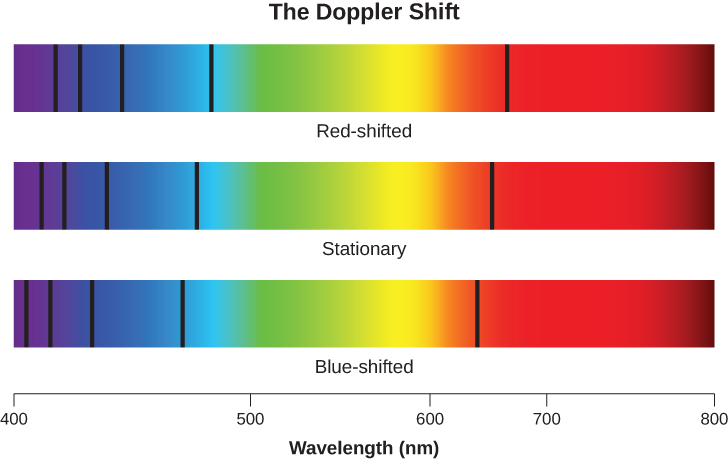
When we measure the spectrum of a star, we determine the wavelength of each of its lines. If the star is not moving with respect to the Sun, then the wavelength corresponding to each element will be the same as those we measure in a laboratory here on Earth. But if stars are moving toward or away from us, we must consider the Doppler effect (see The Doppler Effect section). We should see all the spectral lines of moving stars shifted toward the red end of the spectrum if the star is moving away from us, or toward the blue (violet) end if it is moving toward us ([link]). The greater the shift, the faster the star is moving. Such motion, along the line of sight between the star and the observer, is called radial velocity and is usually measured in kilometers per second.
William Huggins, pioneering yet again, in 1868 made the first radial velocity determination of a star. He observed the Doppler shift in one of the hydrogen lines in the spectrum of Sirius and found that this star is moving toward the solar system. Today, radial velocity can be measured for any star bright enough for its spectrum to be observed. As we will see in The Stars: A Celestial Census, radial velocity measurements of double stars are crucial in deriving stellar masses.
Proper Motion
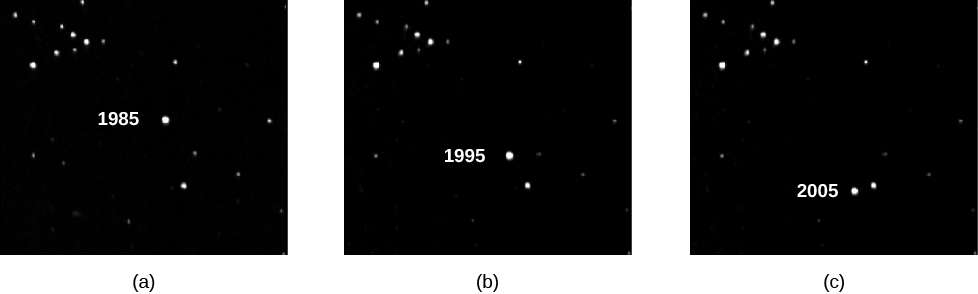
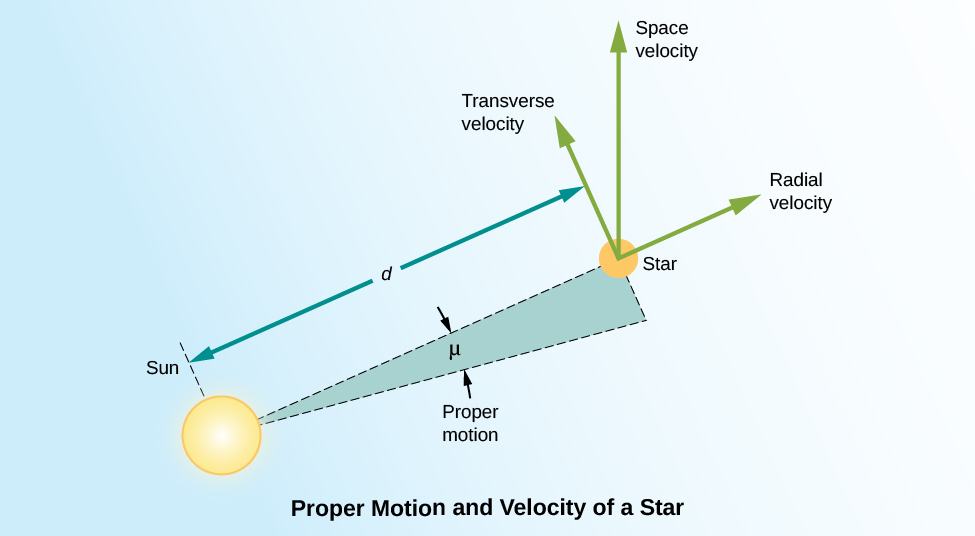
There is another type of motion stars can have that cannot be detected with stellar spectra. Unlike radial motion, which is along our line of sight (i.e., toward or away from Earth), this motion, called proper motion, is transverse: that is, across our line of sight. We see it as a change in the relative positions of the stars on the celestial sphere ([link]). These changes are very slow. Even the star with the largest proper motion takes 200 years to change its position in the sky by an amount equal to the width of the full Moon, and the motions of other stars are smaller yet.
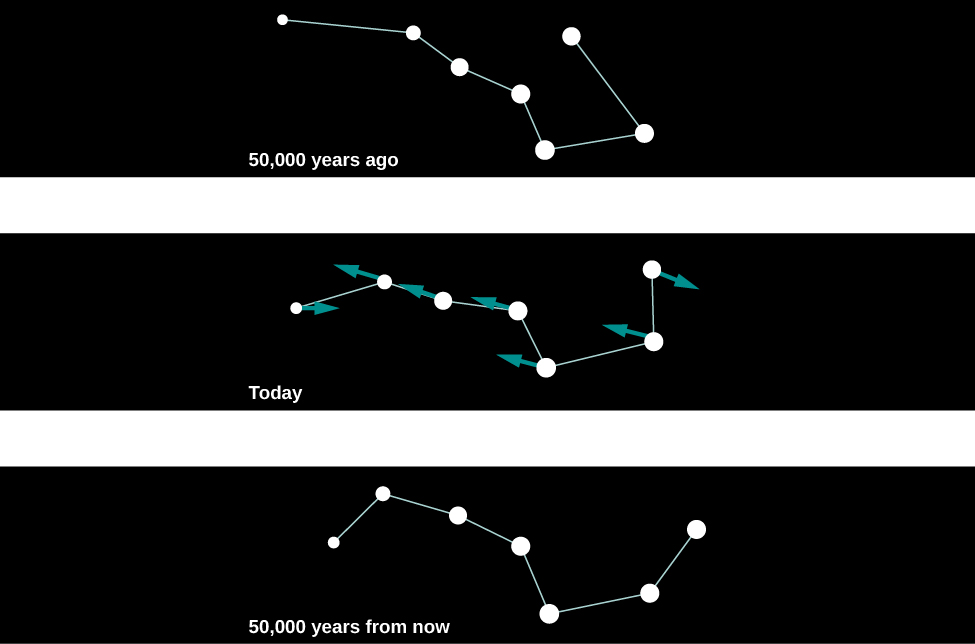
For this reason, with our naked eyes, we do not notice any change in the positions of the bright stars during the course of a human lifetime. If we could live long enough, however, the changes would become obvious. For example, some 50,000 years from now, terrestrial observers will find the handle of the Big Dipper unmistakably more bent than it is now ([link]).
We measure the proper motion of a star in arcseconds (1/3600 of a degree) per year. That is, the measurement of proper motion tells us only by how much of an angle a star has changed its position on the celestial sphere. If two stars at different distances are moving at the same velocity perpendicular to our line of sight, the closer one will show a larger shift in its position on the celestial sphere in a year’s time. As an analogy, imagine you are standing at the side of a freeway. Cars will appear to whiz past you. If you then watch the traffic from a vantage point half a mile away, the cars will move much more slowly across your field of vision. In order to convert this angular motion to a velocity, we need to know how far away the star is.
To know the true space velocity of a star—that is, its total speed and the direction in which it is moving through space relative to the Sun—we must know its radial velocity, proper motion, and distance ([link]). A star’s space velocity can also, over time, cause its distance from the Sun to change significantly. Over several hundred thousand years, these changes can be large enough to affect the apparent brightnesses of nearby stars. Today, Sirius, in the constellation Canis Major (the Big Dog) is the brightest star in the sky, but 100,000 years ago, the star Canopus in the constellation Carina (the Keel) was the brightest one. A little over 200,000 years from now, Sirius will have moved away and faded somewhat, and Vega, the bright blue star in Lyra, will take over its place of honor as the brightest star in Earth’s skies.
Rotation
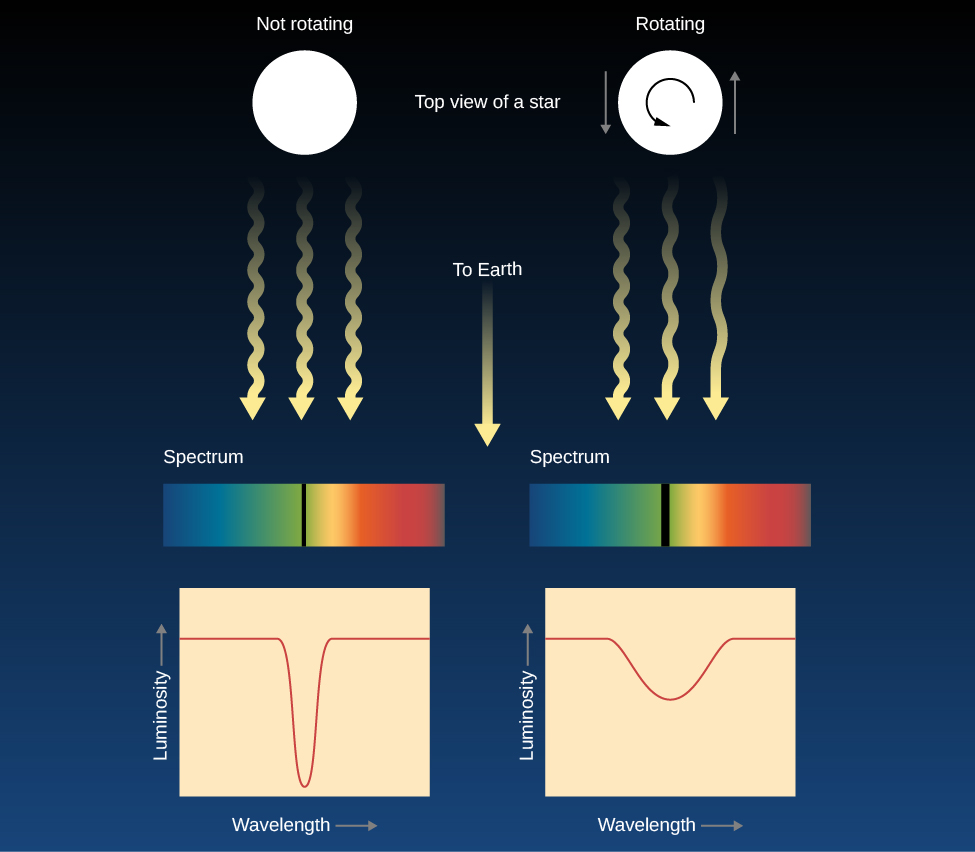
We can also use the Doppler effect to measure how fast a star rotates. If an object is rotating, then one of its sides is approaching us while the other is receding (unless its axis of rotation happens to be pointed exactly toward us). This is clearly the case for the Sun or a planet; we can observe the light from either the approaching or receding edge of these nearby objects and directly measure the Doppler shifts that arise from the rotation.
Stars, however, are so far away that they all appear as unresolved points. The best we can do is to analyze the light from the entire star at once. Due to the Doppler effect, the lines in the light that come from the side of the star rotating toward us are shifted to shorter wavelengths and the lines in the light from the opposite edge of the star are shifted to longer wavelengths. You can think of each spectral line that we observe as the sum or composite of spectral lines originating from different speeds with respect to us. Each point on the star has its own Doppler shift, so the absorption line we see from the whole star is actually much wider than it would be if the star were not rotating. If a star is rotating rapidly, there will be a greater spread of Doppler shifts and all its spectral lines should be quite broad. In fact, astronomers call this effect line broadening, and the amount of broadening can tell us the speed at which the star rotates ([link]).
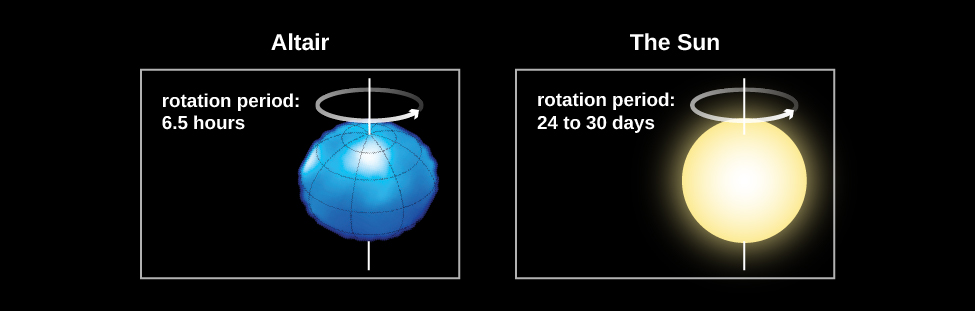
Measurements of the widths of spectral lines show that many stars rotate faster than the Sun, some with periods of less than a day! These rapid rotators spin so fast that their shapes are “flattened” into what we call oblate spheroids. An example of this is the star Vega, which rotates once every 12.5 hours. Vega’s rotation flattens its shape so much that its diameter at the equator is 23% wider than its diameter at the poles ([link]). The Sun, with its rotation period of about a month, rotates rather slowly. Studies have shown that stars decrease their rotational speed as they age. Young stars rotate very quickly, with rotational periods of days or less. Very old stars can have rotation periods of several months.
As you can see, spectroscopy is an extremely powerful technique that helps us learn all kinds of information about stars that we simply could not gather any other way. We will see in later chapters that these same techniques can also teach us about galaxies, which are the most distant objects that can we observe. Without spectroscopy, we would know next to nothing about the universe beyond the solar system.
Throughout the history of astronomy, contributions from wealthy patrons of the science have made an enormous difference in building new instruments and carrying out long-term research projects. Edward Pickering’s stellar classification project, which was to stretch over several decades, was made possible by major donations from Anna Draper. She was the widow of Henry Draper, a physician who was one of the most accomplished amateur astronomers of the nineteenth century and the first person to successfully photograph the spectrum of a star. Anna Draper gave several hundred thousand dollars to Harvard Observatory. As a result, the great spectroscopic survey is still known as the Henry Draper Memorial, and many stars are still referred to by their “HD” numbers in that catalog (such as HD 209458).
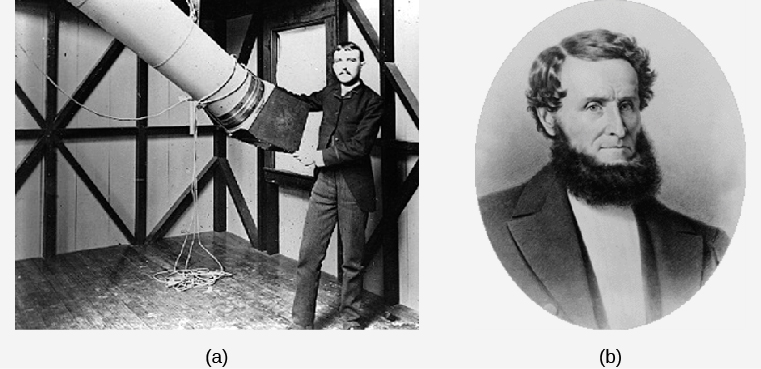
In the 1870s, the eccentric piano builder and real estate magnate James Lick ([link]) decided to leave some of his fortune to build the world’s largest telescope. When, in 1887, the pier to house the telescope was finished, Lick’s body was entombed in it. Atop the foundation rose a 36-inch refractor, which for many years was the main instrument at the Lick Observatory near San Jose.
The Lick telescope remained the largest in the world until 1897, when George Ellery Hale persuaded railroad millionaire Charles Yerkes to finance the construction of a 40-inch telescope near Chicago. More recently, Howard Keck, whose family made its fortune in the oil industry, gave ?70 million from his family foundation to the California Institute of Technology to help build the world’s largest telescope atop the 14,000-foot peak of Mauna Kea in Hawaii (see the chapter on Astronomical Instruments to learn more about these telescopes). The Keck Foundation was so pleased with what is now called the Keck telescope that they gave ?74 million more to build Keck II, another 10-meter reflector on the same volcanic peak.
Now, if any of you become millionaires or billionaires, and astronomy has sparked your interest, do keep an astronomical instrument or project in mind as you plan your estate. But frankly, private philanthropy could not possibly support the full enterprise of scientific research in astronomy. Much of our exploration of the universe is financed by federal agencies such as the National Science Foundation and NASA in the United States, and by similar government agencies in the other countries. In this way, all of us, through a very small share of our tax dollars, are philanthropists for astronomy.
Key Concepts and Summary
Spectra of stars of the same temperature but different atmospheric pressures have subtle differences, so spectra can be used to determine whether a star has a large radius and low atmospheric pressure (a giant star) or a small radius and high atmospheric pressure. Stellar spectra can also be used to determine the chemical composition of stars; hydrogen and helium make up most of the mass of all stars. Measurements of line shifts produced by the Doppler effect indicate the radial velocity of a star. Broadening of spectral lines by the Doppler effect is a measure of rotational velocity. A star can also show proper motion, due to the component of a star’s space velocity across the line of sight.
For Further Exploration
Articles
Berman, B. “Magnitude Cum Laude.” Astronomy (December 1998): 92. How we measure the apparent brightnesses of stars is discussed.
Dvorak, J. “The Women Who Created Modern Astronomy [including Annie Cannon].” Sky & Telescope (August 2013): 28.
Hearnshaw, J. “Origins of the Stellar Magnitude Scale.” Sky & Telescope (November 1992): 494. A good history of how we have come to have this cumbersome system is discussed.
Hirshfeld, A. “The Absolute Magnitude of Stars.” Sky & Telescope (September 1994): 35.
Kaler, J. “Stars in the Cellar: Classes Lost and Found.” Sky & Telescope (September 2000): 39. An introduction is provided for spectral types and the new classes L and T.
Kaler, J. “Origins of the Spectral Sequence.” Sky & Telescope (February 1986): 129.
Skrutskie, M. “2MASS: Unveiling the Infrared Universe.” Sky & Telescope (July 2001): 34. This article focuses on an all-sky survey at 2 microns.
Sneden, C. “Reading the Colors of the Stars.” Astronomy (April 1989): 36. This article includes a discussion of what we learn from spectroscopy.
Steffey, P. “The Truth about Star Colors.” Sky & Telescope (September 1992): 266. The color index and how the eye and film “see” colors are discussed.
Tomkins, J. “Once and Future Celestial Kings.” Sky & Telescope (April 1989): 59. Calculating the motion of stars and determining which stars were, are, and will be brightest in the sky are discussed.
Websites
Discovery of Brown Dwarfs: http://w.astro.berkeley.edu/~basri/bdwarfs/SciAm-book.pdf.
Listing of Nearby Brown Dwarfs: http://www.solstation.com/stars/pc10bd.htm.
Spectral Types of Stars: http://www.skyandtelescope.com/astronomy-equipment/the-spectral-types-of-stars/.
Stellar Velocities https://www.e-education.psu.edu/astro801/content/l4_p7.html.
Unheard Voices! The Contributions of Women to Astronomy: A Resource Guide: http://multiverse.ssl.berkeley.edu/women and http://www.astrosociety.org/education/astronomy-resource-guides/women-in-astronomy-an-introductory-resource-guide/.
Videos
When You Are Just Too Small to be a Star: https://www.youtube.com/watch?v=zXCDsb4n4KU. 2013 Public Talk on Brown Dwarfs and Planets by Dr. Gibor Basri of the University of California–Berkeley (1:32:52).
Collaborative Group Activities
- The Voyagers in Astronomy feature on Annie Cannon: Classifier of the Stars discusses some of the difficulties women who wanted to do astronomy faced in the first half of the twentieth century. What does your group think about the situation for women today? Do men and women have an equal chance to become scientists? Discuss with your group whether, in your experience, boys and girls were equally encouraged to do science and math where you went to school.
- In the section on magnitudes in The Brightness of Stars, we discussed how this old system of classifying how bright different stars appear to the eye first developed. Your authors complained about the fact that this old system still has to be taught to every generation of new students. Can your group think of any other traditional systems of doing things in science and measurement where tradition rules even though common sense says a better system could certainly be found. Explain. (Hint: Try Daylight Savings Time, or metric versus English units.)
- Suppose you could observe a star that has only one spectral line. Could you tell what element that spectral line comes from? Make a list of reasons with your group about why you answered yes or no.
- A wealthy alumnus of your college decides to give ?50 million to the astronomy department to build a world-class observatory for learning more about the characteristics of stars. Have your group discuss what kind of equipment they would put in the observatory. Where should this observatory be located? Justify your answers. (You may want to refer back to the Astronomical Instruments chapter and to revisit this question as you learn more about the stars and equipment for observing them in future chapters.)
- For some astronomers, introducing a new spectral type for the stars (like the types L, T, and Y discussed in the text) is similar to introducing a new area code for telephone calls. No one likes to disrupt the old system, but sometimes it is simply necessary. Have your group make a list of steps an astronomer would have to go through to persuade colleagues that a new spectral class is needed.
Review Questions
1: What two factors determine how bright a star appears to be in the sky?
2: Explain why color is a measure of a star’s temperature.
3: What is the main reason that the spectra of all stars are not identical? Explain.
4: What elements are stars mostly made of? How do we know this?
5: What did Annie Cannon contribute to the understanding of stellar spectra?
6: Name five characteristics of a star that can be determined by measuring its spectrum. Explain how you would use a spectrum to determine these characteristics.
7: How do objects of spectral types L, T, and Y differ from those of the other spectral types?
8: Do stars that look brighter in the sky have larger or smaller magnitudes than fainter stars?
9: The star Antares has an apparent magnitude of 1.0, whereas the star Procyon has an apparent magnitude of 0.4. Which star appears brighter in the sky?
10: Based on their colors, which of the following stars is hottest? Which is coolest? Archenar (blue), Betelgeuse (red), Capella (yellow).
11: Order the seven basic spectral types from hottest to coldest.
12: What is the defining difference between a brown dwarf and a true star?
Thought Questions
13: If the star Sirius emits 23 times more energy than the Sun, why does the Sun appear brighter in the sky?
14: How would two stars of equal luminosity—one blue and the other red—appear in an image taken through a filter that passes mainly blue light? How would their appearance change in an image taken through a filter that transmits mainly red light?
15: [link] lists the temperature ranges that correspond to the different spectral types. What part of the star do these temperatures refer to? Why?
16: Suppose you are given the task of measuring the colors of the brightest stars, listed in Appendix J, through three filters: the first transmits blue light, the second transmits yellow light, and the third transmits red light. If you observe the star Vega, it will appear equally bright through each of the three filters. Which stars will appear brighter through the blue filter than through the red filter? Which stars will appear brighter through the red filter? Which star is likely to have colors most nearly like those of Vega?
17: Star X has lines of ionized helium in its spectrum, and star Y has bands of titanium oxide. Which is hotter? Why? The spectrum of star Z shows lines of ionized helium and also molecular bands of titanium oxide. What is strange about this spectrum? Can you suggest an explanation?
18: The spectrum of the Sun has hundreds of strong lines of nonionized iron but only a few, very weak lines of helium. A star of spectral type B has very strong lines of helium but very weak iron lines. Do these differences mean that the Sun contains more iron and less helium than the B star? Explain.
19: What are the approximate spectral classes of stars with the following characteristics?
- Balmer lines of hydrogen are very strong; some lines of ionized metals are present.
- The strongest lines are those of ionized helium.
- Lines of ionized calcium are the strongest in the spectrum; hydrogen lines show only moderate strength; lines of neutral and metals are present.
- The strongest lines are those of neutral metals and bands of titanium oxide.
20: Look at the chemical elements in Appendix K. Can you identify any relationship between the abundance of an element and its atomic weight? Are there any obvious exceptions to this relationship?
21: Appendix I lists some of the nearest stars. Are most of these stars hotter or cooler than the Sun? Do any of them emit more energy than the Sun? If so, which ones?
22: Appendix J lists the stars that appear brightest in our sky. Are most of these hotter or cooler than the Sun? Can you suggest a reason for the difference between this answer and the answer to the previous question? (Hint: Look at the luminosities.) Is there any tendency for a correlation between temperature and luminosity? Are there exceptions to the correlation?
23: What star appears the brightest in the sky (other than the Sun)? The second brightest? What color is Betelgeuse? Use Appendix J to find the answers.
24: Suppose hominids one million years ago had left behind maps of the night sky. Would these maps represent accurately the sky that we see today? Why or why not?
25: Why can only a lower limit to the rate of stellar rotation be determined from line broadening rather than the actual rotation rate? (Refer to [link].)
26: Why do you think astronomers have suggested three different spectral types (L, T, and Y) for the brown dwarfs instead of M? Why was one not enough?
27: Sam, a college student, just bought a new car. Sam’s friend Adam, a graduate student in astronomy, asks Sam for a ride. In the car, Adam remarks that the colors on the temperature control are wrong. Why did he say that?
28: Would a red star have a smaller or larger magnitude in a red filter than in a blue filter?
29: Two stars have proper motions of one arcsecond per year. Star A is 20 light-years from Earth, and Star B is 10 light-years away from Earth. Which one has the faster velocity in space?
30: Suppose there are three stars in space, each moving at 100 km/s. Star A is moving across (i.e., perpendicular to) our line of sight, Star B is moving directly away from Earth, and Star C is moving away from Earth, but at a 30° angle to the line of sight. From which star will you observe the greatest Doppler shift? From which star will you observe the smallest Doppler shift?
31: What would you say to a friend who made this statement, “The visible-light spectrum of the Sun shows weak hydrogen lines and strong calcium lines. The Sun must therefore contain more calcium than hydrogen.”?
Figuring for Yourself
32: In Appendix J, how much more luminous is the most luminous of the stars than the least luminous?
33: For [link] through [link], use the equations relating magnitude and apparent brightness given in the section on the magnitude scale in The Brightness of Stars and [link].
34: Verify that if two stars have a difference of five magnitudes, this corresponds to a factor of 100 in the ratio $\left(\frac{{b}_{2}}{{b}_{1}}\right);$ that 2.5 magnitudes corresponds to a factor of 10; and that 0.75 magnitudes corresponds to a factor of 2.
35: As seen from Earth, the Sun has an apparent magnitude of about −26.7. What is the apparent magnitude of the Sun as seen from Saturn, about 10 AU away? (Remember that one AU is the distance from Earth to the Sun and that the brightness decreases as the inverse square of the distance.) Would the Sun still be the brightest star in the sky?
36: An astronomer is investigating a faint star that has recently been discovered in very sensitive surveys of the sky. The star has a magnitude of 16. How much less bright is it than Antares, a star with magnitude roughly equal to 1?
37: The center of a faint but active galaxy has magnitude 26. How much less bright does it look than the very faintest star that our eyes can see, roughly magnitude 6?
38: You have enough information from this chapter to estimate the distance to Alpha Centauri, the second nearest star, which has an apparent magnitude of 0. Since it is a G2 star, like the Sun, assume it has the same luminosity as the Sun and the difference in magnitudes is a result only of the difference in distance. Estimate how far away Alpha Centauri is. Describe the necessary steps in words and then do the calculation. (As we will learn in the Celestial Distances chapter, this method—namely, assuming that stars with identical spectral types emit the same amount of energy—is actually used to estimate distances to stars.) If you assume the distance to the Sun is in AU, your answer will come out in AU.
39: Do the previous problem again, this time using the information that the Sun is 150,000,000 km away. You will get a very large number of km as your answer. To get a better feeling for how the distances compare, try calculating the time it takes light at a speed of 299,338 km/s to travel from the Sun to Earth and from Alpha Centauri to Earth. For Alpha Centauri, figure out how long the trip will take in years as well as in seconds.
40: Star A and Star B have different apparent brightnesses but identical luminosities. If Star A is 20 light-years away from Earth and Star B is 40 light-years away from Earth, which star appears brighter and by what factor?
41: Star A and Star B have different apparent brightnesses but identical luminosities. Star A is 10 light-years away from Earth and appears 36 times brighter than Star B. How far away is Star B?
42: The star Sirius A has an apparent magnitude of −1.5. Sirius A has a dim companion, Sirius B, which is 10,000 times less bright than Sirius A. What is the apparent magnitude of Sirius B? Can Sirius B be seen with the naked eye?
43: Our Sun, a type G star, has a surface temperature of 5800 K. We know, therefore, that it is cooler than a type O star and hotter than a type M star. Given what you learned about the temperature ranges of these types of stars, how many times hotter than our Sun is the hottest type O star? How many times cooler than our Sun is the coolest type M star?
Glossary
- giant
- a star of exaggerated size with a large, extended photosphere
- proper motion
- the angular change per year in the direction of a star as seen from the Sun
- radial velocity
- motion toward or away from the observer; the component of relative velocity that lies in the line of sight
- space velocity
- the total (three-dimensional) speed and direction with which an object is moving through space relative to the Sun
