2.1 Example of a Function
Example 2.1.1
A shirt manufacturer may decide to produce a certain number of shirts of a particular size and style. The first task is to find out the amount of material needed.
Then,
[latex]\begin{align*} &\text{Amount of Material} &= m &→ \text{DEPENDENT VARIABLE }(y)\\ &\text{depends on} &&→ \text{IS A FUNCTION OF}\\ &\text{Number of Shirts} &= n &→\text{INDEPENDENT VARIABLE }(x) \end{align*}[/latex]
A function must be described in such a way that you can find the value of the dependent variable from the value of the independent variable. Three standard ways of doing this are used in this course.
They are,
- an equation, which allows you to calculate the value of the dependent variable for each value of the independent variable.
- a table, which lists the value of the dependent variable for each value of the independent variable.
- a graph, which displays the value of the dependent variable for each value of the independent variable.
Example 2.1.2
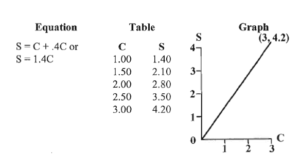
All of these approaches give the selling price, (dependent variable), as a function of the cost, (independent variable). A function like this, where one variable is a multiple of another, is called direct variation.
Note that such functions follow the algebra convention which states that when single letters are used to stand for variables, multiplication is to be used when no other operation is given, so that
[latex]1.4 C \text{ means }1.4\times C[/latex]
Key Takeaways
Also, you will follow the graphing convention which requires that the independent variable be drawn on the horizontal axis and equal the dependent variable on the vertical axis.
Each way of describing functions has its own advantages. Equations have the advantage of providing short descriptions of functions and enabling you to find precise values of the dependent variable when you need them. However, it may be difficult to do the calculation, or to understand the overall behavior of the function.
Key Takeaways
Your Own Notes
- Are there any notes you want to take from this section? Is there anything you'd like to copy and paste below?
- These notes are for you only (they will not be stored anywhere)
- Make sure to download them at the end to use as a reference
