1.1 Ratios
This chapter uses ratios to analyze basic business concepts such as profits, expenses and revenues.
Key Takeaways
A ratio expresses the relative sizes of quantities. If only two quantities are involved, they are referred to as amount and base.
[latex]Ratio = \frac{Amount}{Base}[/latex]
A frequently used ratio is the ratio of profit to sales. In this case the base is sales and the amount is profit.
Thus you have
[latex]Ratio = \frac{Amount}{Base}=\frac{Profit}{Sales}=\frac{\$8,000}{\$32,000}=0.25=25\%[/latex]
This ratio is also written as
[latex]Amount: Base = \$8,000:\$32,000 =1:4 =0.25:1[/latex]
Key Takeaways
Since both the amount and base are in dollars, this is a pure ratio or fraction, and it is common in business to express it in percent.
Percent is a ratio in which the base is 100. Thus, for the above example,
[latex]Ratio = 0.25 = \frac{25}{100}=25\%[/latex]
where the symbol % signifies that the amount 25 is to be divided by 100.
A ratio of 30% is thus:
[latex]30\% = \frac{30}{100}=0.30[/latex]
Percent is used so much in business analysis that you must become completely familiar with its meaning and be able to change back and forth between percent and decimals.
The profit-to-sales ratio expressed this way is called the percent net margin. It is used to compare the profitability of different companies or branches of companies.
Example 1.1.1
Consider a company that has three branches, A, B and C, operating in small, medium-sized and large towns. Suppose the branches have the following performances during a month:
| A | B | C | Total | |
|---|---|---|---|---|
| Sales | $12,500 | $46,500 | $63,200 | $122,200 |
| Expenses | $9,550 | $38,750 | $48,850 | $97,150 |
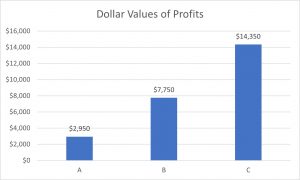
| Profit | $2,950 | $7,750 | $14,350 | $25,050 |
From these raw figures it is not easy to assess the performance of the branches. It is clear that C's profit is greater than B's, and that B's is greater than A's, but you would expect that to occur because of the size of their markets and the volume of their sales. If you take the percent net margin, however, you get the following:
For A: [latex]\frac{\$2,950}{\$12,500} = 0.236 = 23.6\%[/latex]
For all branches and the company total:
| A | B | C | TOTAL | |
| Percent Net Margin | 23.6% | 16.7% | 22.7% | 20.5% |
From those percentages, you can see that, in a sense, branch A has the best performance (for its size), and that branch B is farthest out of place. Although there may be good reasons for this, the ratios provide a reasonable place to start looking for improvements.
Examining profits on graphs illustrates the situation. First look at the graph of the dollar values of the profits (Figure 1.1).
Then look at the graph of profits as a percent of sales (Figure 1.2 below).
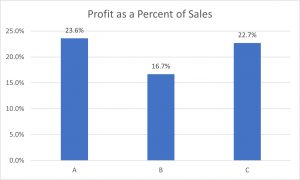
On the last graph you can see that branch B is noticeably lower.
Ratios are frequently used in business analysis. Two examples:
- Turnover ratio -This is the value (at cost) of goods sold, divided by the average value of the goods held for sale (inventory). This gives the number of times the inventory is "turned over" (completely sold and replaced).
- Acid test ratio - This is the ratio of the cash resources (e.g., cash and customer accounts owed to the company) to the short-term debts of the company. It is a measure of the ability of a firm to pay its short-term debts.
Knowledge Check 1.1
1. Central Clothing Store had sales of $80,000 last month.
- If the total expenses were $71,000, what was the profit?
- What must expenses have been if the profit had been $14,000?
2. Two consumer electronics stores, Sounders and Electronicks, are to be evaluated. Their sales for last year were as follows:
| Sounders | Electronicks | |
| Value of goods sold (at cost) | $936,400 | $1,245,900 |
On average, Sounders stock on hand cost them $184,000. Electronicks stock on hand cost them $209,400. Compare their turnover ratios. Which had the better (higher) ratio?
Your Own Notes
- Are there any notes you want to take from this section? Is there anything you'd like to copy and paste below?
- These notes are for you only (they will not be stored anywhere)
- Make sure to download them at the end to use as a reference
The difference between the revenues (sales) and expenses (cost of goods and operating costs).
A cost, either fixed or variable, Money Out
The value of goods sold divided by the average value of goods in stock
Ratio of cash resources to the company's short-term debts.
