2.6 Profit Volume Analysis
A system of equations is also used in the analysis of profits for different volumes of business. As an example, consider cost and revenue for the poster example discussed previously. Suppose the printing business decided that it should charge $0.17 per poster. Then it would have a revenue function:
[latex]R =$0.17x[/latex]
Together with the cost function, this forms a system of equations:
[latex]C =$80 +$0.11x \text{ and } R =$0.17x[/latex]
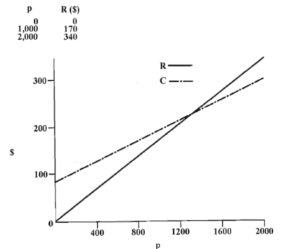
You have already seen a table for the cost function. Now prepare a short table for revenue, then graph both functions on the same axes, as follows:
To analyze this system for business purposes, you should use the relationship (from Chapter 1):
[latex]Profit = Revenue - Cost[/latex]
You can see from the graph that the printing business would lose money at those values of x (the low values) for which the cost function is above the revenue function. And it would make a profit at those values of x (the high values) where revenue exceeds the cost.
As in most systems of equations, the point at which all the equations are satisfied - the solution of the equations - is of particular interest. In the example above, it is the place at which,
[latex]Revenue = Cost[/latex]
That is, the point at which the profit is zero – the break-even point.
The break-even point can be estimated from the graph, but it can also be calculated from the equations in the system.
To find this point, set:
[latex]Revenue = Cost[/latex]
[latex]$0.17x =$80 +$0.11x[/latex]
So, by subtracting 0.11p from both sides, you get:
[latex]$0.17x -$0.11x =$80 +$0.11x -$0.11x[/latex]
And:
[latex]$0.06p=$80[/latex]
[latex]\frac{$0.06x}{$0.06x} =\frac{$80}{$0.06}[/latex]
So
[latex]x=1333.33[/latex]
But we cannot make a fraction of a poster! So we always round up.
x = 1,334 posters (rounded up)
This analysis shows the printing company that small orders lose money at $0.17 per poster. In real life such companies cannot accept orders on which they lose money; they will either set a minimum order size (say, 1,500) or charge proportionately more for small orders (for example, $100 for the first 100 posters).
Key Takeaways
- As long as the revenue and cost functions are known, you can evaluate what the profits will be at any level of activity.
- To analyze the relationship between profits and volume for an entire business or product line, do the analysis for a time period.
As long as the revenue and cost functions are known, you can evaluate what the profits will be at any level of activity. Using the revenue function above [latex]R=$ 0.17x[/latex],
[latex]Profit=$0.17x - ($80 +$0.11x)=$0.06x -$80[/latex]
so that for, say, 2,000 posters:
[latex]Profit=$0.06\times 2,000 -$80 = $40.00[/latex]
The above example was for a job in a business. To analyze the relationship between profits and volume for an entire business or product line, do the analysis for a time period, such as a month or a year. As before, the fixed costs are those that do not depend on the level of activity. They include:
- rent
- property taxes
- salaries of employees who will be employed regardless of the level of activity (for instance, managers, sales clerks)
- utilities such as heat and light
The variable costs include:
- the costs of materials
- labor costs which are the result of the level of production (called direct labor costs)
- commissions on sales
Example 2.6.1
Suppose a manufacturer of sports bags examined its accounts and found the following costs.
| Fixed Costs (Per Month) |
|
| Salaries (Office, Sales Management) | $50,000.00 |
| Depreciation of Equipment | 8,000.00 |
| Rent | 6,000.00 |
| Interest on Loans | 4,000.00 |
| Other Fixed Expenses | 2,000.00 |
| Total Fixed Cost | $70,000.00 |
| Variable Cost Per Unit Produced |
|
| Materials | $4.00 |
| Labour | 3.00 |
| Total Variable Cost | $7.00 per bag |
Thus the cost equation would be
[latex]C =$70,000 +$7x[/latex]
where
C = cost
x = number of bags produced in a month
This manufacturer sells the bags for $12 per bag. Hence the revenue equation is
[latex]R= $12x[/latex]
if we assume all bags produced are sold in the same month as they are produced.
The monthly profit would then be
[latex]Profit = R - C =$12x - ($70,000 +$7x)[/latex]
[latex]= $5x - $70,000[/latex]
To break even would require:
[latex]0 =$5x -$70,000[/latex]
[latex]$5x =$70,000[/latex]
So
x = 14,000 bags (produced and sold)
Below 14,000 bags the company would show a loss; above 14,000 bags it would show a profit. You can find the level required for any given profit by solving for x with that profit. For example, to earn a $10,000 profit:
[latex]$5x -$70,000=$10,000[/latex]
thus
[latex]x = 16,000 \text{ bags}[/latex]
Knowledge Check 2.4
Suppose, in the above example, new equipment were to be bought, increasing the depreciation cost to $12,000 and the interest on loans to $5,000, but reducing the labor cost to $2.50 per unit. Find the following:
- The resulting cost function.
- The volume (number of bags) required to break even.
- The volume required to make a profit of $10,000.
Using a BAII Plus Calculator for CVP
After graduation you have moved to Australia and discovered a need for bottle openers to take the tops off "stubbies" of pop. You start a company called Pieces of Roo that will make novelty bottle openers shaped like Kangaroo forepaws.
You estimate fixed costs of $2,500 per month and variable costs of $3.50 per bottle opener. The maximum capacity of your factory will be 1,000 units per month. You expect to sell the openers for $12.00 each.
This makes your cost equation:
[latex]C =$2,500+$3.50x[/latex]
And your revenue equation
[latex]R =$12x[/latex]
Use the pre-programmed functions of the BA II plus to answer the following questions:
- Calculate the breakeven in units.
- Enter the breakeven worksheet by keying 2nd BRKEVN
- Enter fixed costs 2500 ENTER
- Scroll down using the down arrow +
- Enter variable costs 3.50 ENTER
- Scroll down using the down arrow +
- Enter price 12.00 Enter
- Scroll down until Q appear then press CPT
- The answer is 294.11 which you would round up to 295
- Calculate the Profit at 1,000 units
- Change quantity to 1,000 units 1000 ENTER
- Scroll down using the down arrow+ until PFT is reached
- Key CPT
- The answer is $6,000
- You would like to make a profit of $5000 - how many units should you produce?
- Change PFT to 5000, 5000 ENTER
- Scroll down until Q appear then press CPT
- 882.35 which you would round up to 883 units
- At maximum capacity of 1,000 units, you would like to make a profit of $7,500. What price should you charge?
- Change Q to 1,000
- Change PFT to 7500
- CPT P
- Answer is $13.50 per unit
Your Own Notes
- Are there any notes you want to take from this section? Is there anything you'd like to copy and paste below?
- These notes are for you only (they will not be stored anywhere)
- Make sure to download them at the end to use as a reference
