Chapter 8. Electronic Structure of Atoms
8.1 Electromagnetic Energy
Learning Objectives
By the end of this module, you will be able to:
- Describe light with its frequency and wavelength.
- Describe light as a particle of energy.
Our last “picture” of the atom consisted of a nucleus containing protons and neutrons (constituting most of the atom’s mass), surrounded by a sea of electrons. The limitations of this model are that it doesn’t show how the electrons are arranged or how they move. It turns out that this electronic structure is the primary factor controlling how an atom behaves.
To get a more complete view of the atom, we need more experimental evidence and interpretation. One of the main ways to investigate electrons in atoms is to use light with two techniques; 1) by shining a light on the atoms and seeing what happens to the light (absorption spectroscopy), and 2) by heating the atoms and seeing what kind of light is given off (emission spectroscopy). Clearly, we will need to start with an understanding of the nature of light. We will then move on to describe and interpret experiments with light that give us our understanding of what electrons in atoms are doing. Finally, we see how the properties of electrons are related to the way the atoms behave.
What we know as light is more properly called electromagnetic radiation. We know from experiments that light acts as a wave. As such, it can be described as having a frequency and a wavelength.
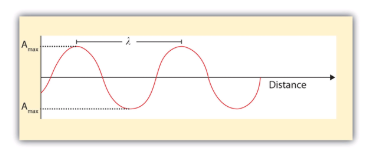
The wavelength of light is the distance between corresponding points in two adjacent light cycles. Wavelength is typically represented by λ, the lowercase Greek letter lambda, and has units of length (meters, centimeters, etc.). Figure 1 shows how wavelength is defined.
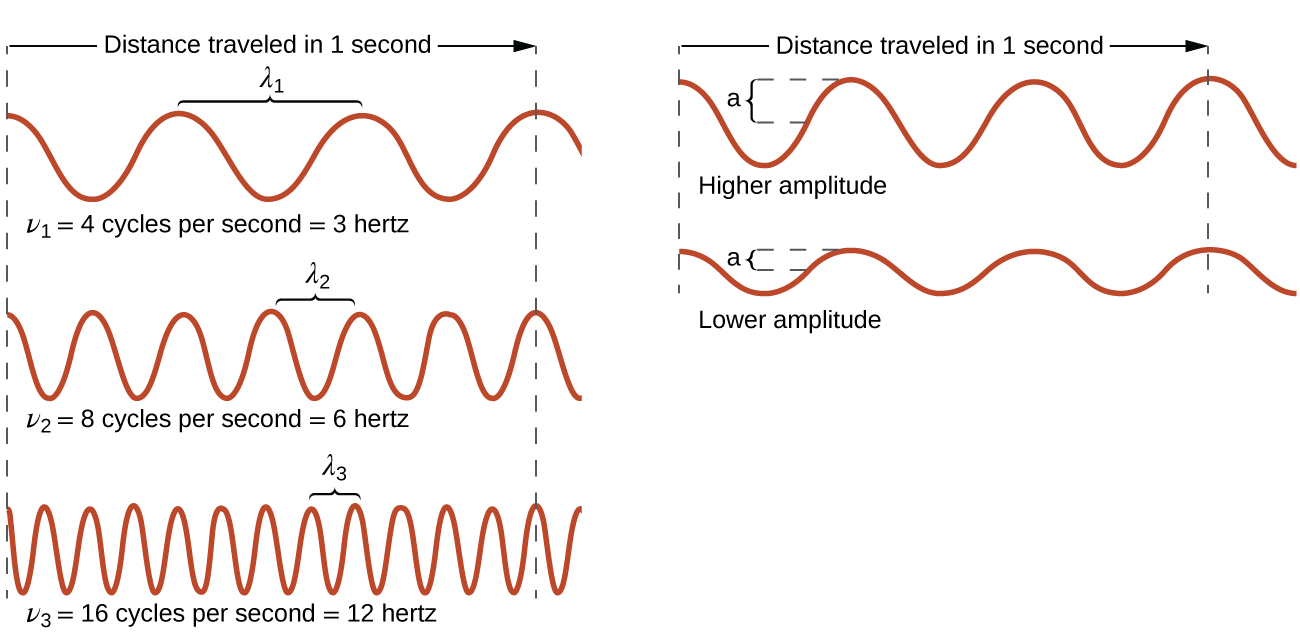
The frequency of light is the number of cycles of light that pass a given point in one second. Frequency is represented by ν, the lowercase Greek letter nu, and has units of per second, written as s−1 and sometimes called a hertz (Hz). The amplitude (a) corresponds to the magnitude of the wave's displacement and so, in Figure 2, this corresponds to one-half the height between the peaks and troughs. The amplitude is related to the intensity of the wave, which for light is the brightness, and for sound is the loudness.
Light acts as a wave and can be described by a wavelength λ and a frequency ν.
One property of waves is that their speed is equal to their wavelength times their frequency. That means we have
speed = λν
m/s = m x s-1
For light, however, speed is actually a universal constant when light is traveling through a vacuum (or, to a very good approximation, air). The measured speed of light (c) in a vacuum is 2.9979 × 10⁸ m/s, or about 3.00 × 10⁸ m/s. Thus, we have
c = λν
m/s = m x s-1
Because the speed of light is a constant, the wavelength and the frequency of light are related to each other: as one increases, the other decreases and vice versa. We can use this equation to calculate what one property of light has to be when given the other property.
Example 1
What is the frequency of light if its wavelength is 5.55 × 10⁻⁷ m?
Solution
We use the equation that relates the wavelength and frequency of light with its speed. We have
3.00×10⁸m/s = (5.55×10⁻⁷m)ν
We divide both sides of the equation by 5.55 × 10⁻⁷ m and get
ν = 5.41×10¹⁴ s-1
Note how the m units cancel, leaving s in the denominator. A unit in a denominator is indicated by a −1 power—s−1—and read as “per second.”
Test Yourself
What is the wavelength of light if its frequency is 1.55 × 10¹⁰ s−1?
Answer
0.0194 m, or 19.4 mm
Example 2
A sodium streetlight gives off yellow light that has a wavelength of 589 nm (1 nm = 1 × 10⁻⁹ m). What is the frequency of this light?
Solution
We can rearrange the equation c = λν to solve for the frequency:
Since c is expressed in meters per second, we must also convert 589 nm to meters.
Test Yourself
One of the frequencies used to transmit and receive cellular telephone signals in the United States is 850 MHz. What is the wavelength in meters of these radio waves?
Answer
0.353 m = 35.3 cm
Light also behaves like a package of energy. It turns out that for light, the energy of the “package” of energy is proportional to its frequency. (For most waves, energy is proportional to wave amplitude, or the height of the wave.) The mathematical equation that relates the energy (E) of light to its frequency is
E = hν
where ν is the frequency of the light, and h is a constant called Planck’s constant. Its value is 6.626 × 10⁻³⁴ J·s — a very small number that is another fundamental constant of our universe, like the speed of light. The units on Planck’s constant may look unusual, but these units are required so that the algebra works out.
Example 3
What is the energy of light if its frequency is 1.55 × 10¹⁰ s−1?
Solution
Using the formula for the energy of light, we have
E = (6.626 × 10⁻³⁴ J·s)(1.55 × 10¹⁰ s−1)
Seconds are in the numerator and the denominator, so they cancel, leaving us with joules, the unit of energy. So
E = 1.03 × 10⁻²³ J
This is an extremely small amount of energy—but this is for only one light wave.
Test Yourself
What is the frequency of a light wave if its energy is 4.156 × 10⁻²⁰ J?
Answer
6.27 × 10¹³ s−1
Because a light wave behaves like a little particle of energy, light waves have a particle-type name: the photon. It is not uncommon to hear light described as photons.
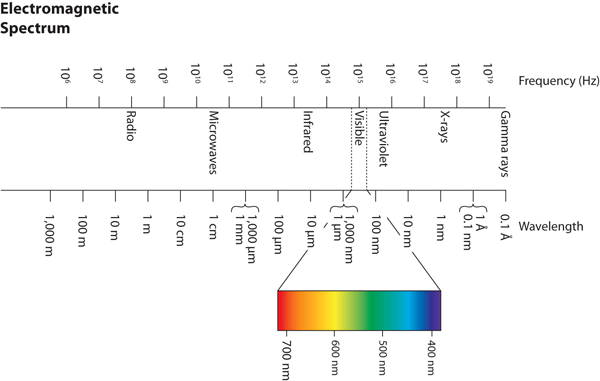
Wavelengths, frequencies, and energies of light span a wide range; the entire range of possible values for light is called the electromagnetic spectrum. We are mostly familiar with visible light, which is light having a wavelength range between about 400 nm and 700 nm. Light can have much longer and much shorter wavelengths than this, with corresponding variations in frequency and energy. Figure 3 "The Electromagnetic Spectrum" shows the entire electromagnetic spectrum and how certain regions of the spectrum are labelled. You may already be familiar with some of these regions; they are all light—with different frequencies, wavelengths, and energies.
Example 4
Using Figure 3, determine which category of EM radiation has more energetic photons, UV or IR.
Solution
Looking at Figure 3 we see that IR radiation has LONGER wavelengths. Applying the property that the energy of a photon is inversely proportional to the wavelength of the light, we can conclude that the IR light has LESS energetic photons.
Test Yourself
Which light has carries less energy in its photons, light with a frequency of 4.0 x 10¹³s-1or light with a frequency of 1.0 x 10¹⁴s-1?
Answer
The lower frequency light of 4.0 x 10¹³s-1would have the lower energy photons.
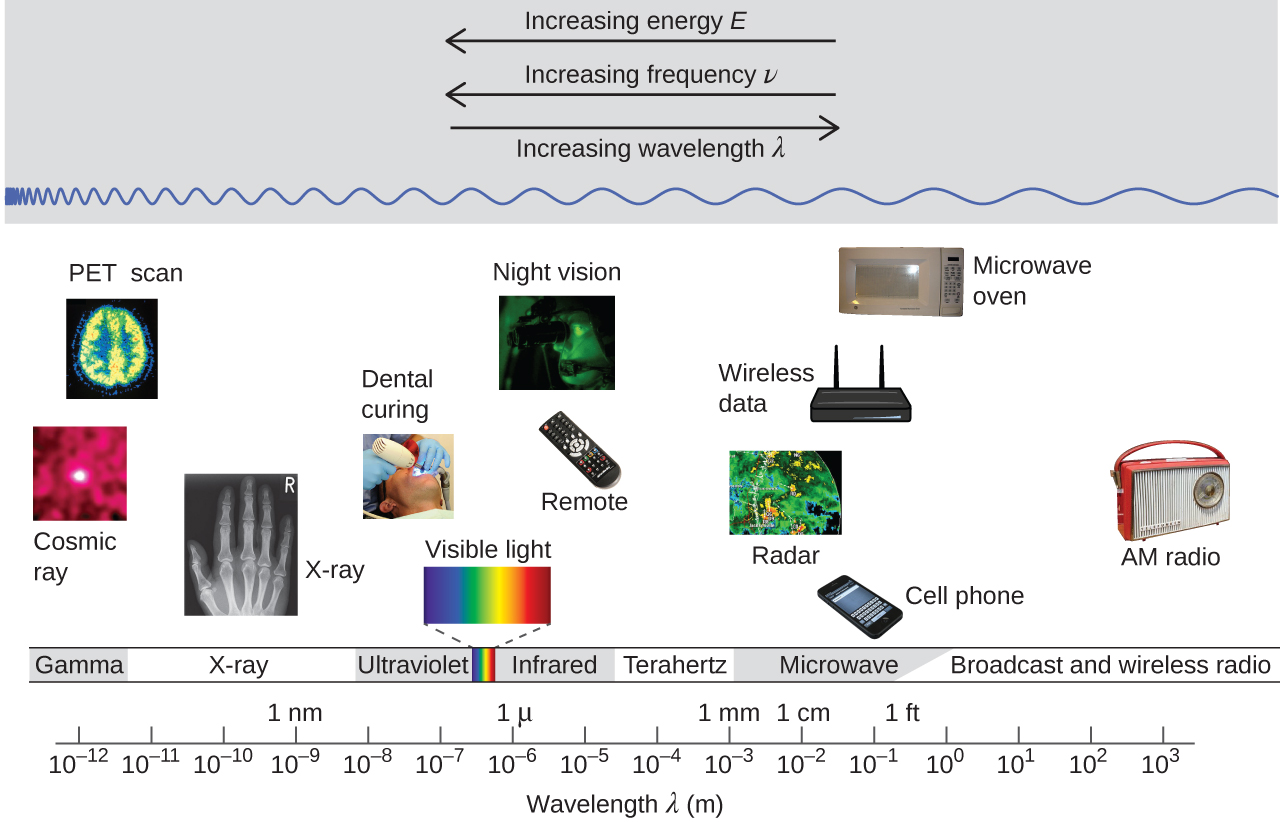
Technology and the Electromagnetic Spectrum
Figure 4 shows the electromagnetic spectrum, the range of all types of electromagnetic radiation. Each of the various colors of visible light has specific frequencies and wavelengths associated with them, and you can see that visible light makes up only a small portion of the electromagnetic spectrum.
Because the technologies developed to work in various parts of the electromagnetic spectrum are different, for reasons of convenience and historical legacies, different units are typically used for different parts of the spectrum. For example, radio waves are usually specified as frequencies (typically in units of MHz), while the visible region is usually specified in wavelengths (typically in units of nm or angstroms).
Wireless Communication
Many valuable technologies operate in the radio (3 kHz-300 GHz) frequency region of the electromagnetic spectrum (Figure 5).
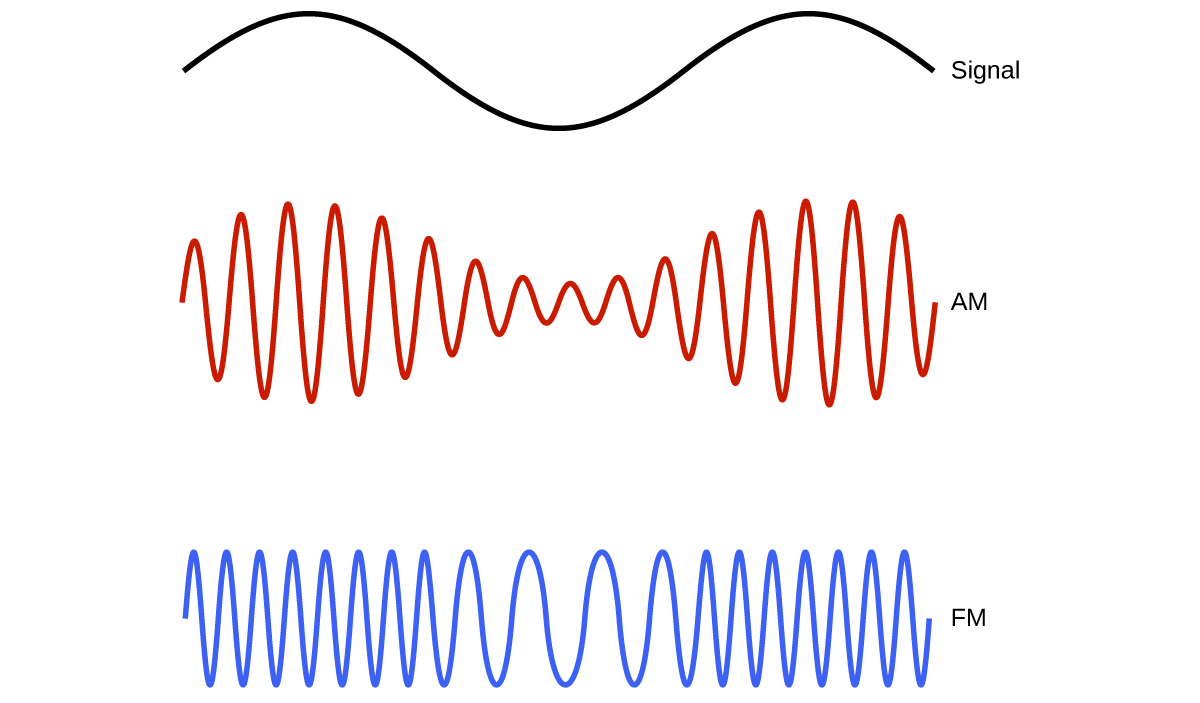
At the low frequency (low energy, long wavelength) end of this region are AM (amplitude modulation) radio signals (540-2830 kHz) that can travel long distances. FM (frequency modulation) radio signals are used at higher frequencies (87.5-108.0 MHz). In AM radio, the information is transmitted by varying the amplitude of the wave (Figure 6). In FM radio, by contrast, the amplitude is constant and the instantaneous frequency varies.
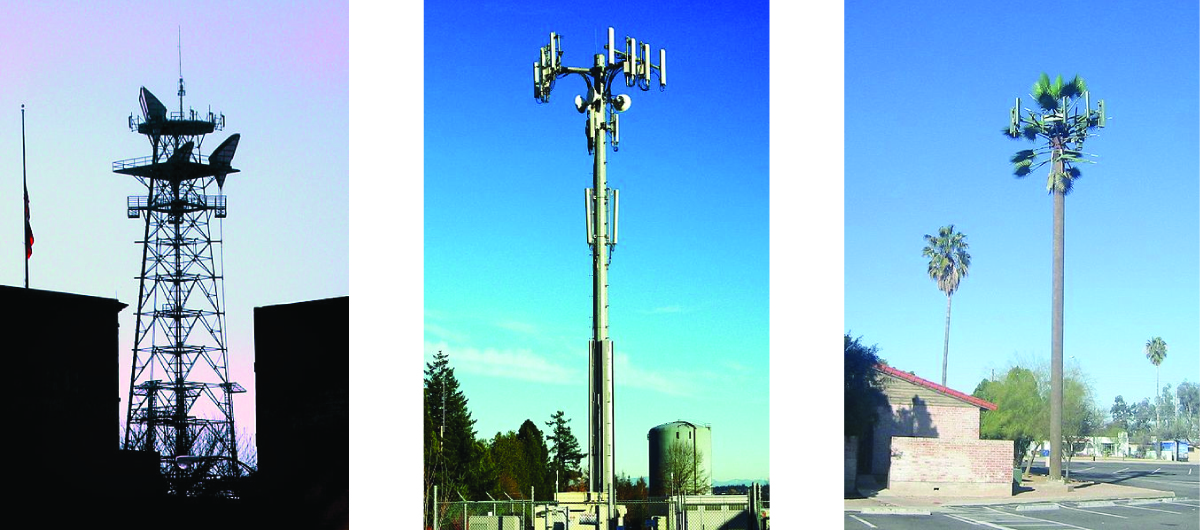
Other technologies also operate in the radio-wave portion of the electromagnetic spectrum. For example, 4G cellular telephone signals are approximately 880 MHz, while Global Positioning System (GPS) signals operate at 1.228 and 1.575 GHz, local area wireless technology (Wi-Fi) networks operate at 2.4 to 5 GHz, and highway toll sensors operate at 5.8 GHz. The frequencies associated with these applications are convenient because such waves tend not to be absorbed much by common building materials.
Key Concepts and Summary
Key Equations
- c = λν
- [latex]E = h\nu = \frac{hc}{\lambda}[/latex], where h = 6.626 × 10⁻³⁴ J·s
Exercises
1. Describe the characteristics of a light wave.
2. What is the frequency of light if its wavelength is 7.33 × 10⁻⁵ m?
3. What is the frequency of light if its wavelength is 733 nm?
4. What is the wavelength of light if its frequency is 8.19 × 10¹⁴ s−1?
5. What is the wavelength of light if its frequency is 1.009 × 10⁶ Hz?
6. What is the energy of a photon if its frequency is 5.55 × 10¹³ s−1?
7. What is the energy of a photon if its wavelength is 5.88 × 10⁻⁴ m?
8. FM-95, an FM radio station, broadcasts at a frequency of 9.51 × 10⁷ s−1 (95.1 MHz). What is the wavelength of these radio waves in meters?
9. One of the radiographic devices used in a dentist's office emits an X-ray of wavelength 2.090 × 10⁻¹¹ m. What is the energy, in joules, and frequency of this X-ray?
10. RGB color television and computer displays use cathode ray tubes that produce colors by mixing red, green, and blue light. If we look at the screen with a magnifying glass, we can see individual dots turn on and off as the colors change. Using a spectrum of visible light, determine the approximate wavelength of each of these colors. What is the frequency and energy of a photon of each of these colors?
Answers
1. Light has a wavelength and a frequency.
2. 4.09 × 10¹² s−1
3. 4.09 × 10¹⁴ s−1
4. 3.66 × 10⁻⁷ m
5. 297 m
6. 3.68 × 10⁻²⁰ J
7. 3.38 × 10⁻²² J
8. 3.15 m
9. E = 9.502 × 10⁻¹⁵ J; ν = 1.434 × 10¹⁹ s−1
10. Red: 660 nm; 4.54 × 10¹⁴ Hz; 3.01 × 10⁻¹⁹ J. Green: 520 nm; 5.77 × 10¹⁴ Hz; 3.82 × 10⁻¹⁹ J. Blue: 440 nm; 6.81 × 10¹⁴ Hz; 4.51 × 10⁻¹⁹ J. Somewhat different numbers are also possible.
Glossary
amplitude: extent of the displacement caused by a wave (for sinusoidal waves, it is one-half the difference from the peak height to the trough depth, and the intensity is proportional to the square of the amplitude)
continuous spectrum: electromagnetic radiation given off in an unbroken series of wavelengths (e.g., white light from the sun)
electromagnetic radiation: energy transmitted by waves that have an electric-field component and a magnetic-field component
electromagnetic spectrum: range of energies that electromagnetic radiation can comprise, including radio, microwaves, infrared, visible, ultraviolet, X-rays, and gamma rays; since electromagnetic radiation energy is proportional to the frequency and inversely proportional to the wavelength, the spectrum can also be specified by ranges of frequencies or wavelengths
frequency (ν): number of wave cycles (peaks or troughs) that pass a specified point in space per unit time
hertz (Hz): the unit of frequency, which is the number of cycles per second, s−1
intensity: property of wave-propagated energy related to the amplitude of the wave, such as brightness of light or loudness of sound
photon: smallest possible packet of electromagnetic radiation, a particle of light
wave: oscillation that can transport energy from one point to another in space
wavelength (λ): distance between two consecutive peaks or troughs in a wave
