12 Results of the meta-analysis
As with RCTs, outcomes ought to be interpreted beyond just statistical significance to assess the magnitude of effect and clinical relevance. Interpretation also requires considerations beyond what is necessary when appraising RCTs. It is also important to consider how many trials reported on a particular outcome, and what the quality of those specific trials were. Additionally, even if the trials are otherwise clinically and methodologically similar, statistical heterogeneity identified by visual inspection and/or formal statistical testing may preclude confidently combining trial results.
Checklist Questions
| I2 Value – What was the statistical heterogeneity? |
| Appropriate to pool the results & interpret the summary statistics? |
| Fixed-effects or random-effects? |
| Is the model used appropriate? |
| Which effect measure was used? (e.g. OR, RR, SMD) |
| What is the baseline risk for your patient from the individual trial they would fit best? |
| What was the calculated absolute effect? (e.g. ARR, NNT) |
| What proportion of the included studies report on this outcomes? |
| If performed, what GRADE rating was assigned to each outcome? |
Statistical heterogeneity: What was the statistical heterogeneity?
For information regarding the interpretation of forest plots refer to Appendix: Fundamental Statistics.
| Methods to Assess Heterogeneity | Description |
| Visual assessment | An intuitive visual evaluation of heterogeneity (see examples below) |
| Cochran’s Q | A yes/no test that shows statistical evidence of heterogeneity if p <0.10 (analogous to the test for interaction used in subgroup analyses) |
| I2 | I2 ranges from 0-100% and represents the amount of variability in the point estimate across trials. Rule-of-thumb (one of many): I2 <25% = minimal heterogeneity; I2 >50% = substantial heterogeneity (may not be appropriate to meta-analyze trials) (preferred over Cochran’s Q) |
E.g. #1 A forest plot from a review (Koshman SL et al.) evaluating the impact of pharmacist involvement in the care of patients with heart failure on all-cause hospitalization rate:
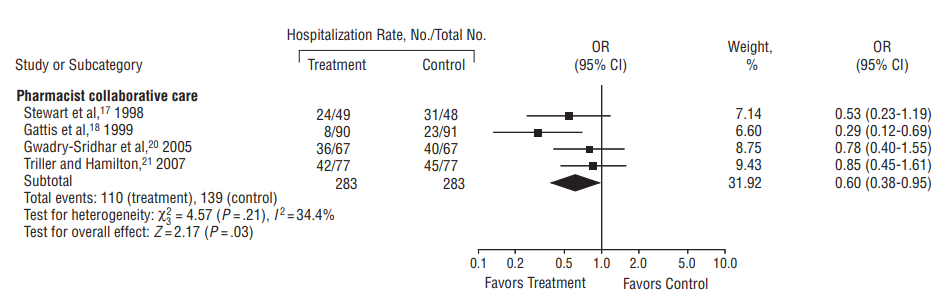
Plot 2. Pharmacist collaborative care vs. usual for patients with heart failure on the outcome of all-cause hospitalization.
Visually it can be seen that the point estimates are directionally consistent and all the CIs overlap. Consequently meta-analyzing the results for this outcome is appropriate. Notably, this is a case of appropriate meta-analysis despite there being “moderate” statistical heterogeneity as measured by I2 (34.4%), as discussed in the note below.
E.g. #2 A forest plot from a review of exercise for depression (Cooney GM et al.) evaluating the effects of exercise plus treatment vs. treatment alone:
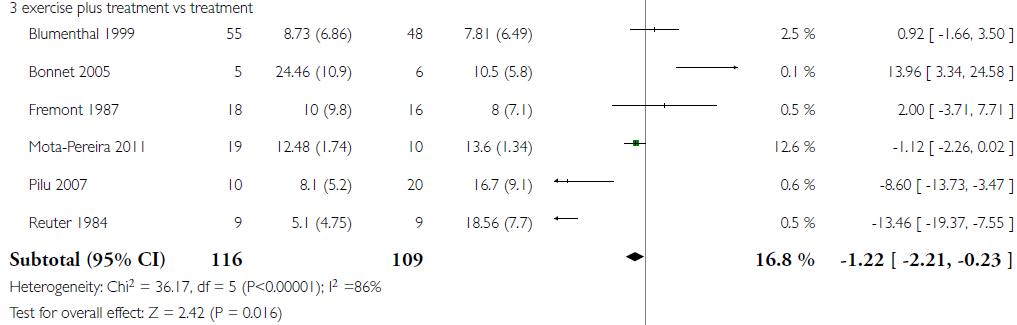
Plot 3. Exercise plus treatment vs. treatment alone for patients with depression on the outcome of reduction in depression symptoms post-treatment.
Visually it can be seen that the point estimates have unreasonable variation and the CIs have minimal overlap. Consequently heterogeneity is a concern and additional considerations are necessary, as discussed more below.
If heterogeneity is judged to be too high, this requires either:
- Different statistical approach to pool the results (i.e. random-effects model, see below)
- Evaluation of clinical & methodological sources of heterogeneity
- A decision not to meta-analyze the results for the outcome in question
Note: Trials with very different point estimates but wide CIs may falsely show little or no heterogeneity with statistical tests. The opposite is true for trials with very small CIs. Thus, heterogeneity tests should always be considered with visual evaluation of differences in individual trial point estimates and CIs.
Statistical models: Fixed-effects or random-effects? Is the model used appropriate?
Either the fixed-effects model or random-effects model may be used to pool results. In many cases, both models produce very similar meta-analytic results. However, some differences can be noted:
| Fixed-Effect Model | Random-Effects Model |
| Assumes all trials measure same “true” underlying effect | Does not assume that all trials estimate the exact same underlying effect (e.g. different populations may vary in their response to intervention) |
| Less conservative if statistical heterogeneity present (uses narrower CIs) | More conservative if statistical heterogeneity present (uses wider CIs) |
| Statistical weight of a trial is proportional to the number of participants/events (i.e. larger trials given more weight). | Compared with a fixed-effect model, a random-effects model will give relatively more weight to smaller trials when studies are heterogeneous. |
In cases where there is evidence of small-study effect, the random-effects model can “pull” the summary estimate towards the smaller trials (which are more prone to publication bias). In other words, statistical analysis cannot fix poor data.
Effect measure and precision
Refer to Randomized Controlled Trials: Interpreting the results for a discussion of how to assess point estimates and CIs for clinical importance.
Refer to Appendix: Fundamental Statistics for a discussion of different measures of effect. Depending on the studies included and the outcome types, some effect measures may be more appropriate than others (e.g. if multiple different symptom scales were used between studies, it would be most appropriate to use standardized mean difference and not raw mean difference scores)
What proportion of included studies report on this outcome?
Why is outcome reporting bias so concerning?
- In one study of 122 RCTs, 50% of efficacy outcomes and 65% of harm outcomes were incompletely reported. Additionally, 62% of the trials had their primary outcome changed in the final published reported compared to the original protocol (Chan A-W, Hróbjartsson A et al.).
- A study by the same lead author also found outcome reporting bias present in government-funded studies. Additionally, it found that neutral studies were most likely to have reporting issues (i.e. reporting results as “not statistically significantly different” without reporting absolute values) (Chan A-W, Krleza-Jerić K et al.).
- In one study of 42 meta-analyses, in 93% of cases the addition of unpublished FDA outcome data changed the efficacy summary estimate (either increased or decreased) compared to the meta-analysis based purely on published outcome data (Hart B et al.).
Bottom line: As with individual trials, neutral outcome results are less likely to be published than positive results. Since most systematic reviews rely heavily on published outcome data, outcome reporting bias poses a serious threat to the accuracy of intervention effect estimates (i.e. overestimation of benefits and underestimation of harms, distorting the true trade-off between benefits and harms).
Outcome reporting bias should be considered when data on a clinically important outcome is only available for a minority of included studies, which in turn should raise concerns regarding the certainty of evidence (see the discussion of GRADE ratings below).
If performed, what GRADE rating was assigned to each outcome?
GRADE (Grading of Recommendations, Assessment, Development and Evaluations) is a method of transparently assessing the certainty of evidence for a particular outcome as either high, moderate, low, or very low.
Certainty is determined by two factors: the type of studies examined (RCTs or observational studies), and the characteristics of those studies. RCTs start at “high certainty” and observational trials at “low certainty”. Studies are then rated up or down – either by one or two levels per characteristic. For example, for a meta-analysis of RCTs the evidence would start at high certainty, but then may be downgraded to moderate certainty due to serious risk of bias, and then rated down again to low certainty due to inconsistency.
Certainty can be rated down for any of:
| Risk of bias | Refers to internal validity limitations due to factors such as inadequate randomization, allocation concealment, blinding, or selective reporting. See the here section for more information on how to assess risk of bias. |
| Imprecision | Refers to a CI which spans clinically important differences. For instance, a RR with a 95% CI of 0.5 to 2.0 for mortality is imprecise as the CI includes both possibilities that the intervention halves or doubles deaths. In contrast, a RR with a 95% CI of 0.6 to 0.65 for schizophrenia symptom reduction is very narrow and would be considered precise. Imprecision can be assessed formally by comparing the achieved sample size to the calculated optimal information size as described by Guyatt et al. |
| Inconsistency | Refers to the presence of between-study heterogeneity. This can be assessed visually and statistically – see the Statistical Heterogeneity discussion above for more information. |
| Indirectness | Refers to results which are not directly applicable to one or more of the study PICO elements (i.e. in terms of patient characteristics, interventions, or treatment settings. For example, using studies of adults as indirect evidence of the effects of treatment in children. Indirectness can also apply to outcomes, such as when surrogate outcomes act as indirect evidence of clinically important outcomes. |
| Publication bias | Refers to a systematic tendency for results to be published based upon the direction or statistical significance of the results. Such tendency can lead to bias when aggregating evidence if the methods are more likely to include published literature than unpublished literature. |
Certainty of evidence based on observational studies can be rated up for any of:
| Large magnitude of effect | Confounding alone is unlikely to explain large associations (e.g. risk ratio <0.50 or >2.0). |
| Dose-response gradient | Refers to an increasing effect size as the dose increases. If such a gradient is apparent then this increases the likelihood of a true effect. |
| All residual confounding would decrease magnitude of effect (in situations with an effect) | Residual confounding refers to unknown or unmeasurable confounding that could not be accounted for in an observational study. It is seldom possible to completely eliminate all residual confounding in observational studies as there is always the possibility of imbalance of yet-unknown prognostic variables. If all of such residual confounders were expected to decrease the effect size, then the effect estimate is a conservative measure. If this conservative analysis demonstrates a benefit, then this warrants greater confidence in the result. |
It is important to emphasize again that these assessments are specific to each outcome. For instance, the evidence for the comparison of an intervention versus a comparator may be of high certainty for one outcome, but low certainty for another outcome. All of these judgements are made subjectively, ideally with rationales provided. The intention is not for this to be a mechanistic rating scheme, but rather to transparently communicate the thought process behind ratings.
Randomized controlled trials are those in which participants are randomly allocated to two or more groups which are given different treatments.
Refers to variability between studies in a systematic review. It can refer to clinical differences, methodological differences, or variable results between studies. Heterogeneity occurs on a continuum and, in the case of heterogeneity amongst results, can be expressed numerically via measures of statistical heterogeneity. See here for a further discussion of statistical heterogeneity.
Odds ratios are the ratio of odds (events divided by non-events) in the intervention group to the odds in the comparator group. For example, if the odds of an event in the treatment group is 0.2 and the odds in the comparator group is 0.1, then the OR is 2 (0.2/0.1). See here for a more detailed discussion.
Relative risk (or risk ratio) is the risk in one group relative to (divided by) risk in another group. For example, if 10% in the treatment group and 20% in the placebo group have the outcome of interest, the relative risk in the treatment group is 0.5 (10% ÷ 20%; half) the risk in the placebo group. See here for a more detailed discussion.
Transformation of continuous data that consists of dividing the difference in means between two groups by the standard deviation of the variable. In clinical research, this is often used to summarize and/or pool continuous outcomes that are measured in several ways. For example, a meta-analysis of antidepressants may need to use the SMD if trials used different scales (e.g. Beck Depression Inventory, Hamilton Depression Rating Scale) to report change in depression symptoms. See here for further discussion on SMD interpretation.
A single value given as an estimate of the effect. For example, results may be listed as a relative risk of 0.5 (95% CI 0.4-0.6). In this case 0.5 is the point estimate, and 0.4-0.6 is the 95% confidence interval.
A meta-analysis is a quantitative combination of the data obtained in a systematic review.
A tendency for smaller published studies to demonstrate a larger effect size than larger published studies. One possible cause is publication bias. However, other possible causes include systematic differences between smaller and larger studies (e.g. stricter enrolment criteria, adherence and/or follow-up in smaller studies, more pragmatic design in larger studies).
Refers to a systematic tendency for results to be published based upon the direction or statistical significance of the results. This results in bias when aggregating evidence if methods are more likely to include published literature than unpublished literature.
A primary outcome is an outcome from which trial design choices are based (e.g. sample size calculations). Primary outcomes are not necessarily the most important outcomes.
A review that systematically identifies all potentially relevant studies on a research question. The aggregate of studies is then evaluated with respect to factors such as risk of bias of individual studies or heterogeneity among results. The qualitative combination of results is a systematic review.
The extent to which the study results are attributable to the intervention and not to bias. If internal validity is high, there is high confidence that the results are due to the effects of treatment (with low internal validity entailing low confidence).
Refers to the process that prevents patients, clinicians, and researchers from predicting which intervention group the patient will be assigned. This is different from blinding; allocation concealment refers to patients/clinicians/outcome assessors/etc. being unaware of group allocation prior to randomization, whereas blinding refers to remaining unaware of group allocation after randomization. Allocation concealment is a necessary condition for blinding. It is always feasible to implement.
An acronym for "patient, intervention, comparator, and outcome". These are the four basic elements of a study. For instance, a study may examine an elderly population (P) to understand the effects of statin therapy (I) compared to placebo (C) in terms of cardiovascular events (O). Sometimes extended to PICO(T) to include the time at which outcomes were assessed, or (D)PICO to incorporate the study design.
These markers or outcomes act as proxies for clinical outcomes under the assumption that the proxy is sufficiently predictive of the clinical outcome. For example, LDL cholesterol lowering may be used as a surrogate marker for lowering the risk of cardiovascular events. Surrogate markers are typically used because they are more convenient to measure.
See here for discussion regarding confounders.
