3 Interpreting the results
When examining the results of a trial, it is necessary to consider more than statistical significance. Not all statistically significant results are clinically important. Similarly, failure to find a statistically significant difference does not necessarily rule out that there is a clinically important difference. In addition, when making judgements of clinical relevance, it is necessary to examine not only the relative effect of treatment, but also the absolute effect (see here for further discussion).
In terms of effectively communicating results to patients, a review (Zipkin DA et al.) found that:
– Any type of difference (absolute or relative) is understood more accurately when baseline risk is provided;
– Absolute differences are understood more accurately than relative differences;
– Numbers needed to treat (NNTs) are often misunderstood and are inferior to reporting absolute differences;
– Addition of visual displays to numerical information increase understanding.
Checklist Questions
| What was the magnitude of effect for efficacy and harms? |
| How precise were the estimates of treatment effect? |
| Is the difference clinically important? |
| Are these results consistent with other evidence? |
Point estimate: What was the magnitude of effect for efficacy and harms?
Look at both the absolute effect and the relative effect. Relative effects are typically assumed to be reasonably consistent across populations, whereas absolute effects depend on baseline risk.
| Population | Relative risk reduction | Absolute Risk Reduction Over 5 Years |
| Primary prevention patients – No coronary artery disease – A predicted <20% risk of a cardiovascular event in the next 10 years |
10-15% | 0.4% |
| Secondary prevention patients – Coronary artery disease |
10-15% | 2% |
Confidence interval: How precise were the estimates of treatment effect?
Confidence intervals (CIs) provide information regarding the uncertainty of the results. The wider the CI, the greater the uncertainty. The width is based on the difference between the two ends of the CI. Wide and narrow do not have exact definitions.
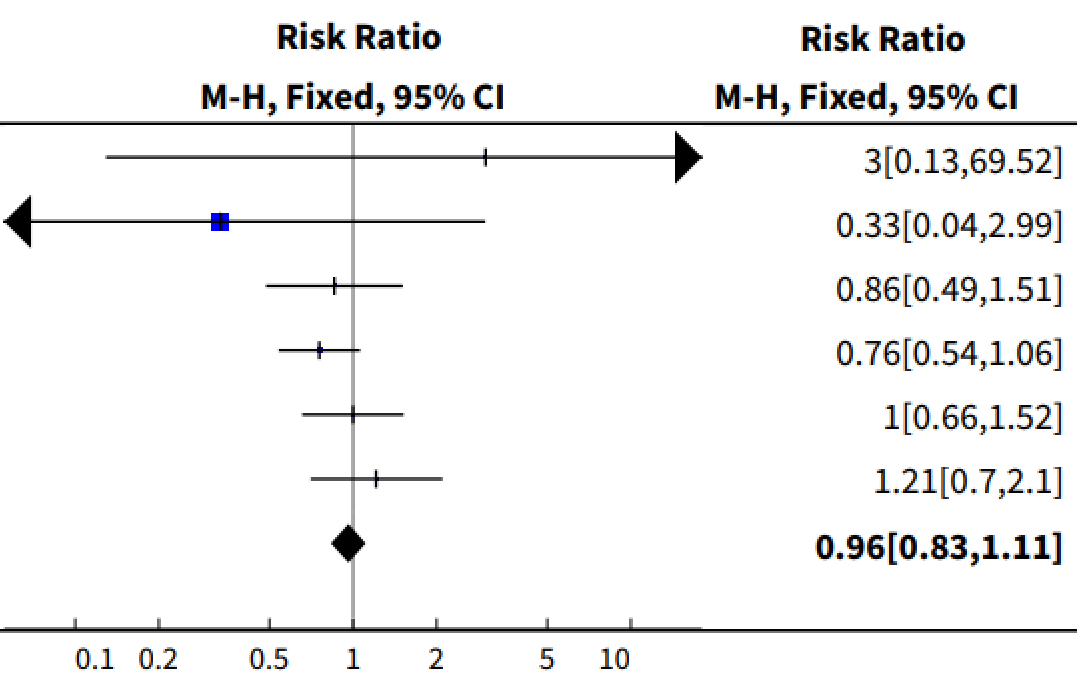
Plot 1. Forest plot of any antipsychotic plus atypical antipsychotic vs. atypical antipsychotic in patients with schizophrenia on the outcome of no clinically important response.
The relevance of this uncertainty depends on whether the CI includes clinically important differences (see the following section). This involves examining both ends of the CI, and judging whether there is a meaningful difference between the two.
Is the difference clinically important?
Clinical importance is determined by looking at the absolute risk difference, rather than a relative risk reduction. Note that clinical importance is dependent on an individual’s preferences and values, therefore opinions will differ based on clinician and patient preferences, patient situation, intervention characteristics (e.g. adverse events, cost, convenience), and other factors.
Consider comparing the results with absolute risk reductions or NNTs achieved with other interventions used in a similar patient population.
Are these results consistent with other evidence?
Calculates the effect of an intervention via a fractional comparison with the comparator group (i.e. intervention group measure ÷ comparator group measure). Used for binary outcomes. Relative risk, odds ratio, or hazards ratio are all expressions of relative effect. For example, if the risk of developing neuropathy was 1% in the treatment group and 2% in the comparator group, then the relative risk is 0.5 (1 ÷ 2). See the Absolute Risk Differences and Relative Measures of Effect discussion here for more information.
Absolute risk difference is the risk in one group compared to (minus) the risk in another group over a specified period of time. For example, if the absolute risk of myocardial infarction over 5 years was 15% for the comparator and 10% for the intervention, then the absolute risk difference was 5% (15% - 10%) over 5 years. See here for further discussion.
The difference between two relative risks (RRs). If the intervention has a RR of 70% and the comparator a risk of 100%, then the relative risk reduction is 30% (100% - 70%).
Relative risk (or risk ratio) is the risk in one group relative to (divided by) risk in another group. For example, if 10% in the treatment group and 20% in the placebo group have the outcome of interest, the relative risk in the treatment group is 0.5 (10% ÷ 20%; half) the risk in the placebo group. See here for a more detailed discussion.
Odds ratios are the ratio of odds (events divided by non-events) in the intervention group to the odds in the comparator group. For example, if the odds of an event in the treatment group is 0.2 and the odds in the comparator group is 0.1, then the OR is 2 (0.2/0.1). See here for a more detailed discussion.
A meta-analysis is a quantitative combination of the data obtained in a systematic review.
A review that systematically identifies all potentially relevant studies on a research question. The aggregate of studies is then evaluated with respect to factors such as risk of bias of individual studies or heterogeneity among results. The qualitative combination of results is a systematic review.
Randomized controlled trials are those in which participants are randomly allocated to two or more groups which are given different treatments.
Hazard ratios are a relative measure of effect. Hazards refer to average instantaneous incidence rate at every point during the trial. This differentiates it from other measures, such as relative risk, which rely only on cumulative event rates. See here for a more detailed discussion.
A primary outcome is an outcome from which trial design choices are based (e.g. sample size calculations). Primary outcomes are not necessarily the most important outcomes.
