Chapter 17 Analyzing Starlight
17.2 Colours of Stars
Learning Objectives
By the end of this section, you will be able to:
- Compare the relative temperatures of stars based on their colours
- Explain how astronomers use colour indexes to measure the temperatures of stars
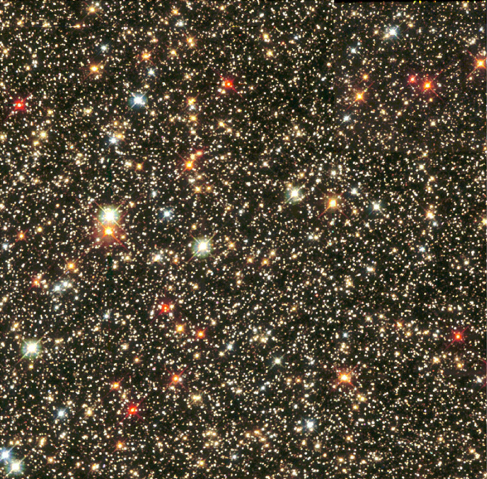
Look at the beautiful picture of the stars in the Sagittarius Star Cloud shown in Figure 1. The stars show a multitude of colours, including red, orange, yellow, white, and blue. As we have seen, stars are not all the same colour because they do not all have identical temperatures. To define colour precisely, astronomers have devised quantitative methods for characterizing the colour of a star and then using those colours to determine stellar temperatures. In the chapters that follow, we will provide the temperature of the stars we are describing, and this section tells you how those temperatures are determined from the colours of light the stars give off.
Colour and Temperature
As we learned in The Electromagnetic Spectrum section, Wien’s law relates stellar colour to stellar temperature. Blue colours dominate the visible light output of very hot stars (with much additional radiation in the ultraviolet). On the other hand, cool stars emit most of their visible light energy at red wavelengths (with more radiation coming off in the infrared) Figure 2 shows star colours and their corresponding temperature. The colour of a star therefore provides a measure of its intrinsic or true surface temperature (apart from the effects of reddening by interstellar dust).
“Cosmic Latte” or the Average Colour of Stars

Colour does not depend on the distance to the object. This should be familiar to you from everyday experience. The colour of a traffic signal, for example, appears the same no matter how far away it is. If we could somehow take a star, observe it, and then move it much farther away, its apparent brightness (magnitude) would change. But this change in brightness is the same for all wavelengths, and so its colour would remain the same.
| Figure 2. Example Star Colours and Corresponding Approximate Temperatures | ||
|---|---|---|
| Star Colour | Approximate Temperature | Example |
| Blue | 25,000 K | Spica |
| White | 10,000 K | Vega |
| Yellow | 6000 K | Sun |
| Orange | 4000 K | Aldebaran |
| Red | 3000 K | Betelgeuse |
Temperate of Stars
The hottest stars have temperatures of over 40,000 K, and the coolest stars have temperatures of about 2000 K. Our Sun’s surface temperature is about 6000 K; its peak wavelength colour is a slightly greenish-yellow. In space, the Sun would look white, shining with about equal amounts of reddish and bluish wavelengths of light. It looks somewhat yellow as seen from Earth’s surface because our planet’s nitrogen molecules scatter some of the shorter (i.e., blue) wavelengths out of the beams of sunlight that reach us, leaving more long wavelength light behind. This also explains why the sky is blue: the blue sky is sunlight scattered by Earth’s atmosphere.
Canadians in Space Julie Payette was born in Montreal, Quebec. She obtained her Bachelor of Electrical Engineering cum laude from McGill University and a Master’s of Computer Engineering from the University of Toronto. After conducting research in computer systems, natural language processing and automatic speech recognition, Julie was selected as one of four new Canadian astronauts in 1992.

In 1999, Ms. Payette flew as Mission Specialist during mission STS-96. She became the first Canadian to both participate in an International Space Station assembly mission and to board the Space Station itself. Her second spaceflight was during mission STS-127 in 2009, another assembly mission that lasted 16 days. Robotics technology was used nearly every day and Julie operated three different robotic arms; the Shuttle’s Canadarm, the Station’s Canadarm2, and a special-purpose appendage on the Kibo Japanese Experiment Module.
Following her space adventures, Julie served stints as chief astronaut for the Canadian Space Agency, chief operating office for the Montreal Science Centre, a director of the National Bank of Canada. In 2017, she was appointed as the 29th Governor General of Canada.
Colour Indices
In order to specify the exact colour of a star, astronomers normally measure a star’s apparent brightness through filters, each of which transmits only the light from a particular narrow band of wavelengths (colours). A crude example of a filter in everyday life is a green-coloured, plastic, soft drink bottle, which, when held in front of your eyes, lets only the green colours of light through.
One commonly used set of filters in astronomy measures stellar brightness at three wavelengths corresponding to ultraviolet, blue, and yellow light. The filters are named: U (ultraviolet), B (blue), and V (visual, for yellow). These filters transmit light near the wavelengths of 360 nanometers (nm), 420 nm, and 540 nm, respectively. The brightness measured through each filter is usually expressed in magnitudes. The difference between any two of these magnitudes—say, between the blue and the visual magnitudes (B–V)—is called a colour index.
For a demonstration of how different light sources and filters can combine to determine the observed spectrum. You can also see how the perceived colours are associated with the spectrum.
By agreement among astronomers, the ultraviolet, blue, and visual magnitudes of the UBV system are adjusted to give a colour index of 0 to a star with a surface temperature of about 10,000 K, such as Vega. The B–V colour indexes of stars range from −0.4 for the bluest stars, with temperatures of about 40,000 K, to +2.0 for the reddest stars, with temperatures of about 2000 K. The B–V index for the Sun is about +0.65. Note that, by convention, the B–V index is always the “bluer” minus the “redder” colour.
Why use a colour index if it ultimately implies temperature? Because the brightness of a star through a filter is what astronomers actually measure, and we are always more comfortable when our statements have to do with measurable quantities.
Key Concepts and Summary
Stars have different colours, which are indicators of temperature. The hottest stars tend to appear blue or blue-white, whereas the coolest stars are red. A colour index of a star is the difference in the magnitudes measured at any two wavelengths and is one way that astronomers measure and express the temperature of stars.
Glossary
- colour index
- difference between the magnitudes of a star or other object measured in light of two different spectral regions—for example, blue minus visual (B–V) magnitudes
