Chapter 5 Radiation and Spectra
5.5 Formation of Spectral Lines
Learning Objectives
By the end of this section, you will be able to:
- Explain how emission line spectra and absorption line spectra are formed
- Describe what ions are and how they are formed
- Explain how spectral lines and ionization levels in a gas can help us determine its temperature
We can use Bohr’s model of the atom to understand how spectral lines are formed. The concept of energy levels for the electron orbits in an atom leads naturally to an explanation of why atoms absorb or emit only specific energies or wavelengths of light.
The Hydrogen Spectrum
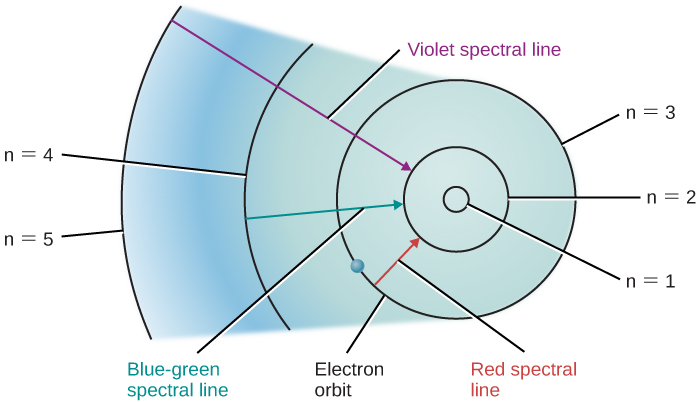
Let’s look at the hydrogen atom from the perspective of the Bohr model. Suppose a beam of white light (which consists of photons of all visible wavelengths) shines through a gas of atomic hydrogen. A photon of wavelength 656 nanometers has just the right energy to raise an electron in a hydrogen atom from the second to the third orbit. Thus, as all the photons of different energies (or wavelengths or colors) stream by the hydrogen atoms, photons with this particular wavelength can be absorbed by those atoms whose electrons are orbiting on the second level. When they are absorbed, the electrons on the second level will move to the third level, and a number of the photons of this wavelength and energy will be missing from the general stream of white light.
Other photons will have the right energies to raise electrons from the second to the fourth orbit, or from the first to the fifth orbit, and so on. Only photons with these exact energies can be absorbed. All of the other photons will stream past the atoms untouched. Thus, hydrogen atoms absorb light at only certain wavelengths and produce dark lines at those wavelengths in the spectrum we see.
Suppose we have a container of hydrogen gas through which a whole series of photons is passing, allowing many electrons to move up to higher levels. When we turn off the light source, these electrons “fall” back down from larger to smaller orbits and emit photons of light—but, again, only light of those energies or wavelengths that correspond to the energy difference between permissible orbits. The orbital changes of hydrogen electrons that give rise to some spectral lines are shown in Figure 1.
Similar pictures can be drawn for atoms other than hydrogen. However, because these other atoms ordinarily have more than one electron each, the orbits of their electrons are much more complicated, and the spectra are more complex as well. For our purposes, the key conclusion is this: each type of atom has its own unique pattern of electron orbits, and no two sets of orbits are exactly alike. This means that each type of atom shows its own unique set of spectral lines, produced by electrons moving between its unique set of orbits.
Astronomers and physicists have worked hard to learn the lines that go with each element by studying the way atoms absorb and emit light in laboratories here on Earth. Then they can use this knowledge to identify the elements in celestial bodies. In this way, we now know the chemical makeup of not just any star, but even galaxies of stars so distant that their light started on its way to us long before Earth had even formed.
Energy Levels and Excitation
Bohr’s model of the hydrogen atom was a great step forward in our understanding of the atom. However, we know today that atoms cannot be represented by quite so simple a picture. For example, the concept of sharply defined electron orbits is not really correct; however, at the level of this introductory course, the notion that only certain discrete energies are allowable for an atom is very useful. The energy levels we have been discussing can be thought of as representing certain average distances of the electron’s possible orbits from the atomic nucleus.
Ordinarily, an atom is in the state of lowest possible energy, its ground state. In the Bohr model of the hydrogen atom, the ground state corresponds to the electron being in the innermost orbit. An atom can absorb energy, which raises it to a higher energy level (corresponding, in the simple Bohr picture, to an electron’s movement to a larger orbit)—this is referred to as excitation. The atom is then said to be in an excited state. Generally, an atom remains excited for only a very brief time. After a short interval, typically a hundred-millionth of a second or so, it drops back spontaneously to its ground state, with the simultaneous emission of light. The atom may return to its lowest state in one jump, or it may make the transition in steps of two or more jumps, stopping at intermediate levels on the way down. With each jump, it emits a photon of the wavelength that corresponds to the energy difference between the levels at the beginning and end of that jump.
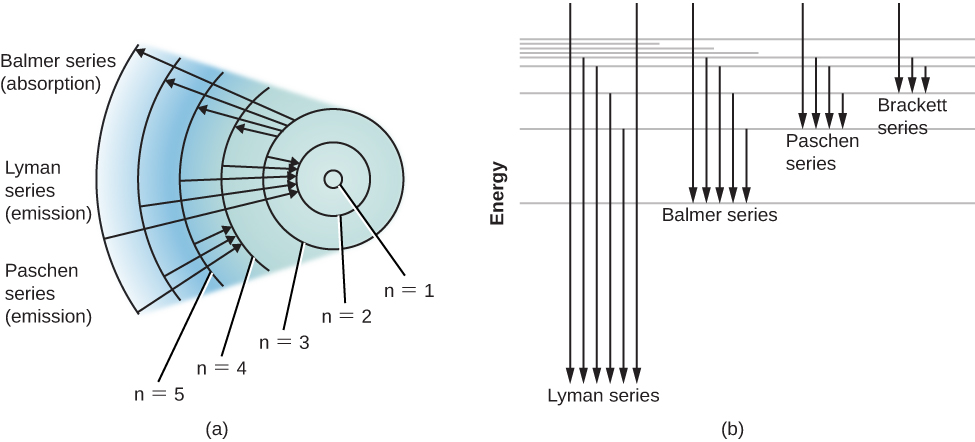
An energy-level diagram for a hydrogen atom and several possible atomic transitions are shown in Figure 2. When we measure the energies involved as the atom jumps between levels, we find that the transitions to or from the ground state, called the Lyman series of lines, result in the emission or absorption of ultraviolet photons. But the transitions to or from the first excited state (labeled n = 2 in part (a) of Figure 2), called the Balmer series, produce emission or absorption in visible light. In fact, it was to explain this Balmer series that Bohr first suggested his model of the atom.
Atoms that have absorbed specific photons from a passing beam of white light and have thus become excited generally de-excite themselves and emit that light again in a very short time. You might wonder, then, why dark spectral lines are ever produced. In other words, why doesn’t this reemitted light quickly “fill in” the darker absorption lines?
Imagine a beam of white light coming toward you through some cooler gas. Some of the reemitted light is actually returned to the beam of white light you see, but this fills in the absorption lines only to a slight extent. The reason is that the atoms in the gas reemit light in all directions, and only a small fraction of the reemitted light is in the direction of the original beam (toward you). In a star, much of the reemitted light actually goes in directions leading back into the star, which does observers outside the star no good whatsoever.
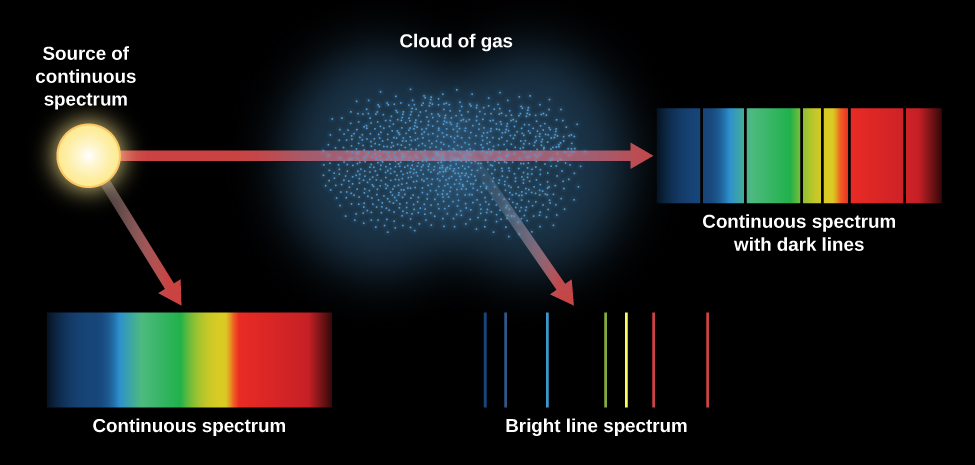
Figure 3 summarizes the different kinds of spectra we have discussed. An incandescent lightbulb produces a continuous spectrum. When that continuous spectrum is viewed through a thinner cloud of gas, an absorption line spectrum can be seen superimposed on the continuous spectrum. If we look only at a cloud of excited gas atoms (with no continuous source seen behind it), we see that the excited atoms give off an emission line spectrum.
Atoms in a hot gas are moving at high speeds and continually colliding with one another and with any loose electrons. They can be excited (electrons moving to a higher level) and de-excited (electrons moving to a lower level) by these collisions as well as by absorbing and emitting light. The speed of atoms in a gas depends on the temperature. When the temperature is higher, so are the speed and energy of the collisions. The hotter the gas, therefore, the more likely that electrons will occupy the outermost orbits, which correspond to the highest energy levels. This means that the level where electrons start their upward jumps in a gas can serve as an indicator of how hot that gas is. In this way, the absorption lines in a spectrum give astronomers information about the temperature of the regions where the lines originate.
Ionization
We have described how certain discrete amounts of energy can be absorbed by an atom, raising it to an excited state and moving one of its electrons farther from its nucleus. If enough energy is absorbed, the electron can be completely removed from the atom—this is called ionization. The atom is then said to be ionized. The minimum amount of energy required to remove one electron from an atom in its ground state is called its ionization energy.
Still-greater amounts of energy must be absorbed by the now-ionized atom (called an ion) to remove an additional electron deeper in the structure of the atom. Successively greater energies are needed to remove the third, fourth, fifth—and so on—electrons from the atom. If enough energy is available, an atom can become completely ionized, losing all of its electrons. A hydrogen atom, having only one electron to lose, can be ionized only once; a helium atom can be ionized twice; and an oxygen atom up to eight times. When we examine regions of the cosmos where there is a great deal of energetic radiation, such as the neighborhoods where hot young stars have recently formed, we see a lot of ionization going on.
An atom that has become positively ionized has lost a negative charge—the missing electron—and thus is left with a net positive charge. It therefore exerts a strong attraction on any free electron. Eventually, one or more electrons will be captured and the atom will become neutral (or ionized to one less degree) again. During the electron-capture process, the atom emits one or more photons. Which photons are emitted depends on whether the electron is captured at once to the lowest energy level of the atom or stops at one or more intermediate levels on its way to the lowest available level.
Just as the excitation of an atom can result from a collision with another atom, ion, or electron (collisions with electrons are usually most important), so can ionization. The rate at which such collisional ionizations occur depends on the speeds of the atoms and hence on the temperature of the gas—the hotter the gas, the more of its atoms will be ionized.
The rate at which ions and electrons recombine also depends on their relative speeds—that is, on the temperature. In addition, it depends on the density of the gas: the higher the density, the greater the chance for recapture, because the different kinds of particles are crowded more closely together. From a knowledge of the temperature and density of a gas, it is possible to calculate the fraction of atoms that have been ionized once, twice, and so on. In the Sun, for example, we find that most of the hydrogen and helium atoms in its atmosphere are neutral, whereas most of the calcium atoms, as well as many other heavier atoms, are ionized once.
The energy levels of an ionized atom are entirely different from those of the same atom when it is neutral. Each time an electron is removed from the atom, the energy levels of the ion, and thus the wavelengths of the spectral lines it can produce, change. This helps astronomers differentiate the ions of a given element. Ionized hydrogen, having no electron, can produce no absorption lines.
Key Concepts and Summary
When electrons move from a higher energy level to a lower one, photons are emitted, and an emission line can be seen in the spectrum. Absorption lines are seen when electrons absorb photons and move to higher energy levels. Since each atom has its own characteristic set of energy levels, each is associated with a unique pattern of spectral lines. This allows astronomers to determine what elements are present in the stars and in the clouds of gas and dust among the stars. An atom in its lowest energy level is in the ground state. If an electron is in an orbit other than the least energetic one possible, the atom is said to be excited. If an atom has lost one or more electrons, it is called an ion and is said to be ionized. The spectra of different ions look different and can tell astronomers about the temperatures of the sources they are observing.
Glossary
- excitation
- the process of giving an atom or an ion an amount of energy greater than it has in its lowest energy (ground) state
- ground state
- the lowest energy state of an atom
- ion
- an atom that has become electrically charged by the addition or loss of one or more electrons
- ionization
- the process by which an atom gains or loses electrons
