Chapter 21 The Birth of Stars and the Discovery of Planets outside the Solar System
21.8 Collaborative Group Exercises, Questions and Exercises
Collaborative Group Activities
- Your group is a subcommittee of scientists examining whether any of the “hot Jupiters” (giant planets closer to their stars than Mercury is to the Sun) could have life on or near them. Can you come up with places on, in, or near such planets where life could develop or where some forms of life might survive?
- A wealthy couple (who are alumni of your college or university and love babies) leaves the astronomy program several million dollars in their will, to spend in the best way possible to search for “infant stars in our section of the Galaxy.” Your group has been assigned the task of advising the dean on how best to spend the money. What kind of instruments and search programs would you recommend, and why?
- Some people consider the discovery of any planets (even hot Jupiters) around other stars one of the most important events in the history of astronomical research. Some astronomers have been surprised that the public is not more excited about the planet discoveries. One reason that has been suggested for this lack of public surprise and excitement is that science fiction stories have long prepared us for there being planets around other stars. (The Starship Enterprise on the 1960s Star Trek TV series found some in just about every weekly episode.) What does your group think? Did you know about the discovery of planets around other stars before taking this course? Do you consider it exciting? Were you surprised to hear about it? Are science fiction movies and books good or bad tools for astronomy education in general, do you think?
- What if future space instruments reveal an earthlike exoplanet with significant amounts of oxygen and methane in its atmosphere? Suppose the planet and its star are 50 light-years away. What does your group suggest astronomers do next? How much effort and money would you recommend be put into finding out more about this planet and why?
- Discuss with your group the following question: which is easier to find orbiting a star with instruments we have today: a jovian planet or a proto-planetary disk? Make a list of arguments for each side of this question.
- (This activity should be done when your group has access to the internet.) Go to the page which indexes all the publicly released Hubble Space Telescope images by subject: http://hubblesite.org/newscenter/archive/browse/image/ . Under “Star,” go to “Protoplanetary Disk” and find a system—not mentioned in this chapter—that your group likes, and prepare a short report to the class about why you find it interesting. Then, under “Nebula,” go to “Emission” and find a region of star formation not mentioned in this chapter, and prepare a short report to the class about what you find interesting about it.
- There is a “citizen science” website called Planet Hunters ( http://www.planethunters.org/ ) where you can participate in identifying exoplanets from the data that Kepler provided. Your group should access the site, work together to use it, and classify two light curves. Report back to the class on what you have done.
- Yuri Milner, a Russian-American billionaire, recently pledged $100 million to develop the technology to send many miniaturized probes to a star in the Alpha Centauri triple star system (which includes Proxima Centauri, the nearest star to us, now known to have at least one planet.) Each tiny probe will be propelled by powerful lasers at 20% the speed of light, in the hope that one or more might arrive safely and be able to send back information about what it’s like there. Your group should search online for more information about this project (called “Breakthrough: Starshot”) and discuss your reactions to this project. Give specific reasons for your arguments.
Review Questions
1: Give several reasons the Orion molecular cloud is such a useful “laboratory” for studying the stages of star formation.
2: Why is star formation more likely to occur in cold molecular clouds than in regions where the temperature of the interstellar medium is several hundred thousand degrees?
3: Why have we learned a lot about star formation since the invention of detectors sensitive to infrared radiation?
4: Describe what happens when a star forms. Begin with a dense core of material in a molecular cloud and trace the evolution up to the time the newly formed star reaches the main sequence.
5: Describe how the T Tauri star stage in the life of a low-mass star can lead to the formation of a Herbig-Haro (H-H) object.
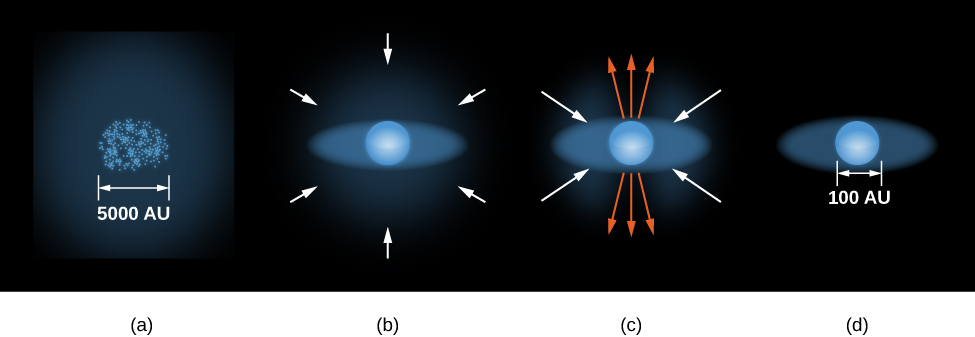
6: Look at the four stages shown in Figure 21.7. In which stage(s) can we see the star in visible light? In infrared radiation?
This is reproduced below
7: The evolutionary track for a star of 1 solar mass remains nearly vertical in the H–R diagram for a while (see Figure 1). How is its luminosity changing during this time? Its temperature? Its radius?
8: Two protostars, one 10 times the mass of the Sun and one half the mass of the Sun are born at the same time in a molecular cloud. Which one will be first to reach the main sequence stage, where it is stable and getting energy from fusion?
9: Compare the scale (size) of a typical dusty disk around a forming star with the scale of our solar system.
10: Why is it so hard to see planets around other stars and so easy to see them around our own?
11: Why did it take astronomers until 1995 to discover the first exoplanet orbiting another star like the Sun?
12: Which types of planets are most easily detected by Doppler measurements? By transits?
13: List three ways in which the exoplanets we have detected have been found to be different from planets in our solar system.
14: List any similarities between discovered exoplanets and planets in our solar system.
15: What revisions to the theory of planet formation have astronomers had to make as a result of the discovery of exoplanets?
16: Why are young Jupiters easier to see with direct imaging than old Jupiters?
Thought Questions
17: A friend of yours who did not do well in her astronomy class tells you that she believes all stars are old and none could possibly be born today. What arguments would you use to persuade her that stars are being born somewhere in the Galaxy during your lifetime?
18: Observations suggest that it takes more than 3 million years for the dust to begin clearing out of the inner regions of the disks surrounding protostars. Suppose this is the minimum time required to form a planet. Would you expect to find a planet around a 10-MSun star? (Refer to the section on the Death of Stars.)
19: Suppose you wanted to observe a planet around another star with direct imaging. Would you try to observe in visible light or in the infrared? Why? Would the planet be easier to see if it were at 1 AU or 5 AU from its star?
20: Why were giant planets close to their stars the first ones to be discovered? Why has the same technique not been used yet to discover giant planets at the distance of Saturn?
21: Exoplanets in eccentric orbits experience large temperature swings during their orbits. Suppose you had to plan for a mission to such a planet. Based on Kepler’s second law, does the planet spend more time closer or farther from the star? Explain.
Figuring for Yourself
22: When astronomers found the first giant planets with orbits of only a few days, they did not know whether those planets were gaseous and liquid like Jupiter or rocky like Mercury. The observations of HD 209458 settled this question because observations of the transit of the star by this planet made it possible to determine the radius of the planet. Use the data given in the text to estimate the density of this planet, and then use that information to explain why it must be a gas giant.
23: An exoplanetary system has two known planets. Planet X orbits in 290 days and Planet Y orbits in 145 days. Which planet is closest to its host star? If the star has the same mass as the Sun, what is the semi-major axis of the orbits for Planets X and Y?
24: Kepler’s third law says that the orbital period (P in years) is P2 = a3 where a is the distance in AU. Or the period P is proportional to the square root of the cube of the mean distance (in AU) from the Sun (P proportional to a1.5). For mean distances from 0.1 to 32 AU, calculate and plot a curve showing the expected Keplerian period. For each planet in our solar system, look up the mean distance from the Sun in AU and the orbital period in years and plot these data on the theoretical Keplerian curve to see how closely the real data from our solar system matches the theory.
25: Calculate the transit depth for an M dwarf star that is 0.3 times the radius of the Sun with a gas giant planet the size of Jupiter.
26: If a transit depth of 0.00001 can be detected with the Kepler spacecraft, what is the smallest planet that could be detected around a 0.3 Rsun M dwarf star?
27: What fraction of gas giant planets seems to have inflated radii?
