1 Topic 2.1. Introduction to Climate Data and Climate Models

Video #1: The importance of climate data:
Video #2: How to get climate data (1/2):
Video #2: How to get climate data (2/2):
Contents
1. The importance of climate data
1.1. Determining terrestrial biome types
1.2. Controlling the distribution of plants
1.3. Affecting the local adaptation of populations within a species
1.4. Essential for climate change-related studies
2. How to obtain climate data?
2.1. Weather stations
2.2. Interpolated climate data
2.3. Climate models
2.4. Climate models
3. Climate variables and time intervals
3.1. Essential Climate Variables
3.2. Observed and calculated climate variables
3.3. Time scales
3. Major sources of climate data
Summary
1. Why climate data are important?
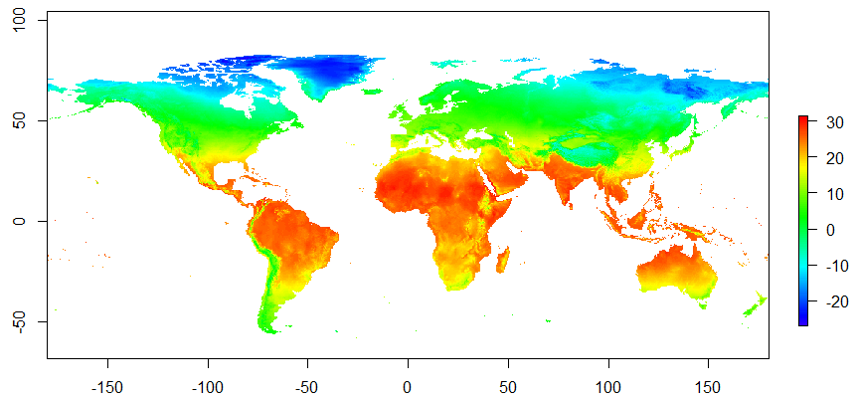
1.1 Determining terrestrial biome types.
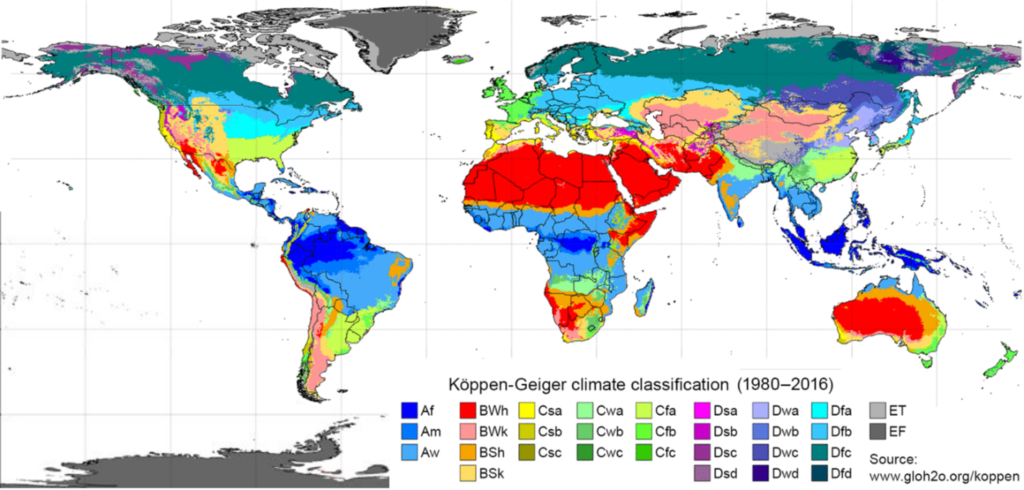
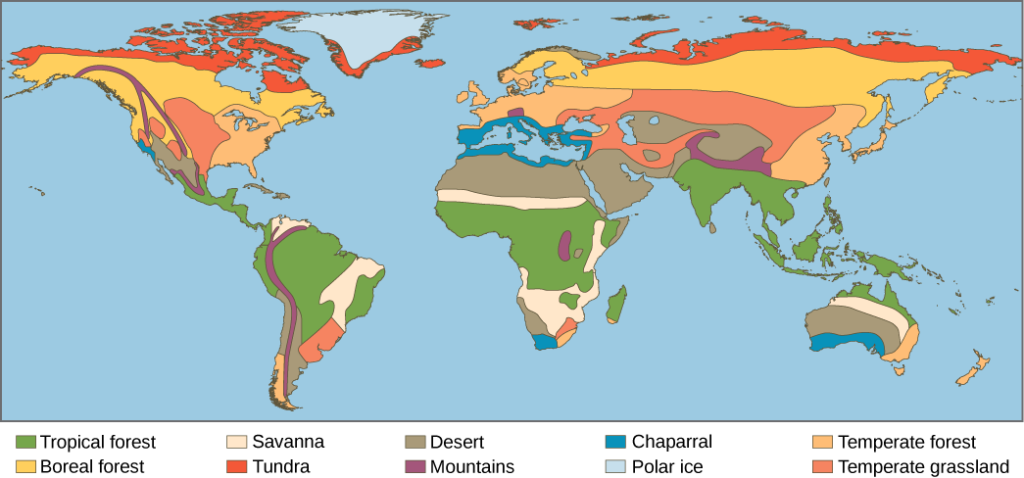
Each biome has a specific range of temperatures and levels of precipitation (including both rainfall and snowfall). The patterns of global distributions of climate (Figure 1) and biome classifications (Figure 2) are so similar. Typically, tropical climates have tropical forests while boreal climates support boreal forests. If we know what temperature and precipitation are like in a location, we can often predict what type of biome will be found there. Climate variables have been used to build ecological models to predict biomes and forest ecosystems.
1.2. Controlling the distribution of plants
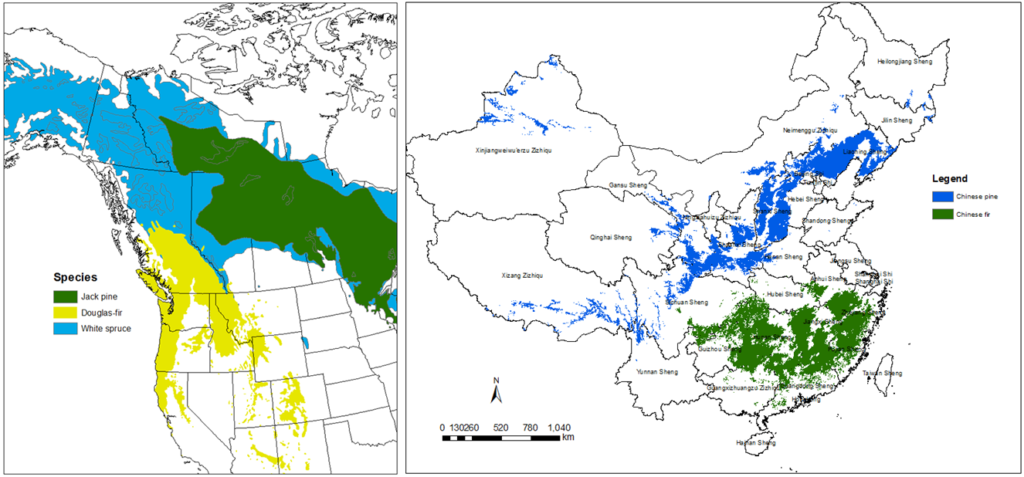
The distributions of plants are primarily controlled by climate (Tuhkanen, 1980; Woodward and Williams, 1987). Thus, climate variables have widely been used to build species distribution models and climate niches models, which will be covered later in this course.
1.3 Affecting the local adaptation of populations within a species
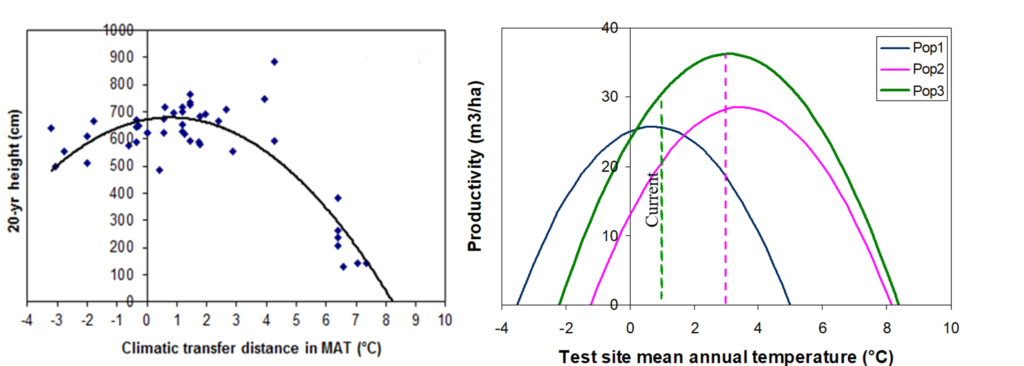
Climate is also a major factor affecting the adaptation and productivity of forest tree populations. Population transfer functions are built to determine the effect of transfer distance of a population in terms of climate variables (Figure 4, left), and population response functions (Figure 4, right) are developed to model the response of populations to climate.
1.4. Essential for climate change-related studies
Climate data are essential in most of the climate change-related studies and applications. Historical climate data are used to build and validate various types of models as mentioned above. Projected future climate data are used to assess the impact of climate change on ecosystems, species, and populations. Paleoclimate data can be used to backcast for studying the paleo history of plant migration and evolution (Figure 5).
2. How to obtain climate data?
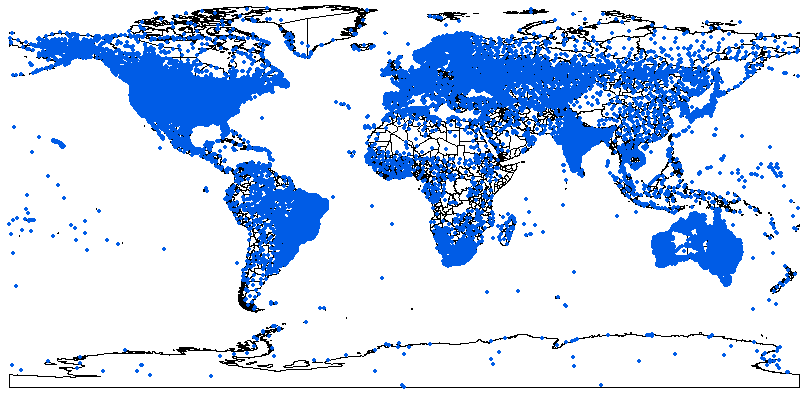
2.1. Weather stations
Observations from weather stations (Figure 6) provide the most accurate climate data. However, weather stations are expensive to establish and maintain. Thus, the number of weather stations is limited, especially in developing countries. Even in developed countries, weather stations are mostly located in areas with easy access near cities or in valleys. The representation of climate data from weather stations for climate conditions of forest stands or plots is far from being adequate. Therefore, climate models are necessary to generate climate data for full coverages.
2.2. Interpolated climate data
Spatially interpolated climate data generated using various interpolation approaches can provide climate data for everywhere within its coverage. The interpolation is based on observations from weather stations. The quality of the climate data depends on both the density of the weather stations and the performance of the climate model used to make the interpolations. In most cases, interpolated climate data are delivered at certain spatial resolutions, which also affect the accuracy of the climate data for specific locations, especially for locations in mountains, where climate varies a lot within small areas due to the changes in elevation. There are many climate datasets that provide interpolated climate data. The most widely used ones include WorldClim, PRISM, CRU, and ClimateNA, which are to be described later in this topic.
2.3. Climate models
Climate models are systems of differential equations based on the basic laws of physics, fluid motion, and chemistry. They are used for a variety of purposes from the study of the dynamics of the climate system to projections of future climate.
Climate models vary in complexity:
- A simple radiant heat transfer model treats the earth as a single point and averages outgoing energy.
- This can be expanded vertically (radiative-convective models) and/or horizontally.
- Finally, (coupled) atmosphere–ocean–sea ice global climate models solve the full equations for mass and energy transfer and radiant exchange, such as General Circulation Models (GCMs).
GCMs discretize the equations for fluid motion and energy transfer and integrate these over time. Atmospheric GCMs (AGCMs) model the atmosphere and impose sea surface temperatures as boundary conditions. Coupled atmosphere-ocean GCMs (AOGCMs, e.g. HadCM3, EdGCM, GFDL CM2.X, ARPEGE-Climat) combine the two models.
The first general circulation climate model that combined both oceanic and atmospheric processes was developed in the late 1960s at the NOAA Geophysical Fluid Dynamics Laboratory[16] AOGCMs represent the pinnacle of complexity in climate models and internalise as many processes as possible. However, they are still under development and uncertainties remain. They may be coupled to models of other processes, such as the carbon cycle, so as to better model feedback effects. Such integrated multi-system models are sometimes referred to as either “earth system models” or “global climate models.”
Video 1. This video explores how global climate models provide weather forecasts and climate projections, including details on model resolution and reliability. This video has been produced by CSIRO in collaboration with the Australian Bureau of Meteorology with funding from Inspiring Australia. It is posted on Youtube at https://youtu.be/Ir7J0eEuWgk
2.4. Coupled Model Intercomparison Project (CMIP)
CMIP5 uses Representative Concentration Pathways (RCPs) for four greenhouse gas concentration (not emissions) trajectories: RCP2.6, RCP 4.5, RCP 6.0, and RCP 8.5. RCP values are peaking values in radiative forcing before 2100 and decline. For example, the peaking value for RCP2.6 is about 2.6 W/m2.
CMIP6 updated CMIP5 scenarios and the new scenarios are called SSP1-2.6, SSP2-4.5, SSP4-6.0, and SSP5-8.5. Each of which result in similar 2100 radiative forcing levels as their predecessor in CMIP5. A number of new scenarios are added, including: SSP1-1.9, SSP4-3.4, SSP5-3.4 and SSP3-7.0. The levels of CO2 emissions in CMIP6 are higher than that in CMIP5 in RCP2.6 and RCP8.5, but lower in RCP6.0.
3. Climate variables and time intervals
3.1. Essential Climate Variables
Essential Climate Variables (ECVs) are the climate variables that critically contribute to the characterization of the earth’s climate. The ECVs of earth’s surface include temperature, precipitation, wind speed and direction, radiation, pressure, and water vapour. However, only temperature, precipitation, and their combinations, sometimes radiation, are often used in developing ecological models.
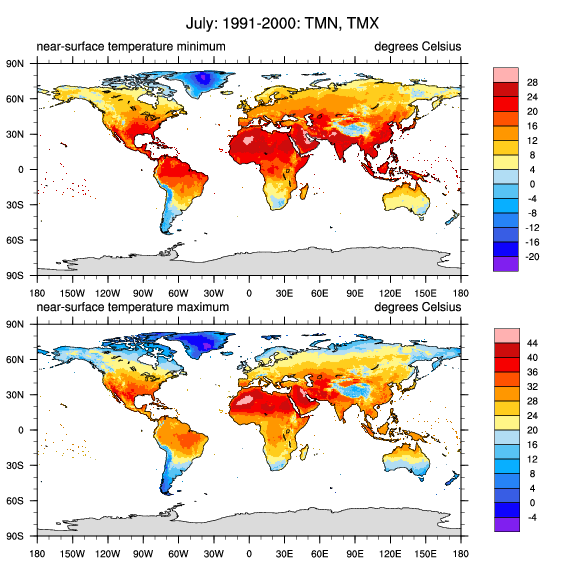
3.2. Observed and calculated climate variables
3.3. Time scales
Climate variables can be obtained at different time intervals or frequencies, such as hourly, daily, monthly, and annually. Decadal and normal period (30 years) averages are often used on many occasions. As mentioned in Module 1, climate refers to long-term climatic conditions, typically 30-year averages.
Daily climate variables are commonly provided by weather stations. Daily climate variables are used to calculate monthly, seasonal and annual climate variables. They are also used to calculate additional biologically-important climate variables, such various forms of degree-days, frost-free periods, and extreme temperatures. However, the size of daily climate data is often too large to be delivered and to handle model applications. Thus, daily climate data are not available in most interpolated climate datasets.
Monthly, seasonal and annual climate variables are most widely used in ecological models, especially in climate niche and species distribution models. The file size for climate variables at these time intervals is relatively small and feasible for the use of model predictions.
Annual climate variables have special significance. Mean annual temperature (MAT) and mean annual precipitation (MAP) are the most widely used climate variables. Annual chilling degree-days, growing degree-days, and annual climatic moisture deficit (CMD) are top important biologically relevant climate variables.
4. Major sources of climate data
4.1. WorldClim
WorldClim is a set of global climate layers (gridded climate data) with a spatial resolution of about 1 km2 in Version 1 and 2, and lower spatial resolutions in Version 2. The ANUSPLIN software is used to interpolate climate variables observed at weather stations for both versions. ANUSPLIN is a program for interpolating noisy multi-variate data using thin plate smoothing splines. Latitude, longitude, and elevation were used as independent variables.
WorldClim Version 1
WorldClim version 1 has average monthly climate data for minimum, mean, and maximum temperature and for precipitation for 1960-1990. The data layers were generated through interpolation of average monthly climate data from weather stations. Variables included are monthly total precipitation, and monthly mean, minimum and maximum temperature, and 19 derived bioclimatic variables (https://www.worldclim.org/bioclim).
Available climate data for free download (https://www.worldclim.org/version1) include:
- Current conditions (interpolations of observed data, representative of 1960-1990)
- Future conditions: downscaled global climate model (GCM) data from CMIP5 (IPPC Fifth Assessment)
- Past conditions (downscaled global climate model output)
WorldClim Version2
WorldClim version 2 (https://www.worldclim.org/version2) has average monthly climate data for minimum, mean, and maximum temperature and for precipitation for 1970-2000 only for now. Climate variables can be downloaded for different spatial resolutions, from 30 seconds (~1 km2) to 10 minutes (~340 km2). More climate variables are included in this version, including solar radiation, wind speed, and water vapour.
4.2 CRU climate data
The gridded Climatic Research Unit (CRU) Time-series (TS) data version 4.03 data are month-by-month variations in climate over the period 1901-2018, provided on high-resolution (0.5×0.5 degree) grids, produced by CRU at the University of East Anglia.
The CRU TS4.03 variables are cloud cover, diurnal temperature range, frost day frequency, potential evapotranspiration (PET), precipitation, daily mean temperature, monthly average daily maximum and minimum temperature, and vapour pressure for the period January 1901 – December 2018.
The monthly dataset was generated using Angular Distance Weighting (ADW) interpolation approach, which weights the data points by distance relative to a correlation decay distance and gives more weight to isolated data points. The time-series dataset can be downloaded at https://crudata.uea.ac.uk/cru/data/hrg/cru_ts_4.03/
The 0.5° x 0.5° spatial resolution is too low for ecological modeling at a local, especially in mountainous regions.
4.3 PRISM climate data
The PRISM Climate Group gathers climate observations from a wide range of monitoring networks, applies sophisticated quality control measures, and develops spatial climate datasets to reveal short- and long-term climate patterns. The resulting datasets incorporate a variety of modeling techniques and are available at multiple spatial/temporal resolutions, covering the period from 1895 to the present. It offers these datasets to the public, either free of charge or for a fee (depending on dataset size/complexity and funding available for the activity).
The PRISM data were developed using the PRISM model that incorporates weather station data, a digital elevation model, and expert knowledge of climate patterns such as rain shadows, coastal effects, orographic lift, and temperature inversions over topographically delineated ‘‘facets’’ (Daly et al. 2002). PRISM data have clear advantages over other products in reflecting these effects, especially for precipitation.
The PRISM climate datasets are available for the United States except for AK. The datasets include PRISM normals cover the period 1981-2010, monthly for Historical Past (1895-1980) and for Recent Years (Jan 1981 – May 2019) at http://www.prism.oregonstate.edu/.
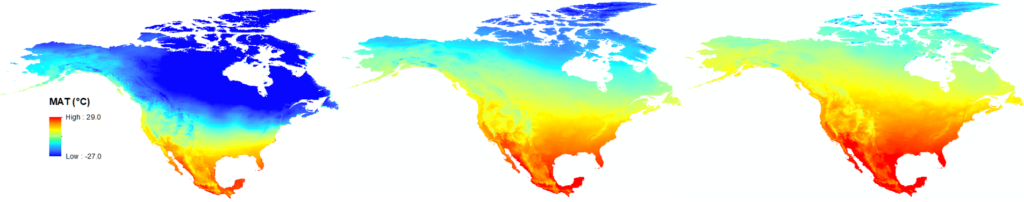
4.4 ClimateNA
ClimateNA is a standalone MS Windows software application (Wang et al. 2016) that extracts and downscales gridded (4 x 4 km) monthly climate data for the reference normal period (1961-1990) from PRISM (Daly et al. 2008) and WorldClim (Hijmans et al. 2005) to scale-free point locations. It also calculates many (>200) monthly, seasonal and annual climate variables. The downscaling is achieved through a combination of bilinear interpolation and dynamic local elevational adjustment. ClimateNA also uses the scale-free data as a baseline to downscale historical and future climate variables for individual years and periods between 1901 and 2100. A time-series function is available to generate climate variables for multiple locations and multiple years.
The program can read and output comma-delimitated spreadsheet (CSV) files. The new version (v6.00) can also directly read digital elevation model (DEM) raster (ASC) files and output climate variables in raster format for mapping. The spatial resolution of the raster files is up to the user’s preference. The coverage of the program is shown in Figure 9.
Summary
Climate is a key abiotic factor that determines terrestrial biome types. Climate also controls the distribution of plants and affects the local adaptation of populations within a species. Thus, climate data are essential for climate change-related studies. There are many sources to obtain climate data, including observations from weather stations, interpolated surfaces, and climate models’ predictions. However, the quality of the climate data and availability of climate variables vary considerably. It is important to know the sources and to understand their differences for students to conduct climatic and ecological modeling.
By Tongli Wang, Climate Modelling and Forest Applications is licensed under Creative Commons <CC BY-NC-ND 4.0> License
