10 Topic 5.3. Case Studies with Forest ecosystems
Contents
1 Biogeoclimatic ecosystems in British Columbia
1.1 Climate niche modeling
1.2 Uncertainty of future projections
1.3 Consensus projections
1.4 Impacts of climate change on BEC zones
1.5 Management implications
2. Forest ecosystem in China
2.1 Climate niche modeling
2.2 Future projections
2.3 Management for adaptation to climate change
1. Biogeoclimatic ecosystems in British Columbia
The forest ecosystem in British Columbia, Canada, is defined through the Biogeoclimatic Ecosystem Classification (BEC) system. The BEC system divides the province into 16 ecological zones (BEC zones) that reflect terrestrial ecosystem differences along largescale climate gradients related to changes in altitude, latitude, and continentality (Figure 7). These ecological zones are subdivided into subzones and variants, reflecting plant community composition and structure differences along finer-scale climate gradients. It is probably the best-defined forest ecosystem in the world, and serve as the foundation for forest resources management and genetic conservation in the province.
Each ecological unit represents a plant community, thus predictions of the climate niche supporting the plant community may serve broader objectives than predictions of individual species.
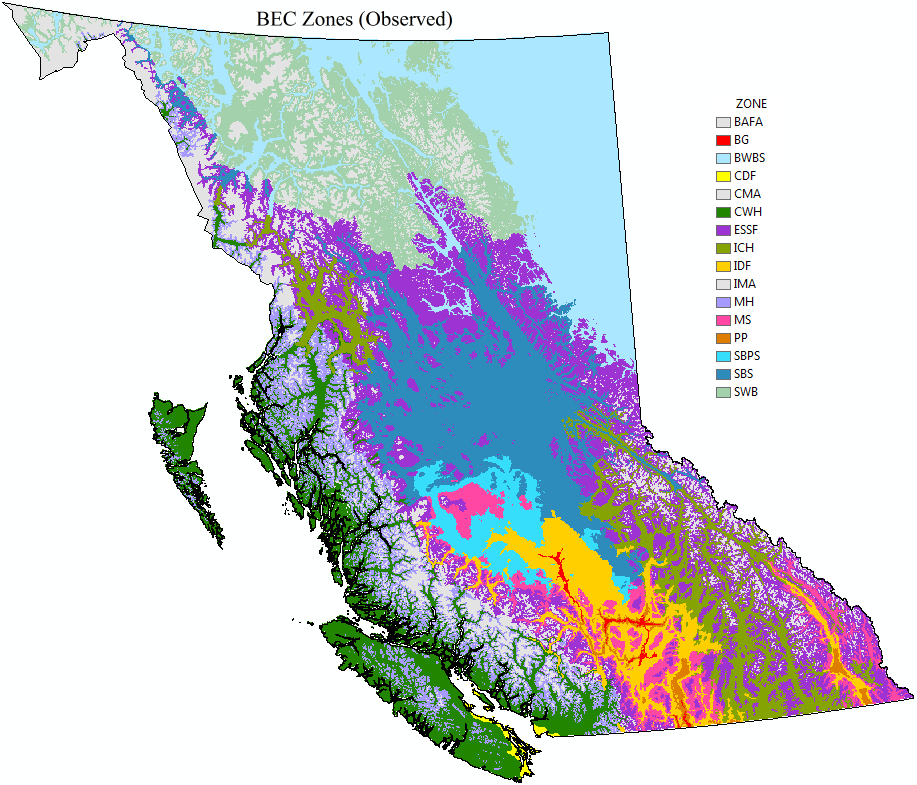
Figure 7. Geographic distributions of ecological zones in British Columbia. Image by Tongli Wang under CC BY 4.0.
1.1 Climate niche modeling
The climate niche of each BEC zone was modeled based on the relationships between the spatial variation of climate variables and the location of the BEC zone (Figure 8). The model was built using the Random Forest algorithm with scale-free climate data generated by ClimateBC.
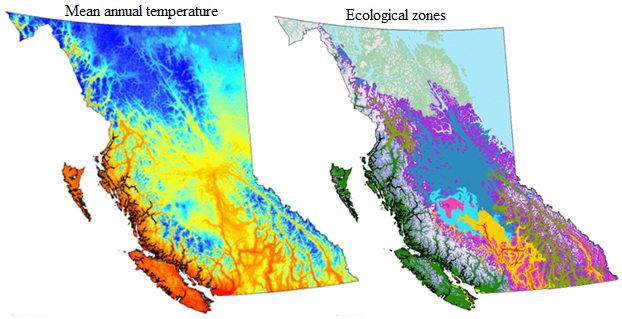
Figure 8. Geographic distributions of mean annual temperature and ecological zones in British Columbia. Image by Tongli Wang under CC BY 4.0.
Predicted climate niches of the ecological zones match well with the mapped zones, indicating high accuracy of the model predictions.
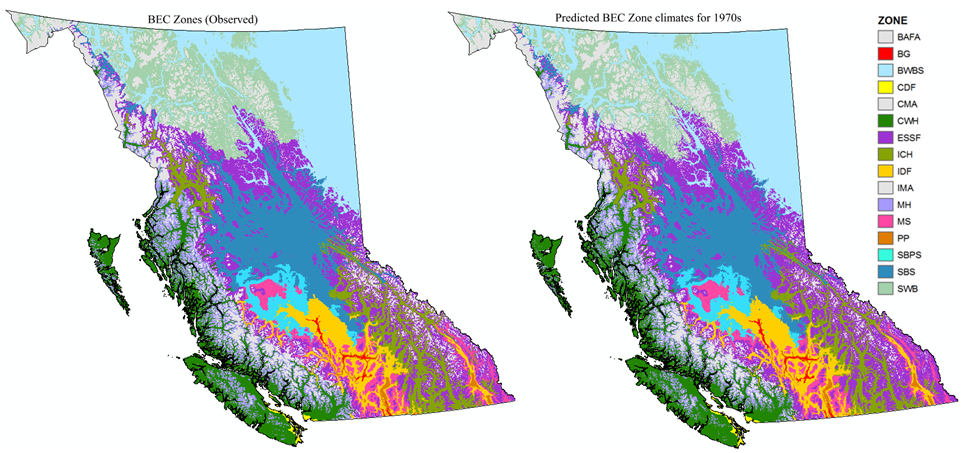
Figure 9. Geographic distributions of mapped ecological zones (left) and predicted climate niches of these zone in British Columbia. Image by Tongli Wang under CC BY 4.0.
1.2 Uncertainty of future projections
Large uncertainty exists in projecting future climates. Different general circulation models with different climate change scenarios provide a different projection for a future period. For example, 134 GCM-scenarios combinations show a wide range of projected changes by the 2050s (Figure 10). It suggests that random or systematic selection of few GCM-scenario combinations cannot well represent the distribution of future projections. For the projections of BEC zones, 20 combinations (squares) were selected.
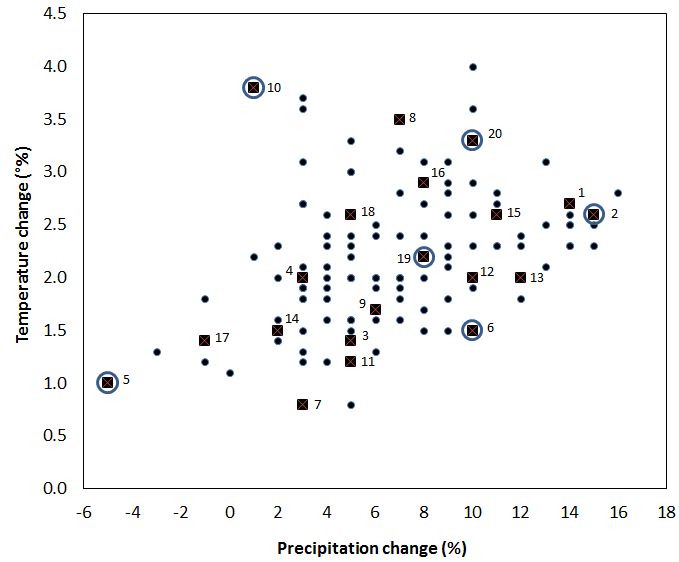
Figure 10. Distributions of projected change in temperature and precipitation from 134 GCM and scenario combinations. Squares are selected for BEC zone projections. Squares with a circle are used to illustrate the impact on BEC zone projections in Figure 11. Image by Tongli Wang under CC BY 4.0.
Six GCM-scenarios were also selected to illustrate the difference in future projections of the BEC zones in Figure 11. Differences in the projected impact of climate change are substantial, which would lead to very different management recommendations.
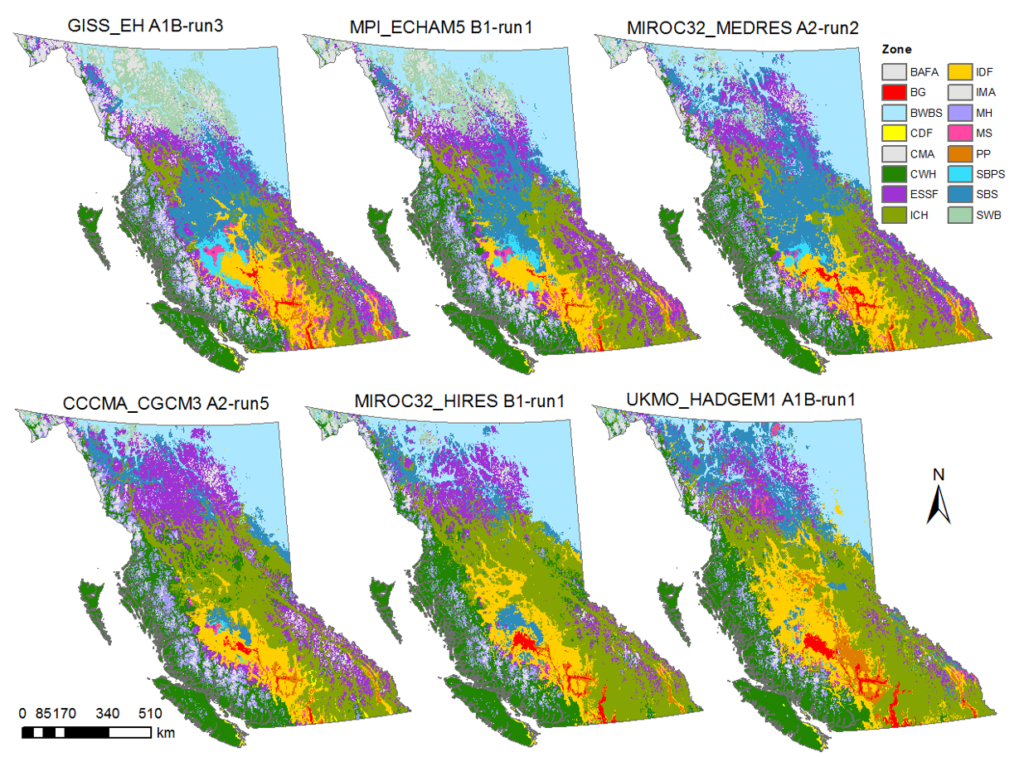
Figure 11. BEC zone projections for the 2050s with six contrasting GCM-scenario combinations, arranged from most conserve to most aggressive climate change scenarios. Image by Tongli Wang under CC BY 4.0.
1.3 Consensus projections
An effective way to consider the uncertainty is to take a consensus projection from a large number of individual projections as shown in Figure 12.
Figure 12. A consensus projection from individual projections. Image by Tongli Wang under CC BY 4.0.
After taking the consensus projections, there is one map, instead of 20 maps, for each period (Figure 13), which best represent the distribution of all projections.
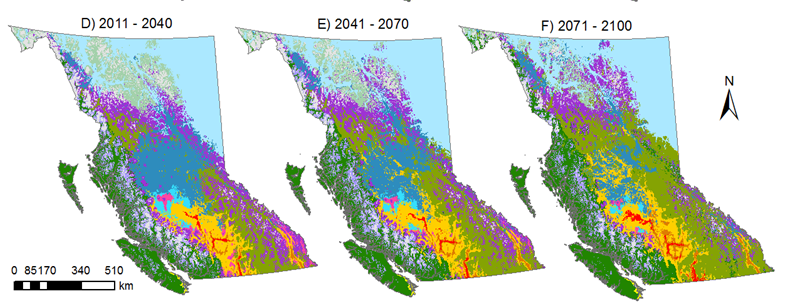
Figure 13. Consensus projections of BC BEC zones for 2011-2040, 2041-2070 and 2071-2100. Image by Tongli Wang under CC BY 4.0.
1.4 Impacts of climate change on BEC zones
Impacts of climate change on BEC zones vary from zone to zone (Figure 14). The ICH, PP, IDF, CWH, BWBS, and BG zone are projected to expand. The expansion of the ICH zone is dramatic, not only in percentage (Figure 14) but also in absolute areas (Figure 13). Forest tree species associated with these zones include western redcedar, western hemlock, interior Douglas-fir and ponderosa pine.
On the other hand, all the other zones are projected to contract. The contraction is most serious in the MS, SBPS, SWB, and AT zone. Species associated with these zones are interior spruce, lodgepole pine, and subalpine fir.
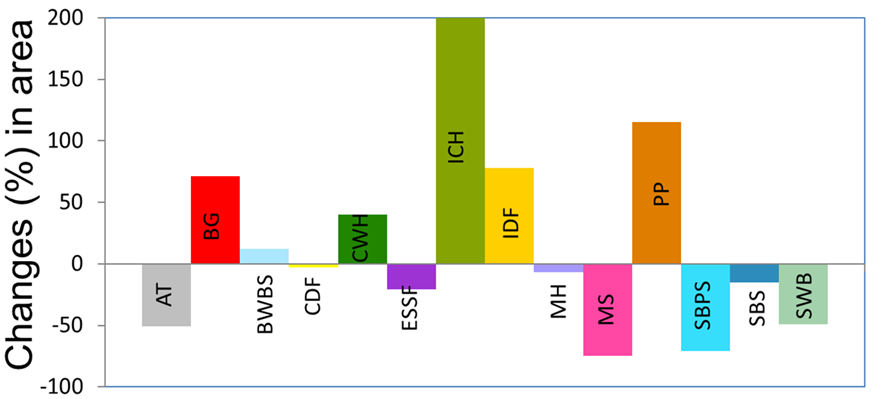
Figure 14. Changes in percent area (%) of each BEC zones for 2041-2070. Image by Tongli Wang under CC BY 4.0.
1.5 Management implications
The ecological units in British Columbia are the foundation of species selected for plantations. Projected shift and expansion/contraction provide a scientific basis to consider the impact of climate change. For zones in expansion, more seed orchards may need to be planned for their associated species, such as western redcedar, interior Douglas-fir and ponderosa pine. On the other hand, it should be cautious to plan new seed orchards for interior spruce.
In most parts of British Columbia, low temperature is a limit to forest tree growth. Thus, climate change brings in challenges, but also opportunities. The expansion of suitable climate conditions for the fast-growing species, including western redcedar, Douglas-fir, western larch, and ponderosa pine is a clear indication. To take these opportunities, assisted migration is needed to plant these species in their potentially suitable areas progressively.
Please note that the above-mentioned projections are at the zone level. Projections at the subzone-variant level are also available at http://www.climatewna.com/ClimateBC_Map.aspx.
2. Forest ecosystem in China
There are about 3,000 tree species in China. The number of commercial tree species is also over hundreds. To model the species distributions of all the species and project their shifts in future climates are unrealistic. To use forest ecotypes as surrogates, as shown for BEC zones, can be particularly effective.
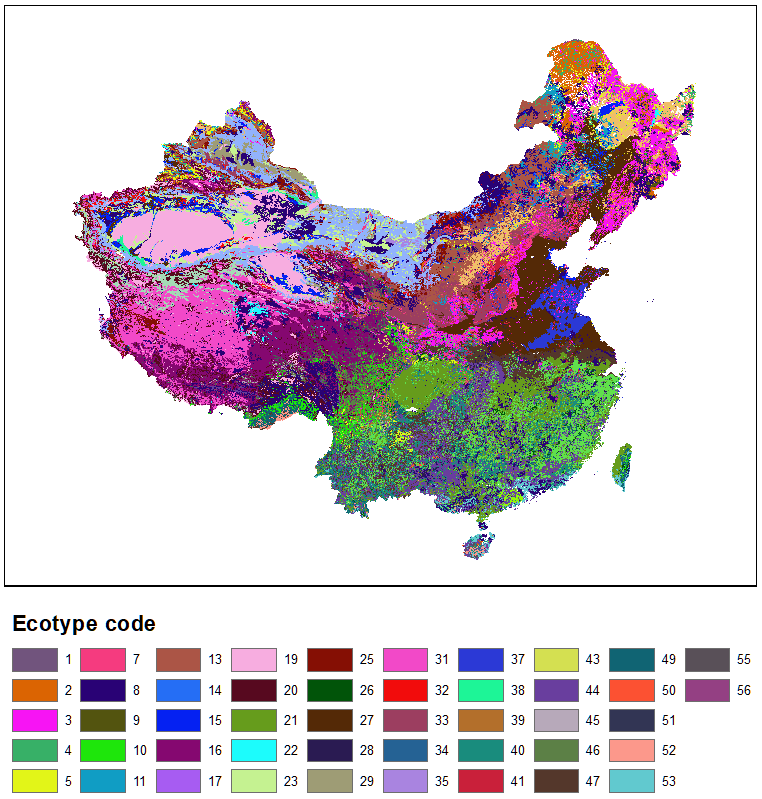
There is no BEC equivalent forest ecosystem classification system in China. Instead, there are four levels of vegetation classifications available in the digital archive of Chinese Vegetation. The level III vegetation classification, with 56 ecotypes, has the closest match to the level of BEC zones in British Columbia, thus were used to represent the forest ecotypes of the country as shown in Figure 9. The 56 ecotypes represent the vegetation communities and the macroclimate conditions across the entire China. The typical forest ecotypes include broadleaf deciduous forests in the temperate zone (#3), needle-leaf forests in the subtropical zone (#31), broadleaf evergreen and deciduous scrubs in the subtropical and tropical zone (#44). The major ecotypes for none forested areas include: Two years three ripes or one year two ripes grain fields and deciduous orchards (#27, dark brown), One year two ripes or three ripes grain fields; evergreen orchards and subtropical economic tree plantations (#21, dark green), Semi-shrub and dwarf semi-shrub deserts (#24), and grass-carex spp. high-cold steppes (#31).
2.1 Climate niche modeling
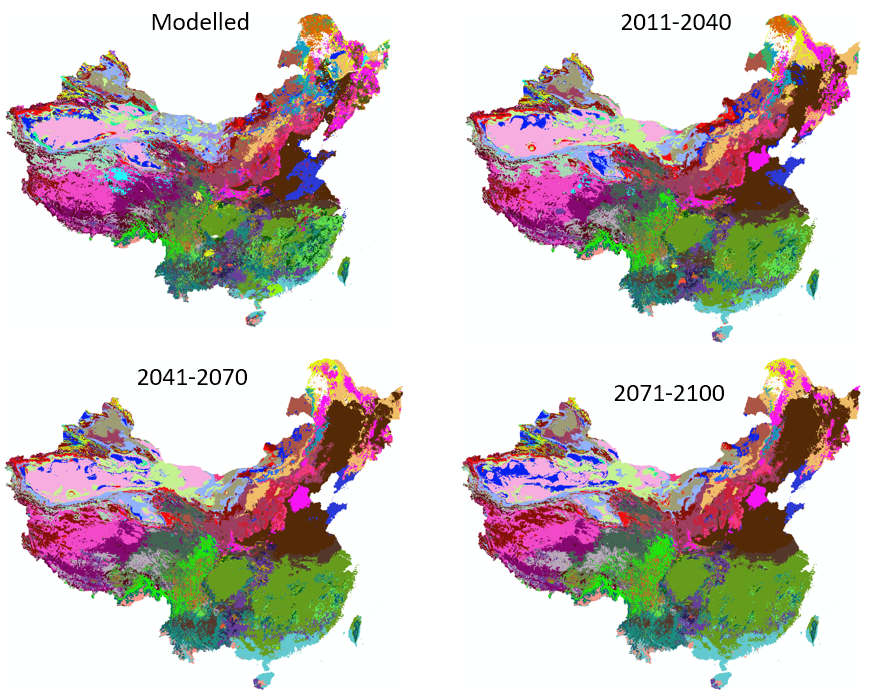
The climate niche model was developed using a machine-learning algorithm (Random Forest) based on the occurrence of the 56 ecotypes and the climate variables generated using ClimateAP. The vectors of the ecotype distribution map were rasterized into gridded pixels at the spatial resolution of 800 x 800 meters. ClimateAP was then used to generate annual and seasonal climate variables (69 in total) for each of the pixels for the reference period 1961-1990. The ecotype of each pixel was used as the dependent variable and the 69 climate variables of the same pixel were used as the independent variables to develop the climate niche model. The climate niches of the 56 ecotypes predicted by the model (Figure 10a) matched well with the original ones shown in Figure 9.
2.2 Future projections
The consensus projections for the forest ecosystem in China is shown in Figure 10. These maps have also been uploaded to our web platform for easy spatial visualization. We found a trend of northward shifting in general. However, some ecotypes are projected to expand substantially, including the “multiple ripes grain fields and deciduous orchards” (#27, dark brown) in Mideast China, and the “multiple ripes grain fields and evergreen orchards and subtropical economic plantations” (#21, dark green) in the south. On the other hand, the areas of broadleaf deciduous forests in the temperate zone (#3, pink) would decline and shift northward. The areas of the broadleaf evergreen and deciduous scrubs in the subtropical and tropical zone (#44) would also decline and shift westward. Such shifts and expansion may have a dramatic impact on land use and forest resources management in the future.
2.3 Management for adaptation to climate change
Ecotypes represent plant communities and have their unique season-dependent management habits. The shifts of major ecotypes in China demonstrated the impact of climate change on macroclimate conditions and potentially the shifts of major vegetation communities. However, not like the BEC system in British Columbia, the ecotypes in China are not directly associated with individual tree species. Thus, to make the use of the ecosystem as a vehicle to manage individual species as groups, the association between the ecotypes and species occurrence need to be established. A matrix with ecotypes as rows and species as columns will serve such a purpose. With such matrix, the projections shown in Figure 10 can be easily translated into species distribution maps for the current and future periods.
The substantial expansions of multiple ripes grain fields favor agriculture if the newly climatically suitable areas are in cultivatable conditions. If these areas fall into mountains only suitable for silviculture, selecting suitable tree species for these areas will be a new challenge as the matrix mentioned above would not apply to these zones. If suitable species are selected, these areas may have a good potential for high productivity of forest products.

By Tongli Wang, Climate Modelling and Forest Applications is licensed under Creative Commons <CC BY-NC-ND 4.0> License
