Chapter 15 Thermodynamics
110 15.3 Introduction to the Second Law of Thermodynamics: Heat Engines and Their Efficiency
Summary
- State the expressions of the second law of thermodynamics.
- Calculate the efficiency and carbon dioxide emission of a coal-fired electricity plant, using second law characteristics.
- Describe and define the Otto cycle.
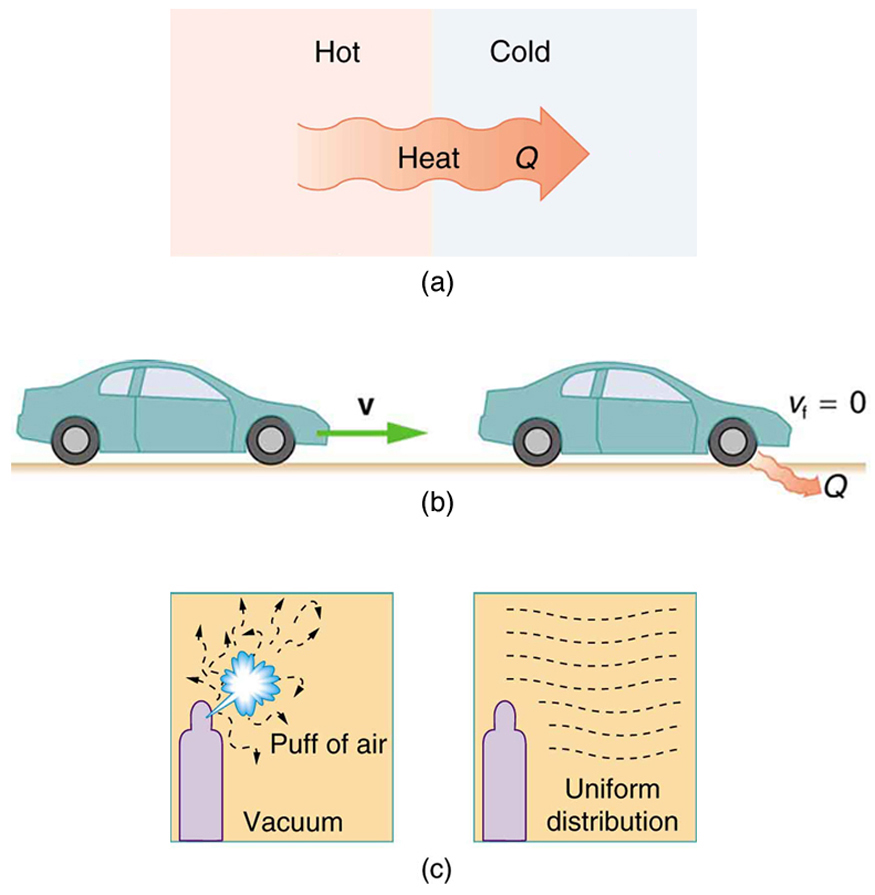
The second law of thermodynamics deals with the direction taken by spontaneous processes. Many processes occur spontaneously in one direction only—that is, they are irreversible, under a given set of conditions. Although irreversibility is seen in day-to-day life—a broken glass does not resume its original state, for instance—complete irreversibility is a statistical statement that cannot be seen during the lifetime of the universe. More precisely, an irreversible process is one that depends on path. If the process can go in only one direction, then the reverse path differs fundamentally and the process cannot be reversible. For example, as noted in the previous section, heat involves the transfer of energy from higher to lower temperature. A cold object in contact with a hot one never gets colder, transferring heat to the hot object and making it hotter. Furthermore, mechanical energy, such as kinetic energy, can be completely converted to thermal energy by friction, but the reverse is impossible. A hot stationary object never spontaneously cools off and starts moving. Yet another example is the expansion of a puff of gas introduced into one corner of a vacuum chamber. The gas expands to fill the chamber, but it never regroups in the corner. The random motion of the gas molecules could take them all back to the corner, but this is never observed to happen. (See Figure 2.)
The fact that certain processes never occur suggests that there is a law forbidding them to occur. The first law of thermodynamics would allow them to occur—none of those processes violate conservation of energy. The law that forbids these processes is called the second law of thermodynamics. We shall see that the second law can be stated in many ways that may seem different, but which in fact are equivalent. Like all natural laws, the second law of thermodynamics gives insights into nature, and its several statements imply that it is broadly applicable, fundamentally affecting many apparently disparate processes.
The already familiar direction of heat transfer from hot to cold is the basis of our first version of the second law of thermodynamics.
THE SECOND LAW OF THERMODYNAMICS (FIRST EXPRESSION)
Heat transfer occurs spontaneously from higher- to lower-temperature bodies but never spontaneously in the reverse direction.
Another way of stating this: It is impossible for any process to have as its sole result heat transfer from a cooler to a hotter object.
Heat Engines
Now let us consider a device that uses heat transfer to do work. As noted in the previous section, such a device is called a heat engine, and one is shown schematically in Figure 3(b). Gasoline and diesel engines, jet engines, and steam turbines are all heat engines that do work by using part of the heat transfer from some source. Heat transfer from the hot object (or hot reservoir) is denoted as[latex]\boldsymbol{Q_{\textbf{h}}},[/latex]while heat transfer into the cold object (or cold reservoir) is[latex]\boldsymbol{Q_{\textbf{c}}},[/latex]and the work done by the engine is[latex]\boldsymbol{W}.[/latex]The temperatures of the hot and cold reservoirs are[latex]\boldsymbol{T_{\textbf{h}}}[/latex]and[latex]\boldsymbol{T_{\textbf{c}}},[/latex]respectively.
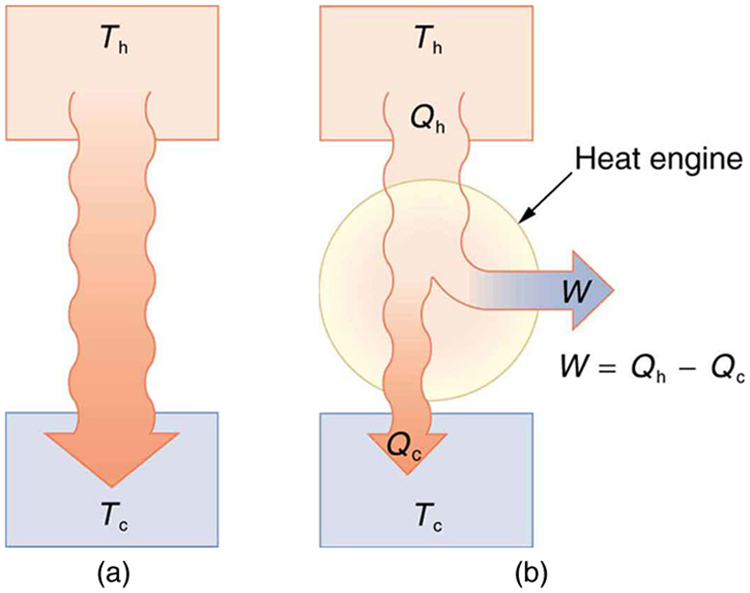
Because the hot reservoir is heated externally, which is energy intensive, it is important that the work is done as efficiently as possible. In fact, we would like[latex]\boldsymbol{W}[/latex]to equal[latex]\boldsymbol{Q_{\textbf{h}}},[/latex]and for there to be no heat transfer to the environment ([latex]\boldsymbol{Q_{\textbf{c}}=0}[/latex]). Unfortunately, this is impossible. The second law of thermodynamics also states, with regard to using heat transfer to do work (the second expression of the second law):
THE SECOND LAW OF THERMODYNAMICS (SECOND EXPRESSION)
It is impossible in any system for heat transfer from a reservoir to completely convert to work in a cyclical process in which the system returns to its initial state.
A cyclical process brings a system, such as the gas in a cylinder, back to its original state at the end of every cycle. Most heat engines, such as reciprocating piston engines and rotating turbines, use cyclical processes. The second law, just stated in its second form, clearly states that such engines cannot have perfect conversion of heat transfer into work done. Before going into the underlying reasons for the limits on converting heat transfer into work, we need to explore the relationships among[latex]\boldsymbol{W},\:\boldsymbol{Q_{\textbf{h}}},[/latex]and[latex]\boldsymbol{Q_{\textbf{c}}},[/latex]and to define the efficiency of a cyclical heat engine. As noted, a cyclical process brings the system back to its original condition at the end of every cycle. Such a system’s internal energy[latex]\boldsymbol{U}[/latex]is the same at the beginning and end of every cycle—that is,[latex]\boldsymbol{\Delta{U}=0}.[/latex]The first law of thermodynamics states that
where[latex]\boldsymbol{Q}[/latex]is the net heat transfer during the cycle ([latex]\boldsymbol{Q=Q_{\textbf{h}}-Q_{\textbf{c}}}[/latex]) and[latex]\boldsymbol{W}[/latex]is the net work done by the system. Since[latex]\boldsymbol{\Delta{U}=0}[/latex]for a complete cycle, we have
so that
Thus the net work done by the system equals the net heat transfer into the system, or
just as shown schematically in Figure 3(b). The problem is that in all processes, there is some heat transfer[latex]\boldsymbol{Q_{\textbf{c}}}[/latex]to the environment—and usually a very significant amount at that.
In the conversion of energy to work, we are always faced with the problem of getting less out than we put in. We define conversion efficiency[latex]\boldsymbol{Eff}[/latex]to be the ratio of useful work output to the energy input (or, in other words, the ratio of what we get to what we spend). In that spirit, we define the efficiency of a heat engine to be its net work output[latex]\boldsymbol{W}[/latex]divided by heat transfer to the engine[latex]\boldsymbol{Q_{\textbf{h}}};[/latex]that is,
Since[latex]\boldsymbol{W=Q_{\textbf{h}}-Q_{\textbf{c}}}[/latex]in a cyclical process, we can also express this as
making it clear that an efficiency of 1, or 100%, is possible only if there is no heat transfer to the environment ([latex]\boldsymbol{Q_{\textbf{c}}=0}[/latex]). Note that all[latex]\boldsymbol{Q}\text{s}[/latex]are positive. The direction of heat transfer is indicated by a plus or minus sign. For example,[latex]\boldsymbol{Q_{\textbf{c}}}[/latex]is out of the system and so is preceded by a minus sign.
Example 1: Daily Work Done by a Coal-Fire Power Station, Its Efficiency and Carbon Dioxide Emissions
A coal-fired power station is a huge heat engine. It uses heat transfer from burning coal to do work to turn turbines, which are used to generate electricity. In a single day, a large coal power station has[latex]\boldsymbol{2.50\times10^{14}\textbf{ J}}[/latex]of heat transfer from coal and[latex]\boldsymbol{1.48\times10^{14}\textbf{ J}}[/latex]of heat transfer into the environment. (a) What is the work done by the power station? (b) What is the efficiency of the power station? (c) In the combustion process, the following chemical reaction occurs:[latex]\boldsymbol{\textbf{C}+\textbf{O}_2\rightarrow\textbf{CO}^2}[/latex]This implies that every 12 kg of coal puts 12 kg + 16 kg + 16 kg = 44 kg of carbon dioxide into the atmosphere. Assuming that 1 kg of coal can provide[latex]\boldsymbol{2.5\times10^6\textbf{ J}}[/latex]of heat transfer upon combustion, how much[latex]\boldsymbol{\textbf{CO}_2}[/latex]is emitted per day by this power plant?
Strategy for (a)
We can use[latex]\boldsymbol{W=Q_{\textbf{h}}-Q_{\textbf{c}}}[/latex]to find the work output[latex]\boldsymbol{W},[/latex]assuming a cyclical process is used in the power station. In this process, water is boiled under pressure to form high-temperature steam, which is used to run steam turbine-generators, and then condensed back to water to start the cycle again.
Solution for (a)
Work output is given by:
Substituting the given values:
Strategy for (b)
The efficiency can be calculated with[latex]\boldsymbol{Eff=\frac{W}{Q_{\textbf{h}}}}[/latex]since[latex]\boldsymbol{Q_{\textbf{h}}}[/latex]is given and work[latex]\boldsymbol{W}[/latex]was found in the first part of this example.
Solution for (b)
Efficiency is given by:[latex]\boldsymbol{Eff=\frac{W}{Q_{\textbf{h}}}}.[/latex]The work[latex]\boldsymbol{W}[/latex]was just found to be[latex]\boldsymbol{1.02\times10^{14}\textbf{ J}},[/latex]and[latex]\boldsymbol{Q_{\textbf{h}}}[/latex]is given, so the efficiency is
Strategy for (c)
The daily consumption of coal is calculated using the information that each day there is[latex]\boldsymbol{2.50\times10^{14}\textbf{ J}}[/latex]of heat transfer from coal. In the combustion process, we have[latex]\boldsymbol{\textbf{C}+\textbf{O}_2\rightarrow\textbf{CO}_2}.[/latex]So every 12 kg of coal puts 12 kg + 16 kg + 16 kg = 44 kg of[latex]\boldsymbol{\textbf{CO}_2}[/latex]into the atmosphere.
Solution for (c)
The daily coal consumption is
Assuming that the coal is pure and that all the coal goes toward producing carbon dioxide, the carbon dioxide produced per day is
This is 370,000 metric tons of[latex]\boldsymbol{\textbf{CO}_2}[/latex]produced every day.
Discussion
If all the work output is converted to electricity in a period of one day, the average power output is 1180 MW (this is left to you as an end-of-chapter problem). This value is about the size of a large-scale conventional power plant. The efficiency found is acceptably close to the value of 42% given for coal power stations. It means that fully 59.2% of the energy is heat transfer to the environment, which usually results in warming lakes, rivers, or the ocean near the power station, and is implicated in a warming planet generally. While the laws of thermodynamics limit the efficiency of such plants—including plants fired by nuclear fuel, oil, and natural gas—the heat transfer to the environment could be, and sometimes is, used for heating homes or for industrial processes. The generally low cost of energy has not made it economical to make better use of the waste heat transfer from most heat engines. Coal-fired power plants produce the greatest amount of[latex]\boldsymbol{\textbf{CO}_2}[/latex]per unit energy output (compared to natural gas or oil), making coal the least efficient fossil fuel.
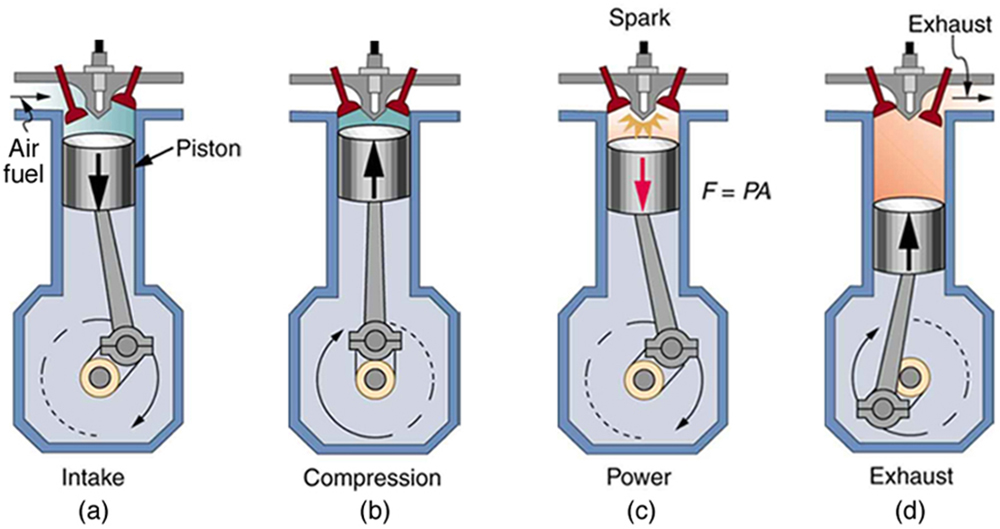
With the information given in Example 1, we can find characteristics such as the efficiency of a heat engine without any knowledge of how the heat engine operates, but looking further into the mechanism of the engine will give us greater insight. Figure 4 illustrates the operation of the common four-stroke gasoline engine. The four steps shown complete this heat engine’s cycle, bringing the gasoline-air mixture back to its original condition.
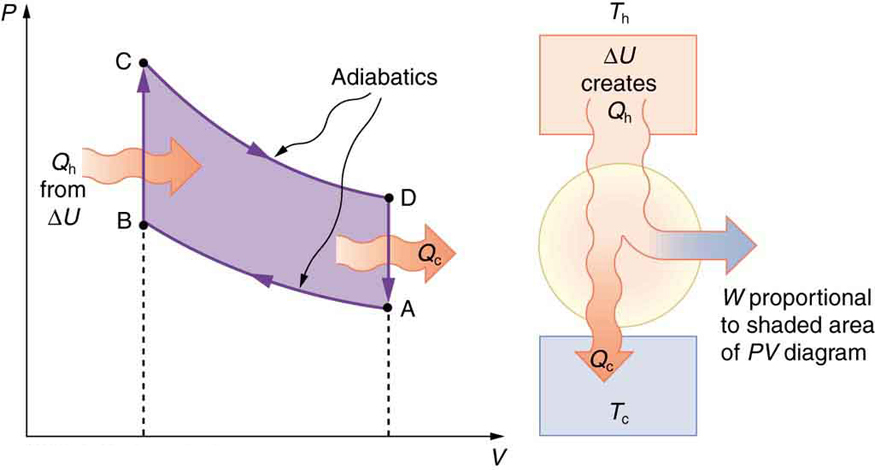
The Otto cycle shown in Figure 5(a) is used in four-stroke internal combustion engines, although in fact the true Otto cycle paths do not correspond exactly to the strokes of the engine.
The adiabatic process AB corresponds to the nearly adiabatic compression stroke of the gasoline engine. In both cases, work is done on the system (the gas mixture in the cylinder), increasing its temperature and pressure. Along path BC of the Otto cycle, heat transfer[latex]\boldsymbol{Q_{\textbf{h}}}[/latex]into the gas occurs at constant volume, causing a further increase in pressure and temperature. This process corresponds to burning fuel in an internal combustion engine, and takes place so rapidly that the volume is nearly constant. Path CD in the Otto cycle is an adiabatic expansion that does work on the outside world, just as the power stroke of an internal combustion engine does in its nearly adiabatic expansion. The work done by the system along path CD is greater than the work done on the system along path AB, because the pressure is greater, and so there is a net work output. Along path DA in the Otto cycle, heat transfer[latex]\boldsymbol{Q_{\textbf{c}}}[/latex]from the gas at constant volume reduces its temperature and pressure, returning it to its original state. In an internal combustion engine, this process corresponds to the exhaust of hot gases and the intake of an air-gasoline mixture at a considerably lower temperature. In both cases, heat transfer into the environment occurs along this final path.
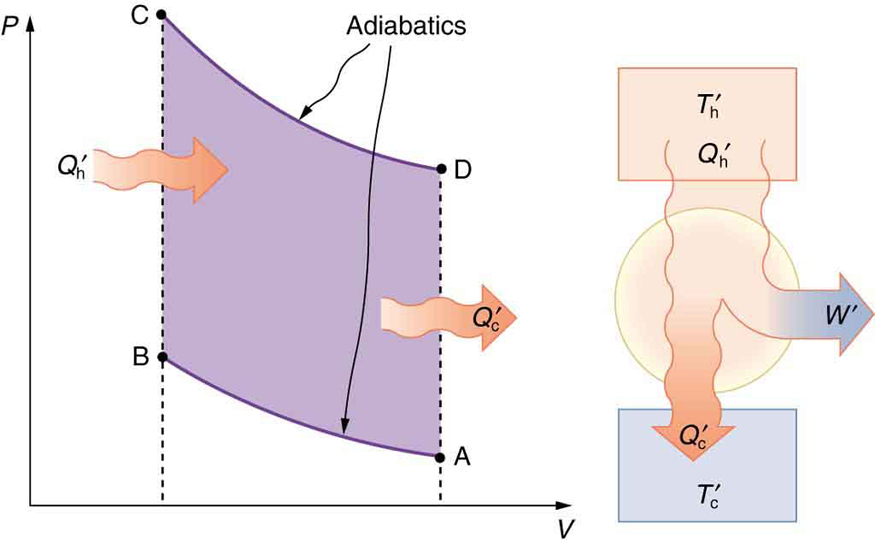
The net work done by a cyclical process is the area inside the closed path on a[latex]\boldsymbol{PV}[/latex]diagram, such as that inside path ABCDA in Figure 5. Note that in every imaginable cyclical process, it is absolutely necessary for heat transfer from the system to occur in order to get a net work output. In the Otto cycle, heat transfer occurs along path DA. If no heat transfer occurs, then the return path is the same, and the net work output is zero. The lower the temperature on the path AB, the less work has to be done to compress the gas. The area inside the closed path is then greater, and so the engine does more work and is thus more efficient. Similarly, the higher the temperature along path CD, the more work output there is. (See Figure 6.) So efficiency is related to the temperatures of the hot and cold reservoirs. In the next section, we shall see what the absolute limit to the efficiency of a heat engine is, and how it is related to temperature.
Section Summary
- The two expressions of the second law of thermodynamics are: (i) Heat transfer occurs spontaneously from higher- to lower-temperature bodies but never spontaneously in the reverse direction; and (ii) It is impossible in any system for heat transfer from a reservoir to completely convert to work in a cyclical process in which the system returns to its initial state.
- Irreversible processes depend on path and do not return to their original state. Cyclical processes are processes that return to their original state at the end of every cycle.
- In a cyclical process, such as a heat engine, the net work done by the system equals the net heat transfer into the system, or[latex]\boldsymbol{W=Q_{\textbf{h}}-Q_{\textbf{c}}},[/latex]where[latex]\boldsymbol{Q_{\textbf{h}}}[/latex]is the heat transfer from the hot object (hot reservoir), and[latex]\boldsymbol{Q_{\textbf{c}}}[/latex]is the heat transfer into the cold object (cold reservoir).
- Efficiency can be expressed as[latex]\boldsymbol{Eff=\frac{W}{Q_{\textbf{h}}}},[/latex]the ratio of work output divided by the amount of energy input.
- The four-stroke gasoline engine is often explained in terms of the Otto cycle, which is a repeating sequence of processes that convert heat into work.
Conceptual Questions
1: Imagine you are driving a car up Pike’s Peak in Colorado. To raise a car weighing 1000 kilograms a distance of 100 meters would require about a million joules. You could raise a car 12.5 kilometers with the energy in a gallon of gas. Driving up Pike's Peak (a mere 3000-meter climb) should consume a little less than a quart of gas. But other considerations have to be taken into account. Explain, in terms of efficiency, what factors may keep you from realizing your ideal energy use on this trip.
2: Is a temperature difference necessary to operate a heat engine? State why or why not.
3: Definitions of efficiency vary depending on how energy is being converted. Compare the definitions of efficiency for the human body and heat engines. How does the definition of efficiency in each relate to the type of energy being converted into doing work?
4: Why—other than the fact that the second law of thermodynamics says reversible engines are the most efficient—should heat engines employing reversible processes be more efficient than those employing irreversible processes? Consider that dissipative mechanisms are one cause of irreversibility.
Problems & Exercises
1: A certain heat engine does 10.0 kJ of work and 8.50 kJ of heat transfer occurs to the environment in a cyclical process. (a) What was the heat transfer into this engine? (b) What was the engine’s efficiency?
2: With[latex]\boldsymbol{2.56\times10^6\textbf{ J}}[/latex]of heat transfer into this engine, a given cyclical heat engine can do only[latex]\boldsymbol{1.50\times10^5\textbf{ J}}[/latex]of work. (a) What is the engine’s efficiency? (b) How much heat transfer to the environment takes place?
3: (a) What is the work output of a cyclical heat engine having a 22.0% efficiency and[latex]\boldsymbol{6.00\times10^9\textbf{ J}}[/latex]of heat transfer into the engine? (b) How much heat transfer occurs to the environment?
4: (a) What is the efficiency of a cyclical heat engine in which 75.0 kJ of heat transfer occurs to the environment for every 95.0 kJ of heat transfer into the engine? (b) How much work does it produce for 100 kJ of heat transfer into the engine?
5: The engine of a large ship does[latex]\boldsymbol{2.00\times10^8\textbf{ J}}[/latex]of work with an efficiency of 5.00%. (a) How much heat transfer occurs to the environment? (b) How many barrels of fuel are consumed, if each barrel produces[latex]\boldsymbol{6.00\times10^9\textbf{ J}}[/latex]of heat transfer when burned?
6: (a) How much heat transfer occurs to the environment by an electrical power station that uses[latex]\boldsymbol{1.25\times10^{14}\textbf{ J}}[/latex]of heat transfer into the engine with an efficiency of 42.0%? (b) What is the ratio of heat transfer to the environment to work output? (c) How much work is done?
7: Assume that the turbines at a coal-powered power plant were upgraded, resulting in an improvement in efficiency of 3.32%. Assume that prior to the upgrade the power station had an efficiency of 36% and that the heat transfer into the engine in one day is still the same at[latex]\boldsymbol{2.50\times10^{14}\textbf{ J}}.[/latex](a) How much more electrical energy is produced due to the upgrade? (b) How much less heat transfer occurs to the environment due to the upgrade?
8: This problem compares the energy output and heat transfer to the environment by two different types of nuclear power stations—one with the normal efficiency of 34.0%, and another with an improved efficiency of 40.0%. Suppose both have the same heat transfer into the engine in one day,[latex]\boldsymbol{2.50\times10^{14}\textbf{ J}}.[/latex](a) How much more electrical energy is produced by the more efficient power station? (b) How much less heat transfer occurs to the environment by the more efficient power station? (One type of more efficient nuclear power station, the gas-cooled reactor, has not been reliable enough to be economically feasible in spite of its greater efficiency.)
Glossary
- irreversible process
- any process that depends on path direction
- second law of thermodynamics
- heat transfer flows from a hotter to a cooler object, never the reverse, and some heat energy in any process is lost to available work in a cyclical process
- cyclical process
- a process in which the path returns to its original state at the end of every cycle
- Otto cycle
- a thermodynamic cycle, consisting of a pair of adiabatic processes and a pair of isochoric processes, that converts heat into work, e.g., the four-stroke engine cycle of intake, compression, ignition, and exhaust
Solutions
Problems & Exercises
1:
(a)[latex]\boldsymbol{18.5\textbf{ kJ}}[/latex]
(b) 54.1%
3:
(a)[latex]\boldsymbol{1.32\times10^9\textbf{ J}}[/latex]
(b)[latex]\boldsymbol{4.68\times10^9\textbf{ J}}[/latex]
5:
(a)[latex]\boldsymbol{3.80\times10^9\textbf{ J}}[/latex]
(b) 0.667 barrels
7:
(a)[latex]\boldsymbol{8.30\times10^{12}\textbf{ J}},[/latex]which is 3.32% of[latex]\boldsymbol{2.50\times10^{14}\textbf{ J}}.[/latex]
(b)[latex]\boldsymbol{-8.30\times10^{12}\textbf{ J}},[/latex]where the negative sign indicates a reduction in heat transfer to the environment.
