Representing the intervention
6.6 Different visual representations of the intervention
One aspect that Mayne did not explicitly mention is the use of logic models to engage with diverse groups or local communities. A linear logic model can be very useful for identifying evaluation questions and structuring the evaluation project. However, it may also appear dry and technical to people outside the field of evaluation. Moreover, in certain contexts, its linear nature may lead to frustration by failing to represent the real complexity of a phenomenon. Depending on the context of the evaluation, the evaluator may want to explore building more complex, non-linear, or culturally responsive models that better align with the audience’s expectations and ways of thinking. When the logic model is used to communicate and engage with specific groups, the visual representation may need to be adapted. Below, we will present two contrasting approaches: system mapping, which is used to represent the complexity of an intervention and its many interconnections, and culturally significant visuals and metaphors designed to align with different cultural frameworks.
System mapping
One recurring criticism of causal and logic models is their linearity. This characteristic presents the advantage of creating a simple representation of the intervention and clarifying causal relationships. However, some argue that it oversimplifies the intervention and its interaction with the context. In a world where accounting for the intervention’s impacts is increasingly important, finding a way to represent the interaction of the intervention in its system is attractive. Penn and Barbrook-Johnson (n.d.) make suggestions on how to build system-based causal models and theories of change. They suggest building models based on the suggestions resulting from a brainstorm activity with approximately a dozen participants. The group should start identifying a focal point, brainstorm the elements contributing to it, consolidating and connecting the different factors, and checking the connections again. The process is less linear than the one suggested above for building the causal and logic models. It offers interesting engagement possibilities and representation avenues. “The maps are causal models of a system, represented by a network of factors and their causal relations. They are almost always annotated and layered with information about the factors and their connections” (Barbrook-Johnson & Penn, 2022, p. 62). Wilkinson and colleagues (2021) point to software resources available online to support different graphic representations. The use of system mapping is an interesting avenue for exploring the complexity of the intervention and the many influences at play. However, even with system mapping, a simplification of the map may still be needed.
Incorporating culturally significant visuals and metaphors
When building trust and developing a shared perspective on the intervention is the priority, adapting the visual representation of the logic model to the audience is important. Lambert et al. (2024) provide different illustrations of what logic models using metaphors and symbols could look like. Several models incorporate animals with symbolic significance or use circular rather than linear representations (see Figure 6.4). Values are also sometimes included in these figures.
Figure 6.4 The Kārearea Diagram Stemming from the Analysis of the Collaborative Group Process
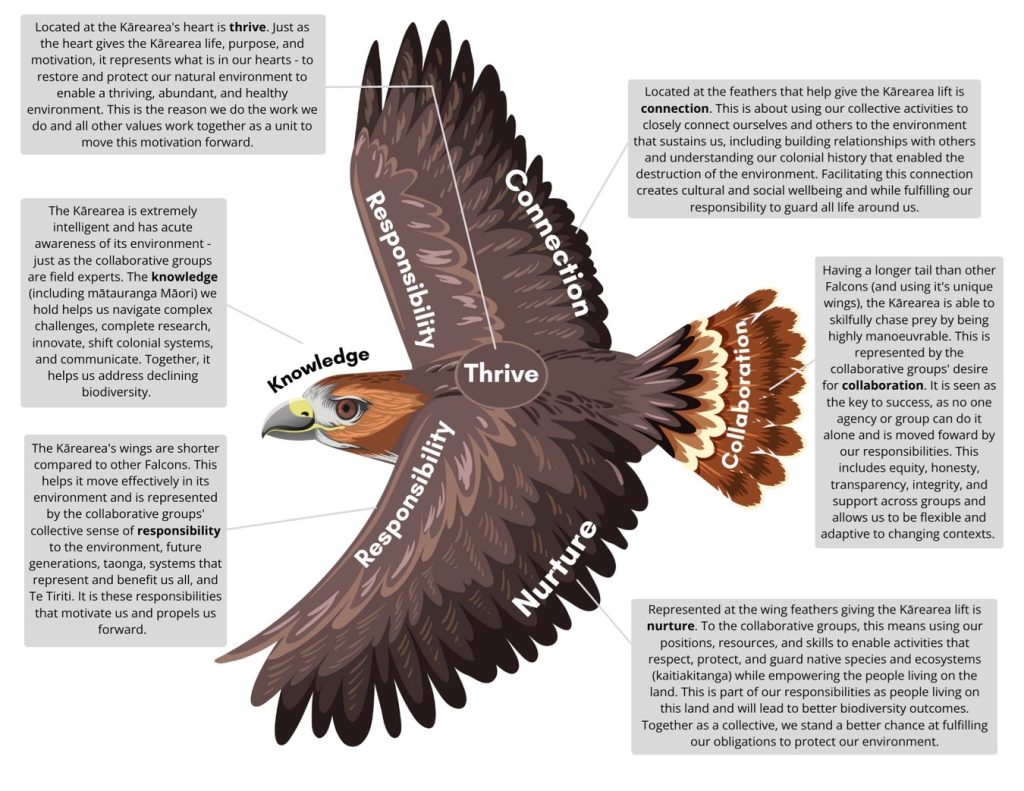
Deciding to engage in this direction involves several steps and commitments. This work cannot be led by someone external to the community without proper engagement. It requires respecting protocols, meeting with the community, listening to the people, and collaborating to identify a representation that aligns with their views of the intervention while remaining respectful of their culture. Many animals, for example, hold significant cultural meaning in Indigenous cultures, and symbols cannot be used without the community’s collective consent. The evaluator should also inquire about the responsibilities associated with using such symbols and ensure that shared agreements are made regarding how the symbol will be used and shared beyond the community. This co-creation process will likely be iterative, involving several rounds of discussion.
Media Attributions
- Figure 6.4 The Kārearea Diagram Stemming from the Analysis of the Collaborative Group Process
