15 Frequency domain identification
In control engineering, system identification can be performed either in time domain or frequency domain where the input-output properties of the system are explicitly modeled with a dimensional parameter vector. In frequency domain methods, it is easier to have information such as frequency resolution and the bandwidth included. The frequency domain identification techniques are suitable for simulating a system and to predict its upcoming outputs. Moreover, the results obtained from frequency domain techniques are interpreted more easily.
Frequency domain techniques exploit the structure of LTI systems, and are therefore conceptually simpler. There are two most useful techniques for system identification using frequency domain:
- Identifying a system based on its impulse response
- Identification using sinusoidal inputs
In this lab, we use the second approach to identify a black box system as shown in Figure 8.1.
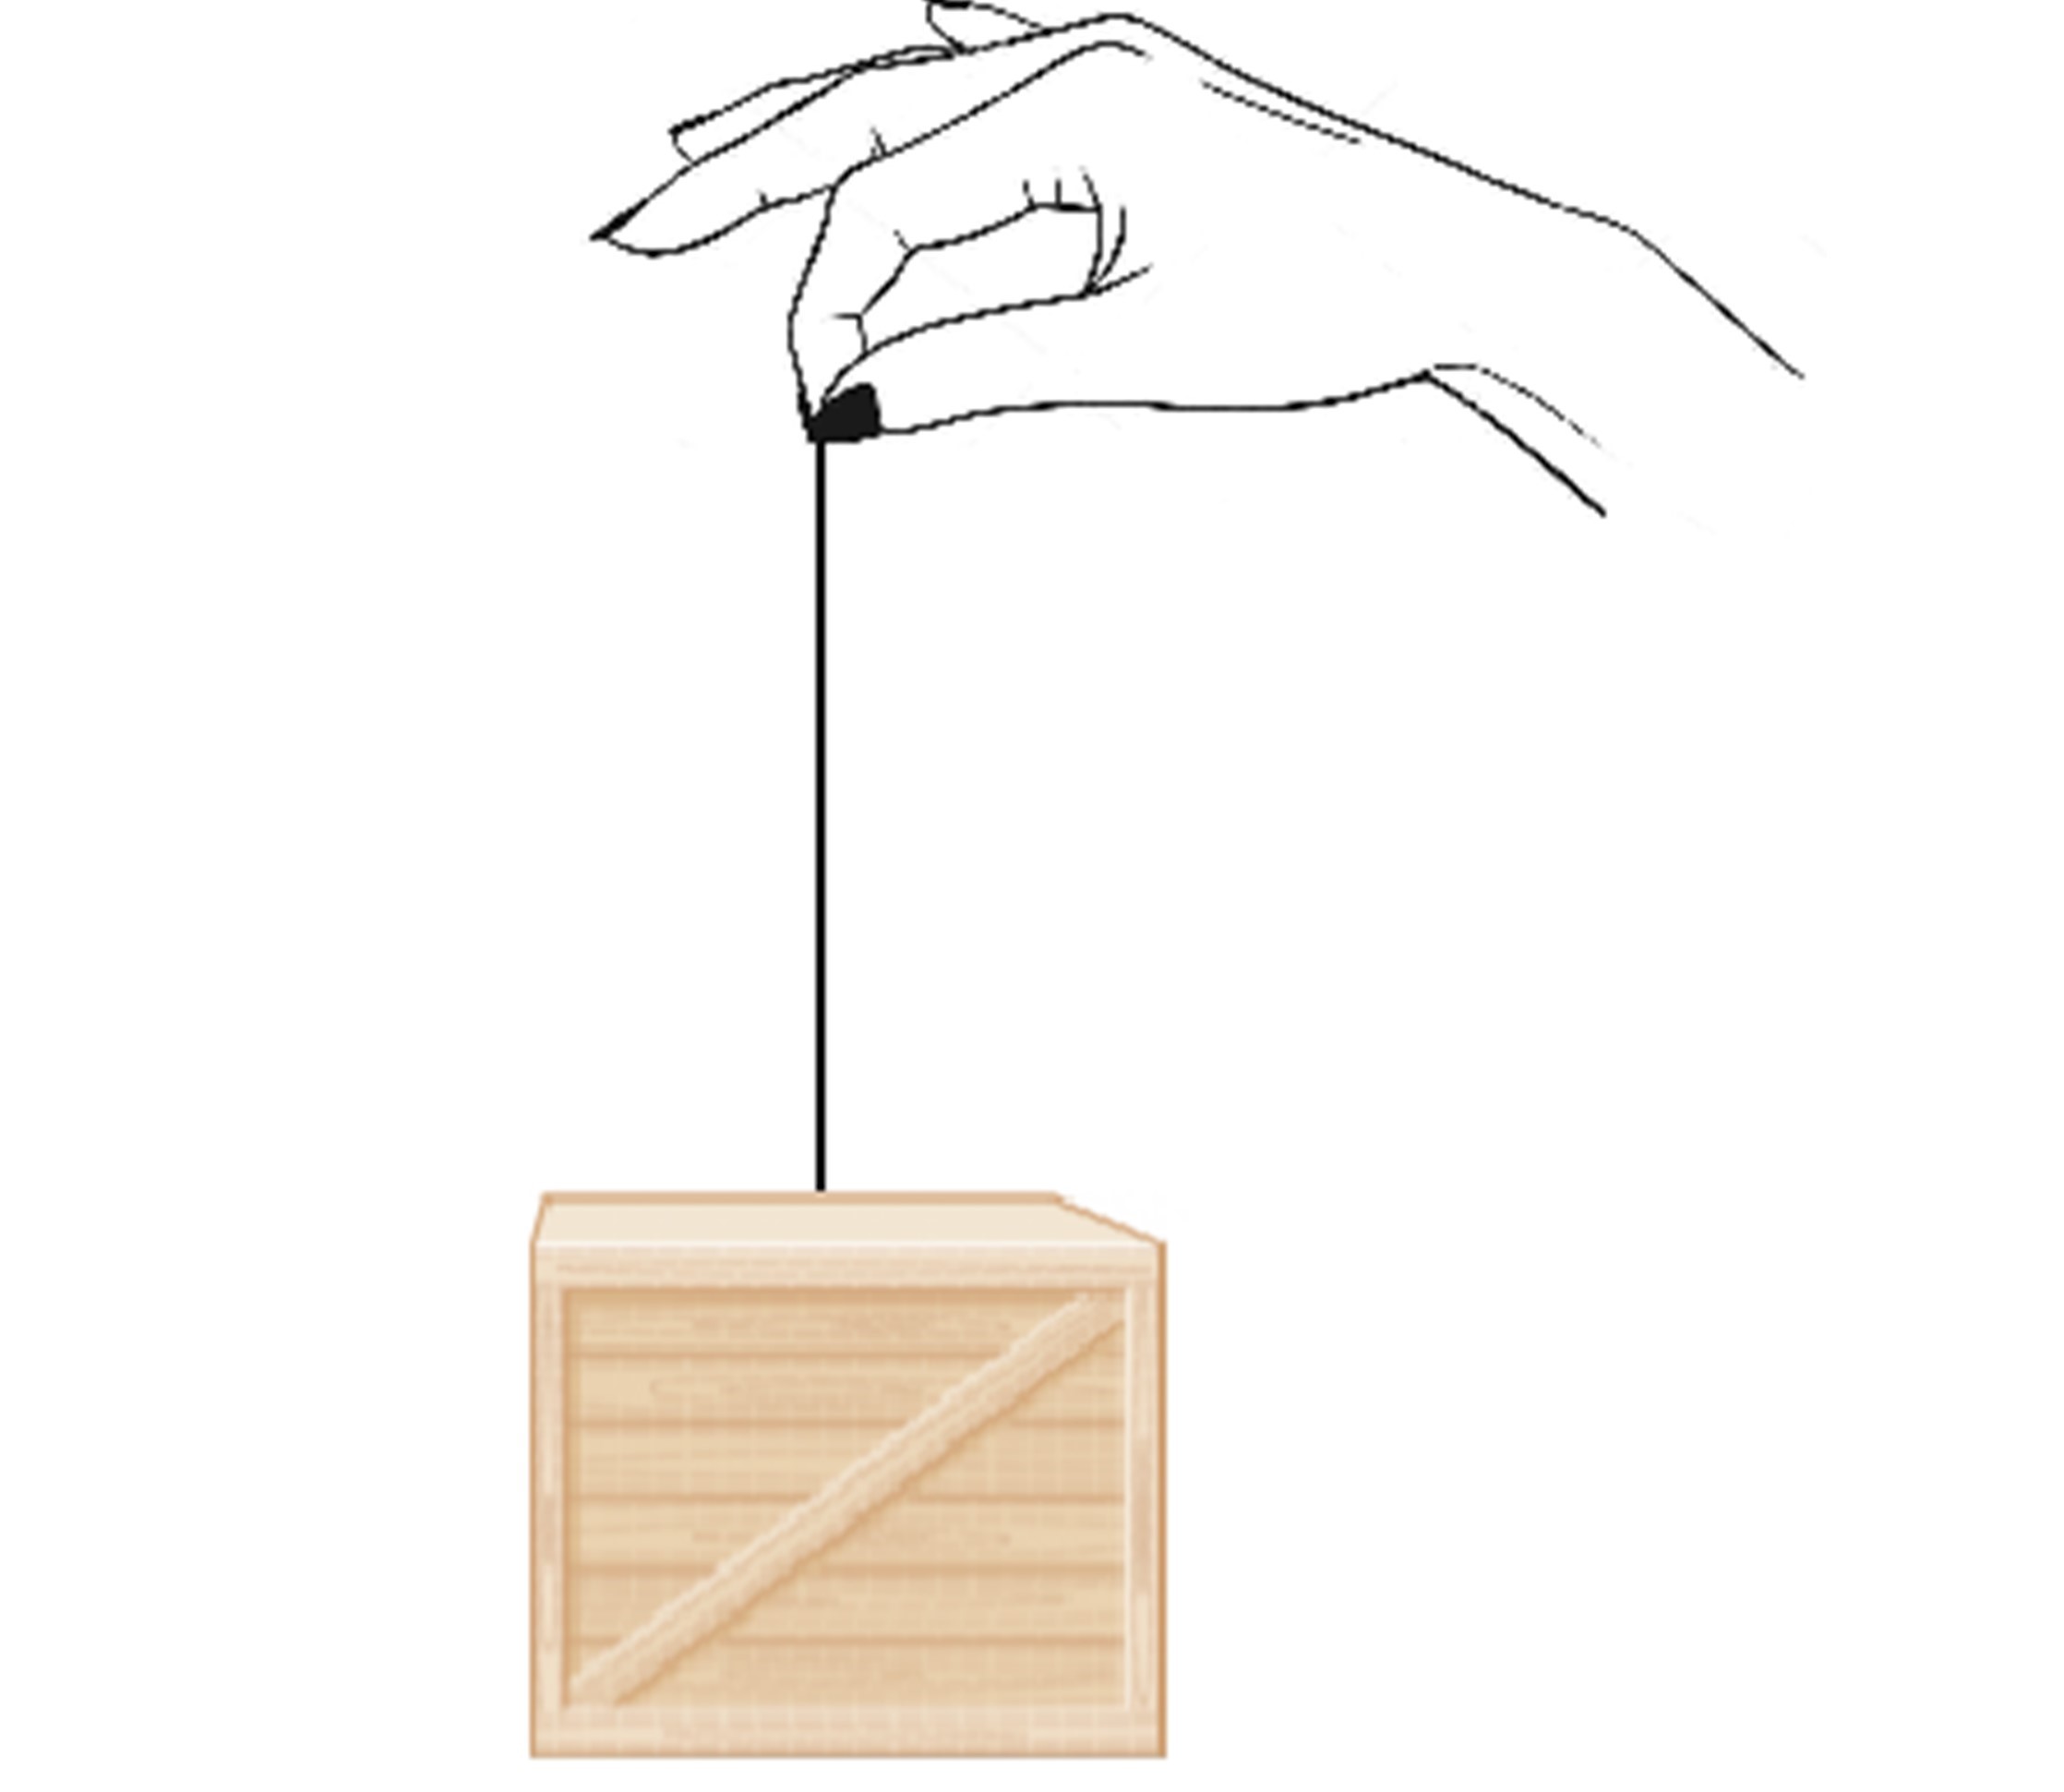
The system consists of a box that hangs from an elastic band. The input is a sinusoidal wave that is applied by moving hand vertically, to the top point of the elastic band and the output is the distance between bottom of the box and the surface. The amplitude and the frequency (or period) of the input sinusoidal wave is adjustable.
Objectives
The following objectives will be covered as you go through the experiment procedure.
- Identify the black box system using frequency domain approach
- Apply different inputs to the black box system and get the corresponding outputs
- Draw the bode diagram using input-output data
- Extract the system transfer function using bode diagram
Procedure
1. Generate a sinusoid input with the desired frequency and amplitude. Then, apply it to the system.
a) What is the corresponding output?
b) Apply more inputs with different amplitudes to the system. How does the input amplitude affect the output?
c) Now, apply inputs with same amplitude and different frequencies. How does the input frequency affect the output?
2. Apply new inputs with a long range of frequencies to the system and record the input-output data.
a) At which frequencies does the maximum gain of the output occur?
b) At what frequencies is the oscillation not transmitted to the box?
c) Draw the bode diagram of the black box system.
3. Based on the bode diagram, estimate the transfer function of the system. Do you think your data is sufficient to acquire the transfer function of the system? If not, repeat Step 2 to get sufficient input-output data.
a) What is the location of zeros and poles?
b) Apply an arbitrary input to the system and to the transfer function you acquired. Are the outputs identical?
c) If you have different outputs, explain the reason.
4. Repeat the experiment with different input data. Then, compare the transfer functions you acquired. Explain the differences.
