Chapter 8. Geological Structures, Part B: Folds, Faults, and Unconformities
Lab 9 Activity
Overview
In this lab you will practice interpreting more complex geological structures generated by folding, faulting, and erosion.
A. Structure of Bathurst Island, Nunavut, Canada
Using Google Earth, navigate to the location 75°50’18.91″N 101°18’55.83″W. (Click here to go there now.) This is a view of part of Bathurst Island, Nunavut, Canada. Zoom out to about 75 km altitude (45 miles). Note that the landscape is fairly flat in this region; there is only about 400 m of relief (elevations are between 0 m and 400 m). Refer to Figure 8.19 along with Google Earth to answer the following questions.
a) Describe the patterns formed by the layers of rock exposed in this image. What do these patterns tell you about the geologic structure(s) formed by the rocks in this area?
b) Note the relative ages of the rocks presented in Figure 8.19. Given this information, what kind of structure do you think is found in the red boxed area of the satellite image? Hint: Note the light-coloured layers in the satellite image running diagonally through the box.
c) Sketch a rough cross-section of your interpretation of the geology in Figure 8.19, between points X and Y (X-Y).
d) Are data missing from the map that would help you improve the accuracy of your interpretation? If so, what data would help you to understand the geology better?
B. Block Diagrams
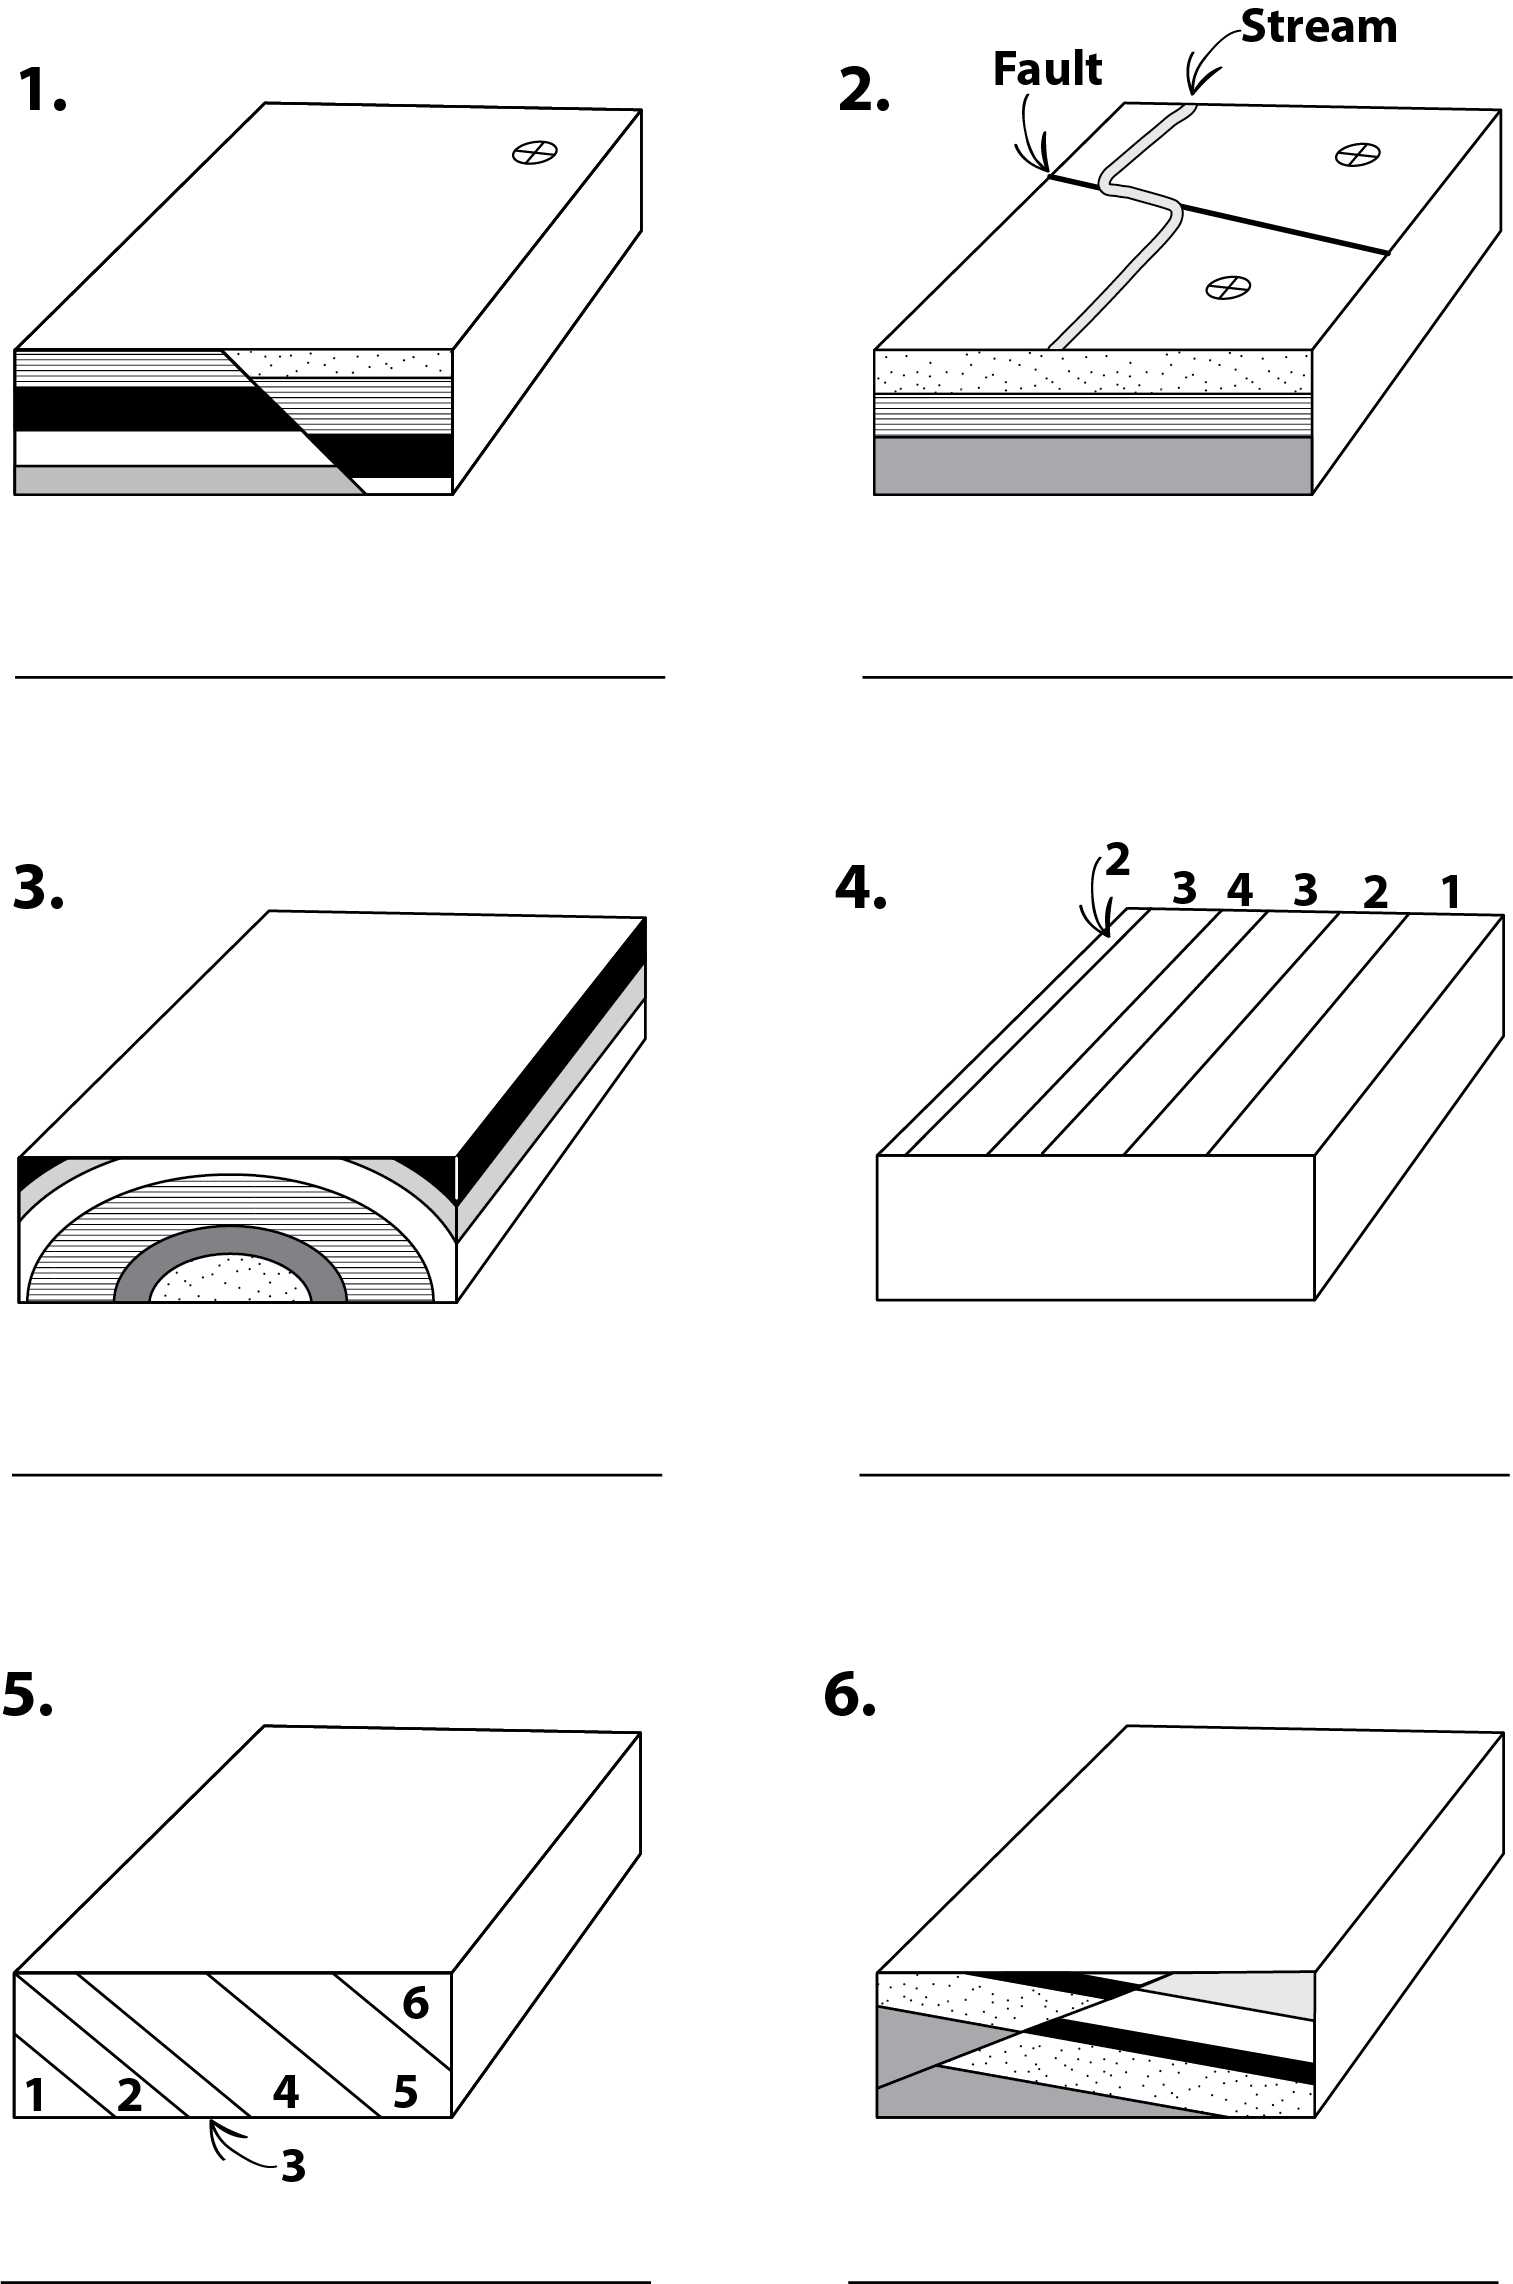
In the diagrams shown in Figure 8.20, numerical labels on beds indicate the relative ages of the beds, with 1 being the oldest and 6 the youngest. Complete the block diagrams by doing the tasks listed below. Assume that the geologic units have not been overturned (flipped upside down).
a) Draw the geological contacts as they would appear on the blank surfaces.
b) Add strike and dip symbols as well as symbols documenting any other geological features. Include the direction of motion for any faults.
c) Write the name of the structure in the blank beneath each diagram.
C. Drawing Cross-Sections of the Folds, Faults, and Unconformities of the Wavy Wastelands
For this exercise you will use the map of the Wavy Wastelands (Figure 8.21). Remember that the rocks in the legend are not in the correct order. You will have to re-arrange them as part of the exercise.
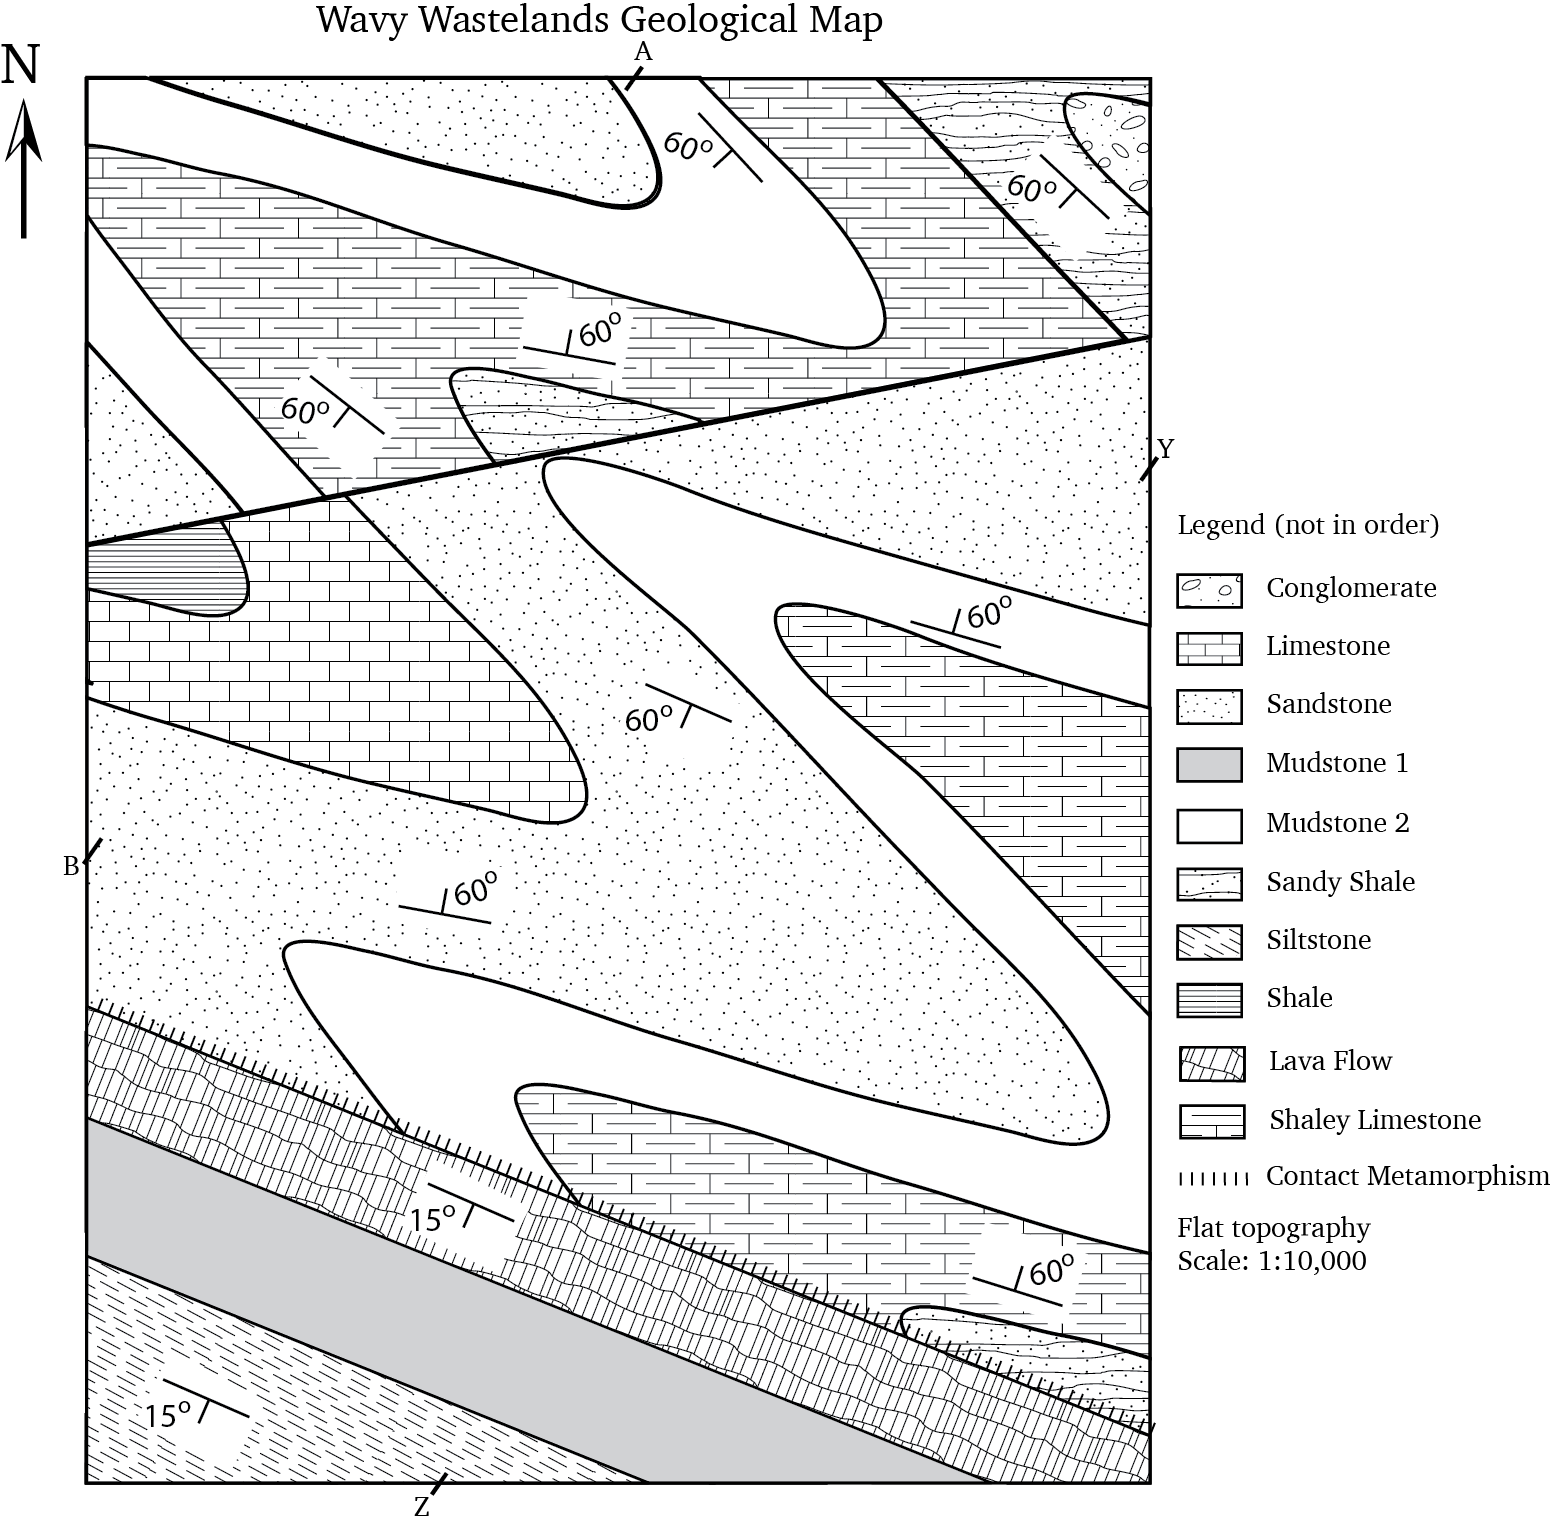
a) What kinds of rocks are found in this map area (sedimentary, igneous, and/or metamorphic)? How many units can you see?
b) Note the strike and dip symbols on the map. Which direction are the units striking and dipping? Do the strike and dip of the beds change at all as you move across the map area?
c) There is a major unconformity in the map area. What kind of unconformity is it? Outline the trace of the unconformity in red on your map.
d) Draw fold axial traces on the map for the folds in the map area. (There are six.) Indicate whether the folds are anticlines or synclines by putting the appropriate symbols on the map for each fold. Note that all the folds are plunging in the same direction.
e) Make a list of formations from oldest to youngest. Which geologic laws/principles did you use to prepare your list?
f) There is a fault in the map area. Which side of the fault went up relative to the other side? Mark this on your map. Hint: Which side has older beds? Use the folds to help you figure out the relative ages of the beds.
g) The fault is a reverse fault. In what direction does the fault plane dip? ___________ Hint: The fault plane always dips toward the hanging wall. In a reverse fault, how does the hanging wall move relative to the footwall?
h) Note the scale of the map. What is the distance in metres between point Y and point Z? What is the distance in metres between point A and point B?
X to Y distance: __________ A to B distance: __________
i) Prepare a cross-section through the map from position Y to Z (Y-Z).
j) Prepare a cross-section through the map from position A to B (A-B). Draw the fault with a dip angle of 45°.
k) In point form, describe the geological history of the map area.
Attributions
Adapted from:
McBeth, J., Panchuk, K., Prokopiuk, T., Hauber, L., & Lacey, S. (2020). Introductory Physical Geology Laboratory Manual, 1st Canadian Ed., Exercises on Geological Structures Part 2: Folds, Faults, and Unconformities by K. Panchuk, J. McBeth, & L. R. Hauber. CC BY-SA 4.0
Deline, B., Harris. R. & Tefend, K. (2015) Laboratory Manual for Introductory Geology, 1st Edition, Chapter 12. “Crustal Deformation” by R. Harris & B. Deline. CC BY-SA 4.0
