Chapter 2. Plate Tectonics
Lab 3 Activity
Lab 3 Activity: Using Data to Investigate Plate Boundary Properties
Overview
In this lab you will use a variety of maps and data sets to help you understand how we know where plate boundaries are on Earth, and how we know what types of boundaries are present.
A. Spreading Rates: How Fast Is the Atlantic Ocean Getting Wider?
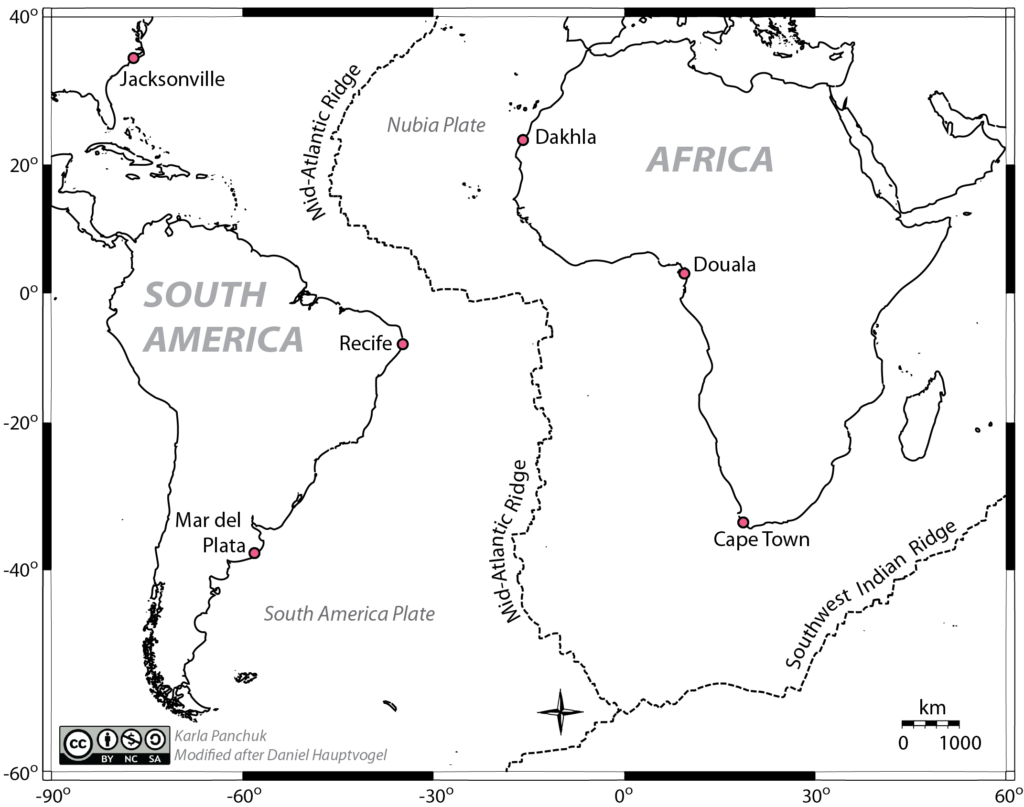
The spreading rate of a mid-ocean ridge refers to how quickly it gets wider. This is usually expressed in units of cm per year. For this exercise you will use the maps in Figure 2.5, 2.6, and 2.7 to make quantitative and qualitative observations about the spreading rate along the Mid-Atlantic Ridge.
How to Use Figures 2.6 and 2.7
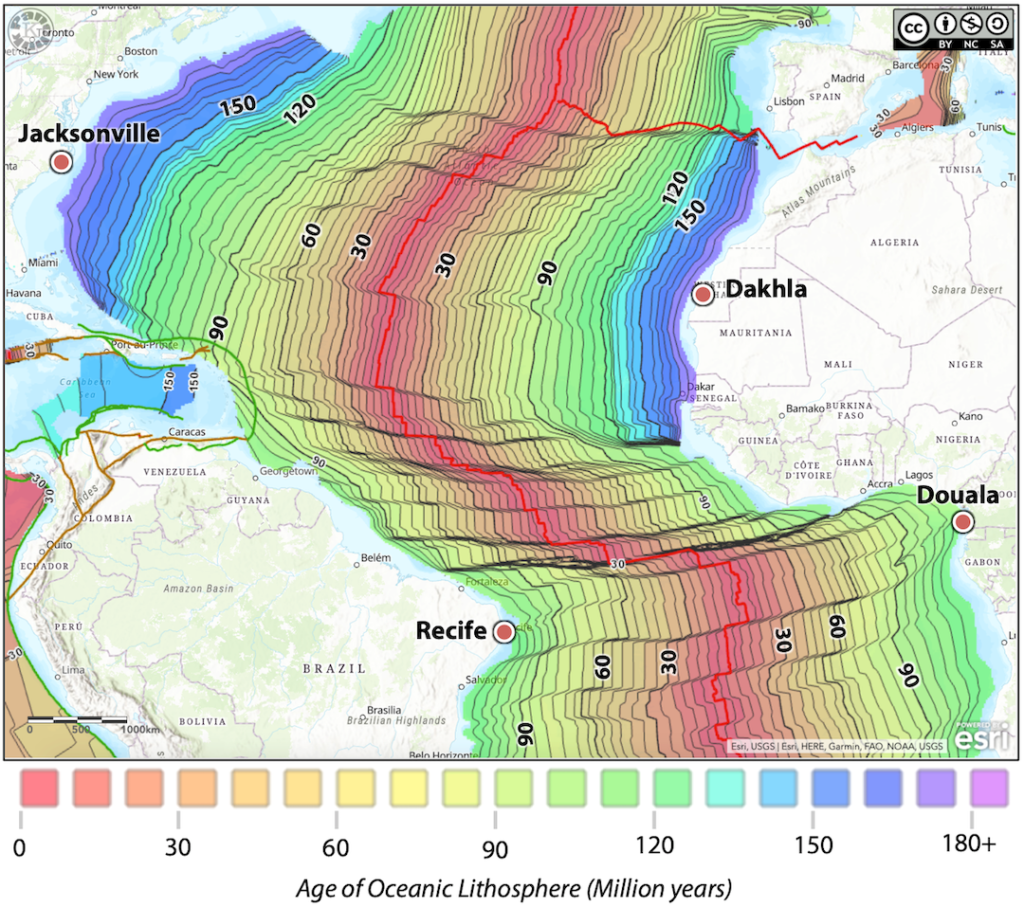
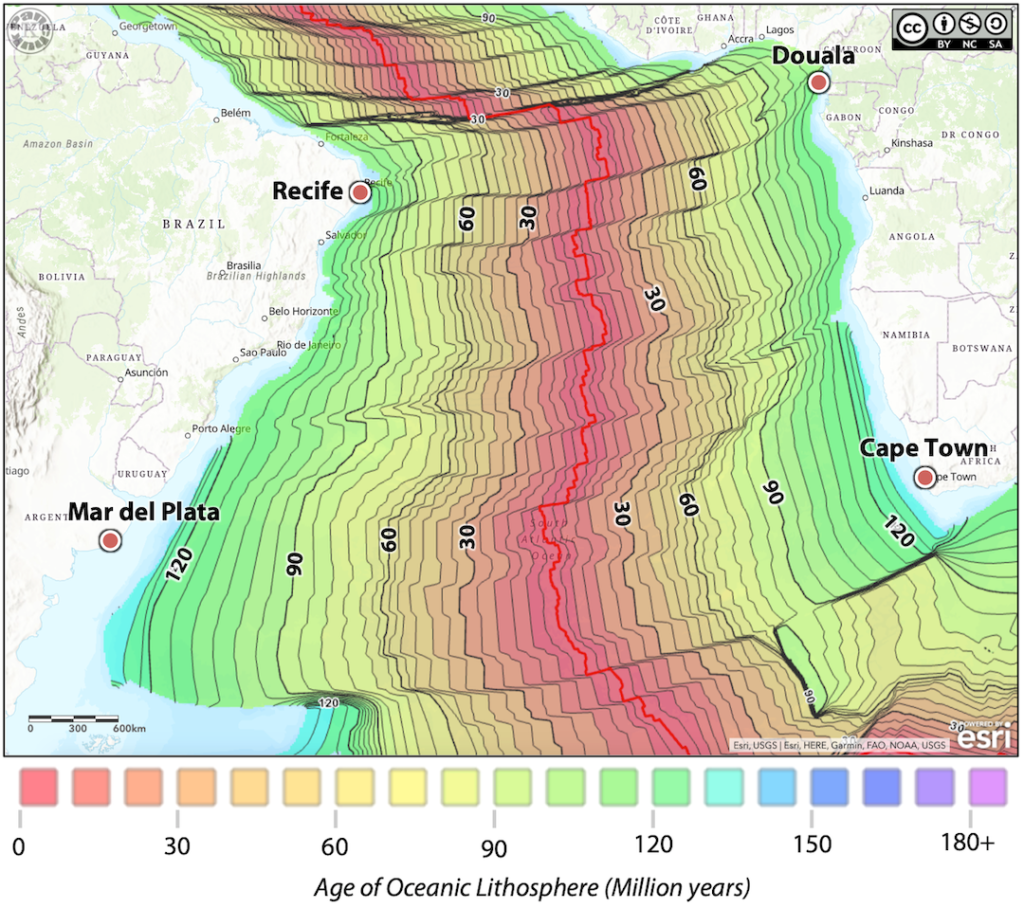
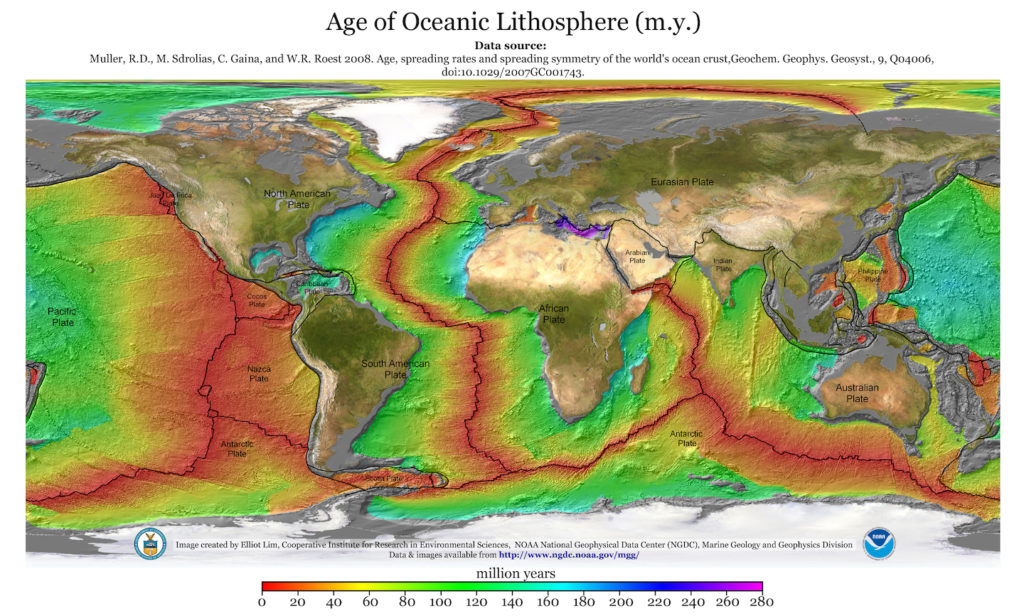
Figures 2.6 and 2.7 show the age of the ocean floor (i.e., how long ago a particular region of ocean crust formed at the Mid-Atlantic Ridge before being pushed to either side). They are colour coded, but also include age contour lines (black) in 5 million year increments. Every 30 million years is marked with a heavier black line. You can use the colours to tell the age, or you can use the age contours. If you’re not sure which age to use for the questions that follow, go with the age represented by the nearest contour line. You can also use the spacing of the age contours (the width of the colour bands) to compare the rate of spreading from one area to the next. The more rapidly crust formed during an interval, the wider that age band will be. If crust formed more slowly, the age band for that interval will be narrower.
A.1. Spreading rate of the Mid-Atlantic Ridge between Recife and Douala
a) On the print version of Figure 2.5 in your lab handout, use a ruler to draw a line between Recife and Douala. Measure the length of the line, then use the scale at the bottom of the map to determine the distance in km.
Measured distance: ____________ cm
Map distance: ____________ km Hint: How many cm is 1000 km on the map scale?
Map distance converted to cm (you need this for the calculation): _____________ cm Remember: there are 1000 m in every km, and 100 cm in every m.
b) How long has the Atlantic Ocean been spreading between Recife and Douala? Hint: In Figure 2.B, how old is the oldest ocean crust between Recife and Douala?
Spreading started ____________________________ years ago.
c) Calculate the spreading rate using the formula below, and show your work. Remember that the rate should be in units of cm/year.

A.2. Why is the Atlantic Ocean different widths at different locations?
The distance between Recife and Douala is short enough that you can use a straight line to measure between them without having to worry about the curvature of the Earth introducing too much of an error. At other locations, the Atlantic Ocean is too wide to do this without considering Earth’s curvature. Fortunately we can use Figures 2.4 and 2.5 to draw some qualitative conclusions to help understand spreading rates in the Atlantic Ocean.
a) Examine the age contours between Jacksonville and Dakhla (Figure 2.6). Does a higher spreading rate explain why the Atlantic Ocean is wider between these points? Explain your answer.
b) Examine the age contours between Mar del Plata and Cape Town (Figure 2.7). Does a higher spreading rate explain why the Atlantic Ocean is wider between these points? Explain your answer.
B. Relative Plate Motions
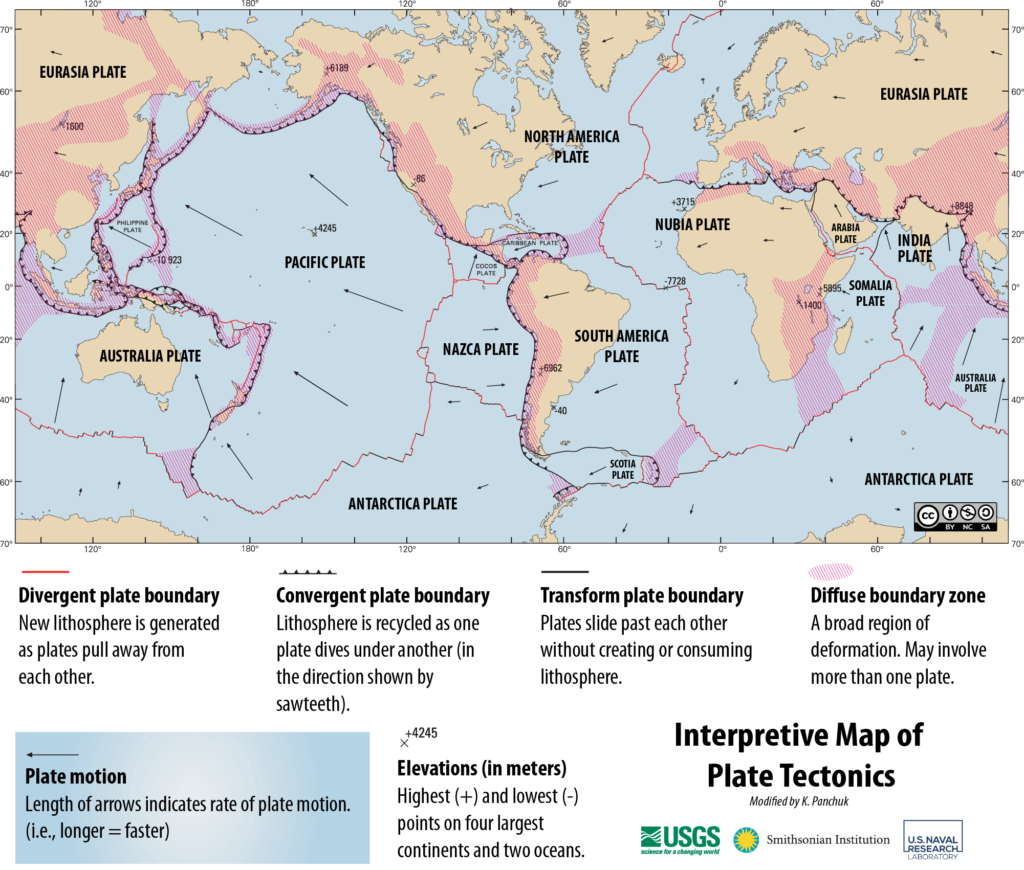
Plate motions—both their direction and their velocity—can be measured using GPS data. A convenient way to present that information is a map like Figure 2.8 with arrows that show the directions plates are moving, and with sizes that are scaled to permit a comparison of plate velocities. In other words, the larger the arrow in Figure 2.8, the faster the plate is moving.
The different types of boundaries in Figure 2.3 are all illustrated with arrows moving in opposite directions, whether colliding (convergent boundary), separating (divergent boundary), or sliding past each other parallel to Earth’s surface (transform boundary). If you look carefully at Figure 2.8, however, you will see boundaries marked as convergent, divergent, and transform where the arrows don’t seem to be following this rule.
B.1. South America and Nubia Plates
a) What kind of boundary dominates the interaction between the South America and Nubia plates?
b) The arrows on these plates are pointing in more or less the same direction. How can your answer for (a) be true if that’s the case?
B.2. Eurasia, Philippine, and Pacific Plates
a) Look at the Eurasian, Philippine, and Pacific plates on the left side of the map. What kind of boundary dominates the interaction between the Eurasian Plate and the Philippine and Pacific plates?
b) The arrows on all three plates are pointing in more or less the same direction. How can your answer for (a) be true if that’s the case?
B.3. Spreading Ocean Basins
The Antarctica Plate shares boundaries with many plates, with the dominant relationship being divergent margins that are causing ocean basins to become wider. Focus on the segment between the Antarctica Plate and the Nubia Plate, and between the Antarctica Plate and the Pacific Plate.
a) Along which segment is the ocean basin opening faster, and what’s the reason for your conclusion?
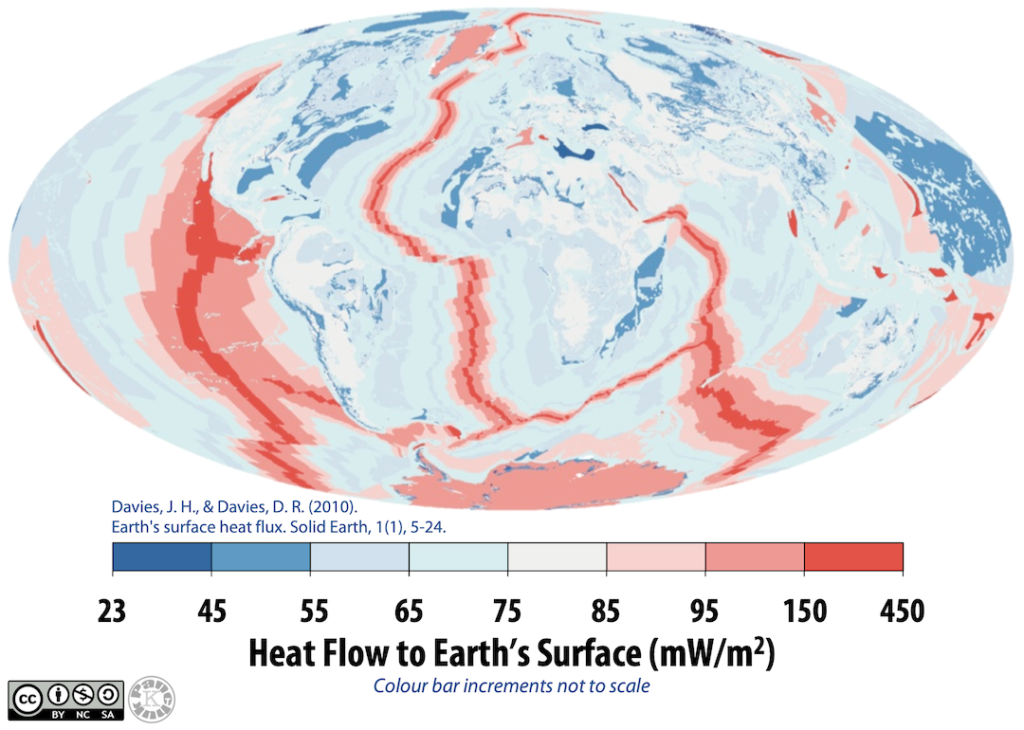
b) Even if we didn’t have data such as Figure 2.8 to show how fast and which way plates are moving, there are other kinds of data that could help us to answer the question in (a). In fact, you have already applied some of the necessary reasoning in earlier questions in this lab. Use the data in Figures 2.9 and 2.10 to provide additional support for your answer in (a).
Note: If you wish, you can use the interactive map used to generate Figures 2.6 and 2.7 instead of referring to Figure 2.9.
C. Earthquakes, Volcanoes, and Landforms
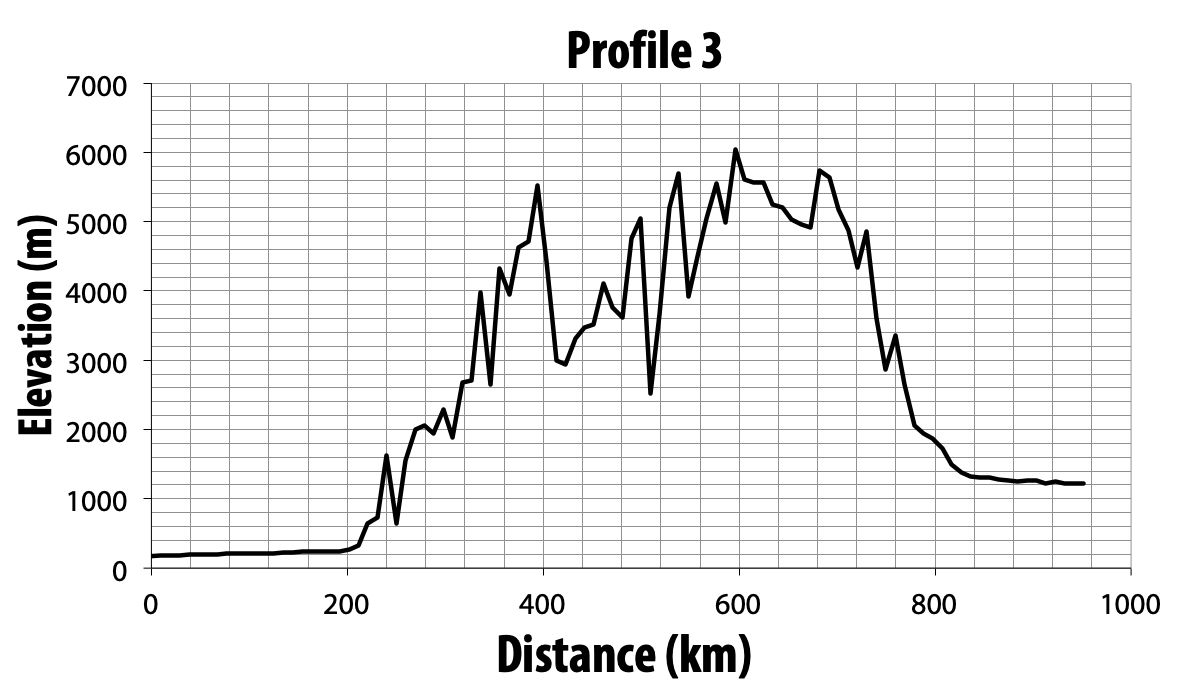
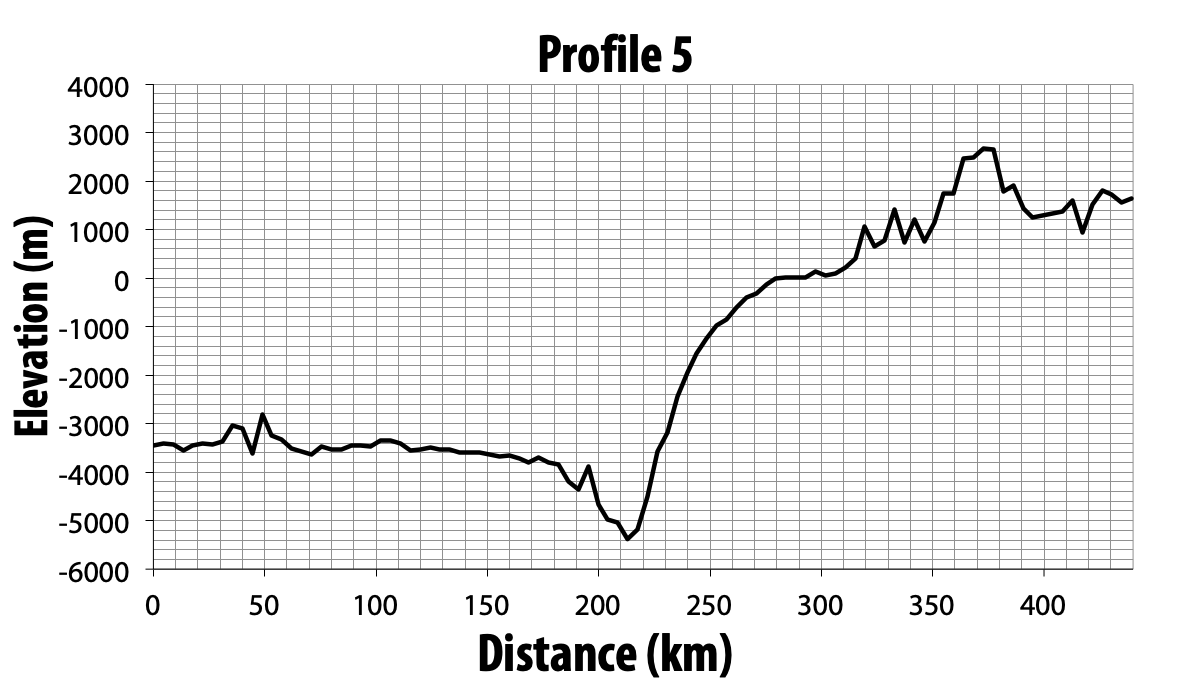
Plate tectonic margins can be distinguished in terms of the presence and depth of earthquakes, the presence or absence of volcanoes, and the shape of Earth’s crust in the area affected by the margin. For this question you will use all three types of data to match the locations in Figure 2.11 with the correct topographic profiles in Figure 2.12, and interpret the features on each profile.
About Topographic Profiles
Topographic profiles are a way of showing elevations along a particular path on Earth’s surface. In a topographic profile we can see where hills, valleys, mountains, shorelines, and so on, are.
When using the topographic profiles in Figure 2.12, pay special attention to the values on the vertical and horizontal scales. The elevation of 0 m marks sea level. Negative elevations are below sea level, and positive values are above sea level.
Also notice that the vertical scale is stretched out compared to the horizontal scale (i.e., the horizontal scale shows hundreds of km, but the same distance on the vertical scales are a few km at most.) The vertical scale is exaggerated because if it were the same as the horizontal scale, it would be difficult to pick out the key landforms. They would all appear as nearly indistinguishable wiggles.
The following questions will guide your exploration of the data to help you solve the puzzle. For this puzzle, explaining the rationale behind your answers is key. If you’re not sure how to answer some of the questions, you may find it helpful to look ahead at the next questions, gather some insights, then return. Solving a puzzle like this one is often an iterative process, going back and forth to look at data and re-examine your conclusions, rather than a linear one of progressing directly to the final answer.
For each question, location A is done for you as an example.
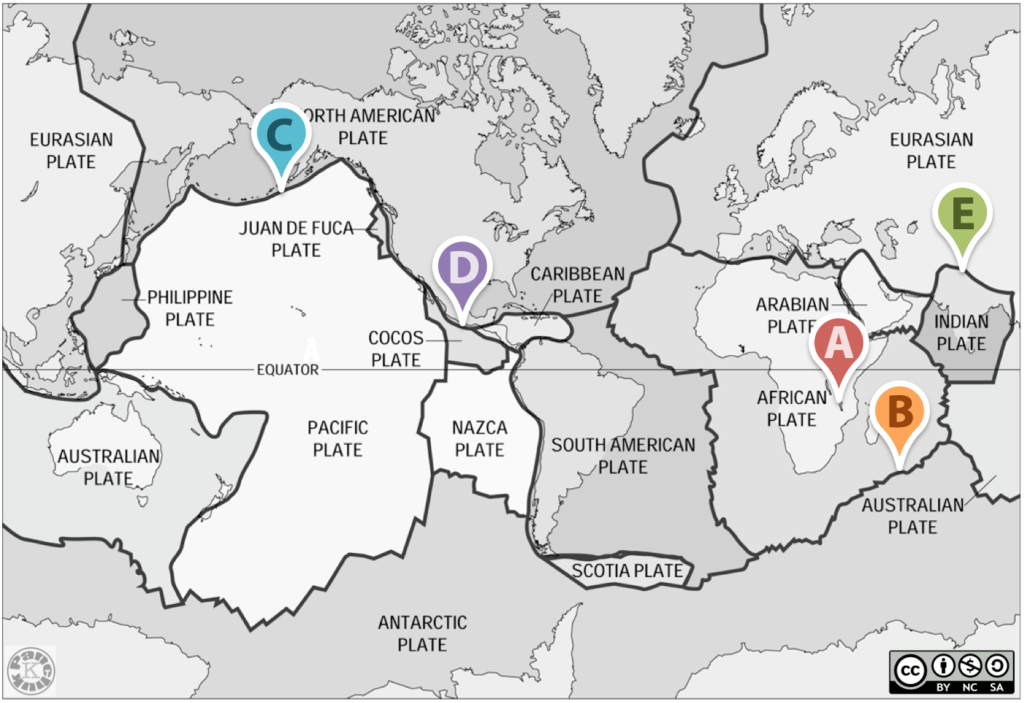
C.1. What kind of plate tectonic margin is present at each location in Figure 2.11?
E.g., is it ocean-ocean convergent, ocean-continent convergent, etc? Refer to Figure 2.8 to help answer this question.
Location A: Continent-continent divergent. (Note: This location is trickier than the others because the marker isn’t located on a line representing a plate boundary. The reason we know it’s continent-continent divergent—as opposed to the alternative on a continent, a continent-continent convergent boundary—is because there is a long trough-like lake present, suggesting the development of a rift valley.)
Location B:
Location C:
Location D:
Location E:
 |
Type of boundary:
Continent-continent divergent
Location: A
|
 |
Type of boundary:
Location:
|
 |
Type of boundary:
Location:
|
 |
Type of boundary:
Location:
|
 |
Type of boundary:
Location:
|
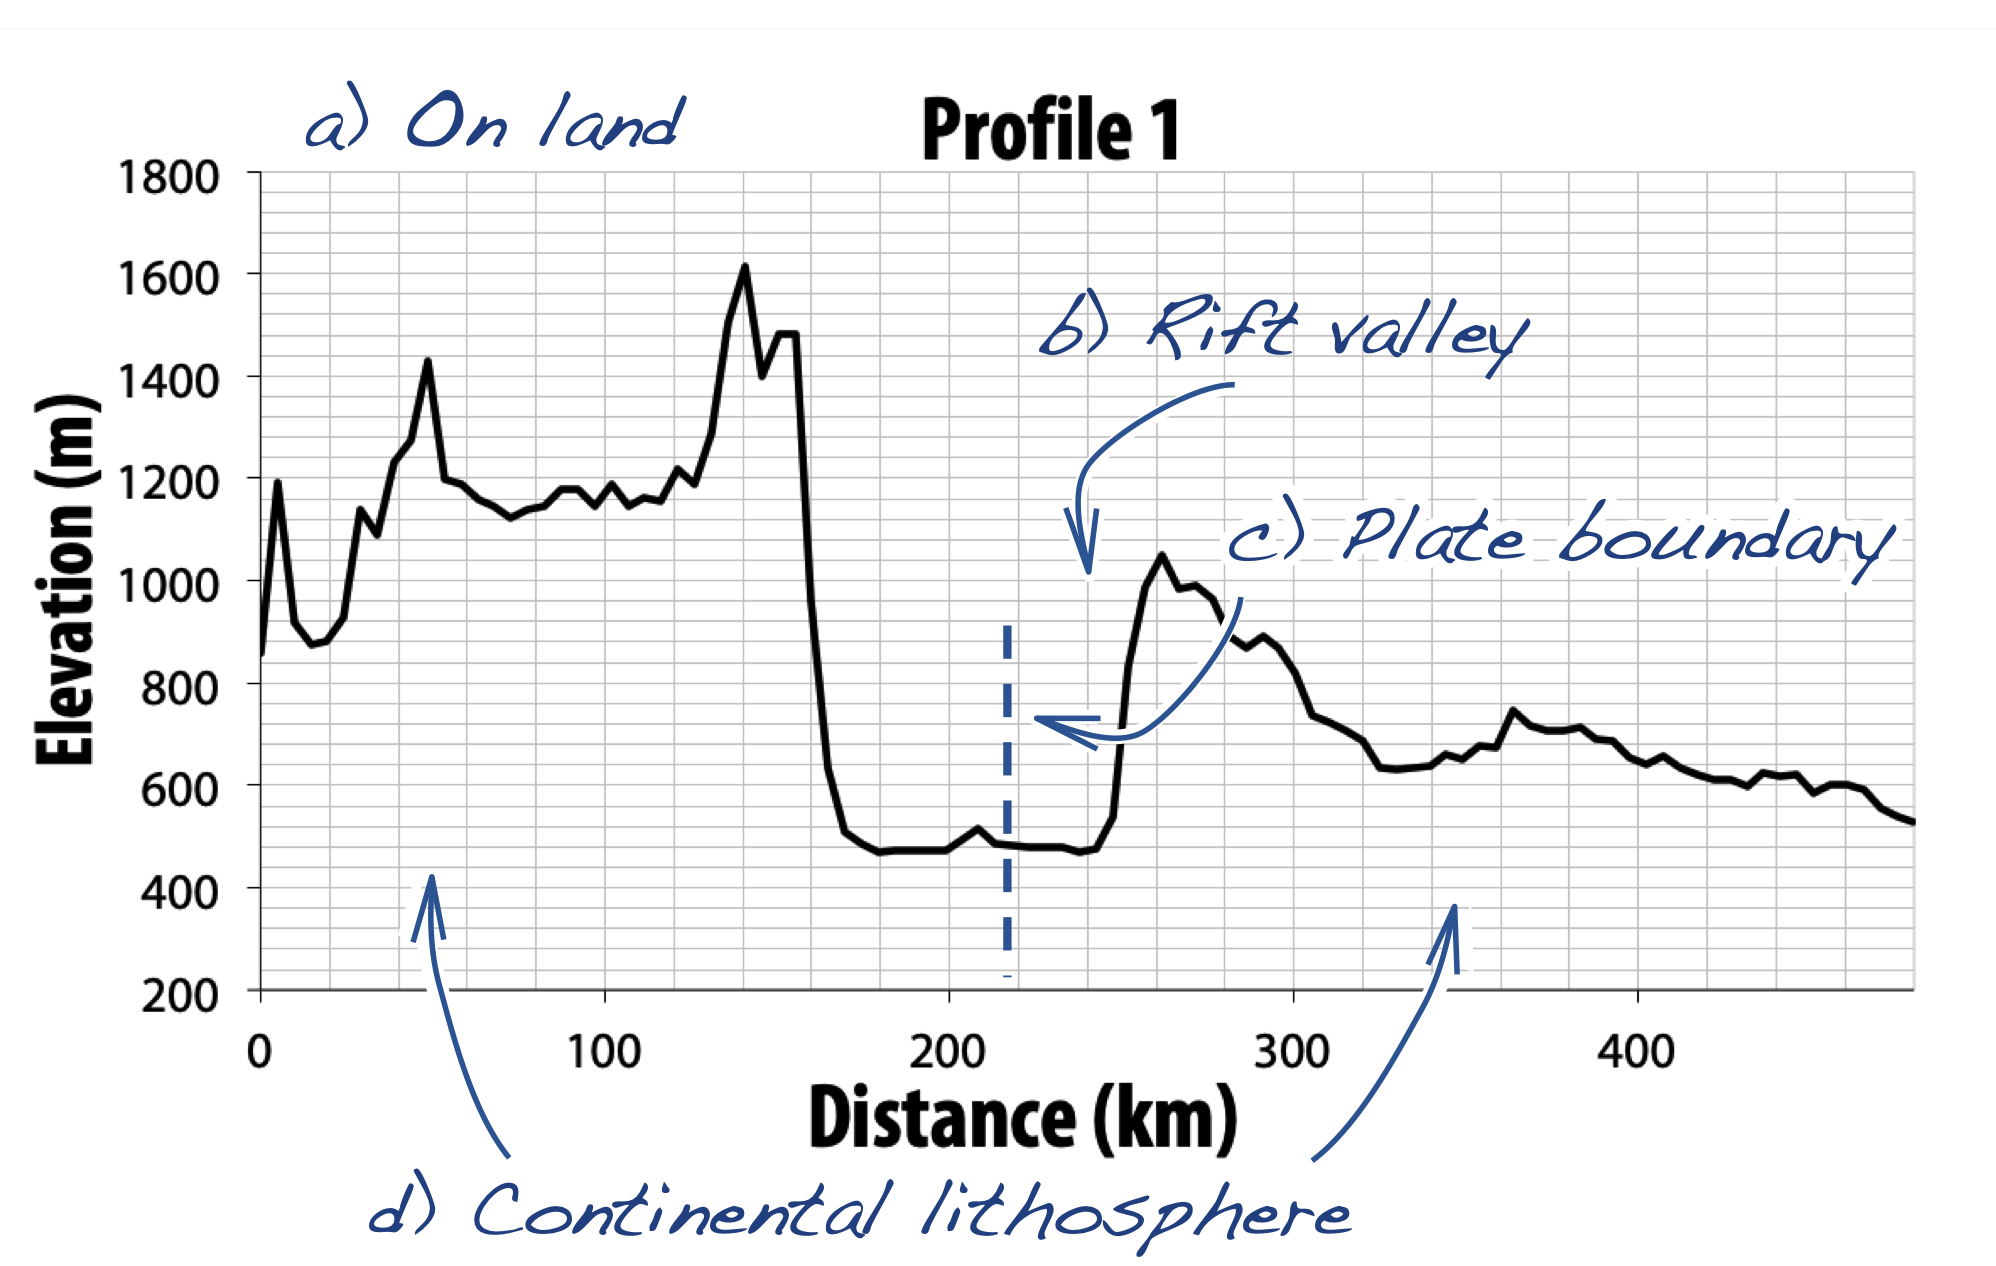
Figure 2.12 | Topographic profiles for mystery plate boundary locations. Source: Karla Panchuk (2020) CC BY-NC-SA 4.0. Data from GMRT Version 3.7. View the GMRT terms of use.
C.2. Match the topographic profiles to the correct location.
For each of profiles 1 – 5, answer the questions below. (Profile 1 is done for you in Figure 2.12.)
a) Find sea level on the vertical axis (0 m) and use a ruler to mark it with a line. Indicate whether the profile is underwater or on land. If it is both, give an indication of how much is underwater vs. on land (e.g., “mostly underwater”).
b) On the profile, label any of the typical landforms that might be present (e.g., trench, volcanic island arc, continental volcanic arc, mountain belt, etc). Hint: You know what kinds of boundaries are present from question C.1. You can refer to Table 2.2 for an idea of what landforms you should be looking for.
c) Draw a vertical line to through the profile to mark the boundary between the two plates. Use your best estimate based on the types of landforms present. You can refer to Figure 2.3 for ideas about where the boundaries might be.
d) Label the two plates in each profile as the appropriate type of lithosphere (continental or oceanic).
e) Based on your answers for a-d, label the type of boundary, and indicate the matching location from Figure 2.11.
C.3. Are your conclusions supported by earthquake and volcano data?
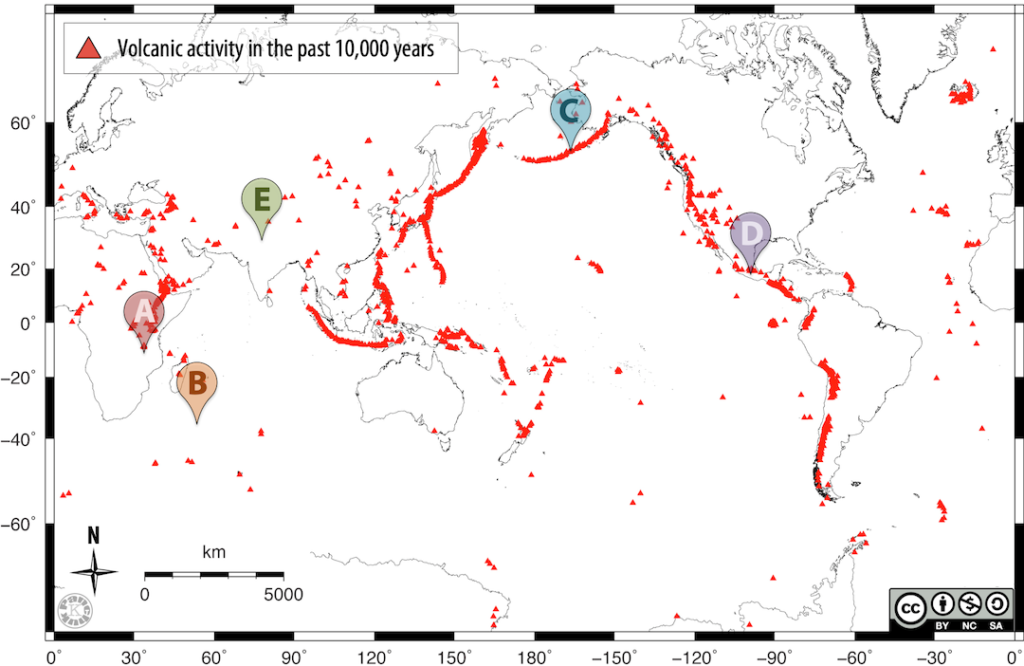
a) Refer to Figure 2.13. For each of locations B-E, has a volcanic eruption occurred within the past 10,000 years? Note that Figure 2.13 only shows volcanoes above water (i.e., on land, on islands). Do the volcano data as shown on the map support your assessment of each profile? If so, explain why you would expect volcanoes to be present or absent. If not, will you change your mind about your answer in C.2.e? Explain why or why not.
Location A: Yes, there are volcanoes at location A. This fits with A being a continent-continent divergent margin, because volcanoes can develop in these settings as the lithosphere thins and decreases pressure on the mantle.
Location B:
Location C:
Location D:
Location E:
b) Refer to Figure 2.14. For each of locations B-E, note whether earthquakes are shallow only, or range from shallow to deep. Are the earthquake data consistent with your assessment of each profile? Explain your answer.
Location A: There are shallow earthquakes at location A. This fits with A being a continent-continent divergent margin because no subduction zone is present.
Location B:
Location C:
Location D:
Location E:

References
Ryan, W. B. F., S.M. Carbotte, J. Coplan, S. O’Hara, A. Melkonian, R. Arko, R.A. Weissel, V. Ferrini, A. Goodwillie, F. Nitsche, J. Bonczkowski, and R. Zemsky (2009), Global Multi-Resolution Topography (GMRT) synthesis data set, Geochem. Geophys. Geosyst., 10, Q03014, doi:10.1029/2008GC002332.
