Chapter 6. Topographic Maps
Lab 7 Activity
Overview
For Lab 7 you will work on interpreting and drawing topographic maps, and drawing topographic profiles. All of the maps used in this lab are oriented so that north is toward the top of the map.
A. Basic Topographic Map Skills
A.1. The following topographic map (Figure 6.13) is from a coastal area. All contour lines are spaced at a 20 m contour interval.
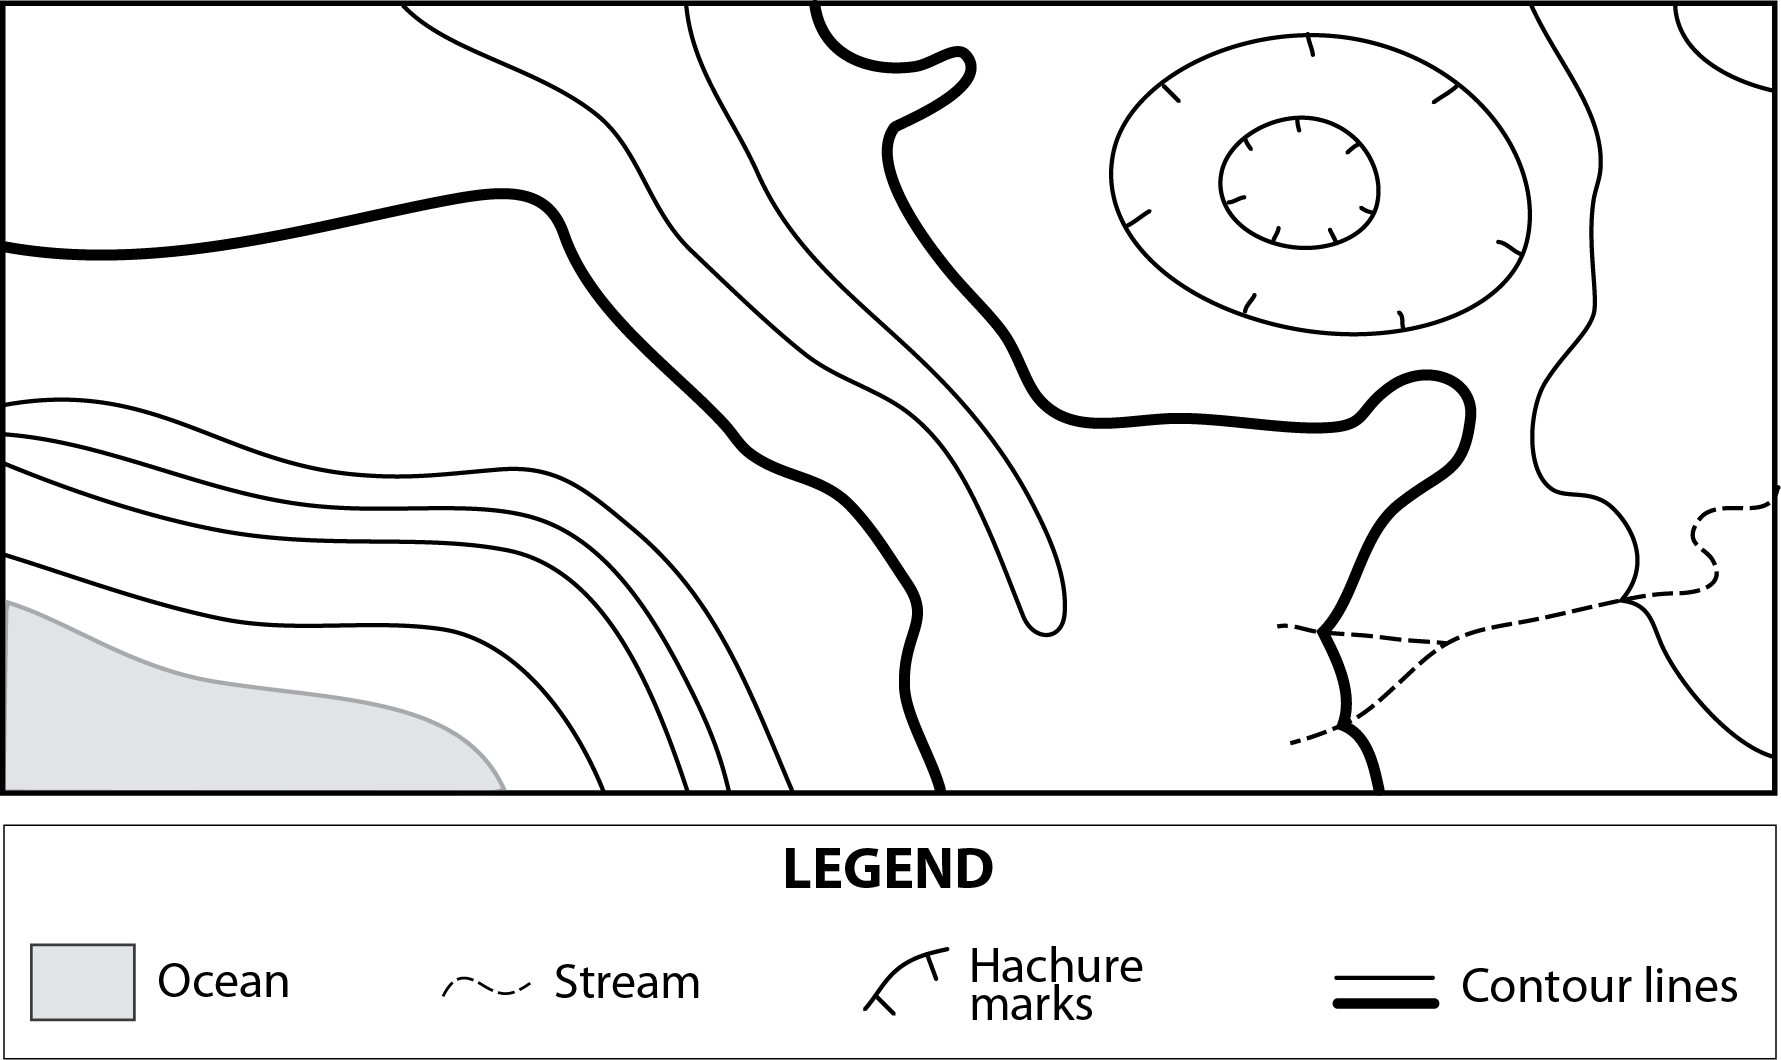
a) Label the elevation of every contour line on the map. Remember: Elevations are measured in metres above sea level.
b) What is the elevation difference between the heavy contour lines? (I.e., if you were to stand on the one to the west, how would your elevation differ compared to if you were standing on the one to the east?) Explain your rationale.
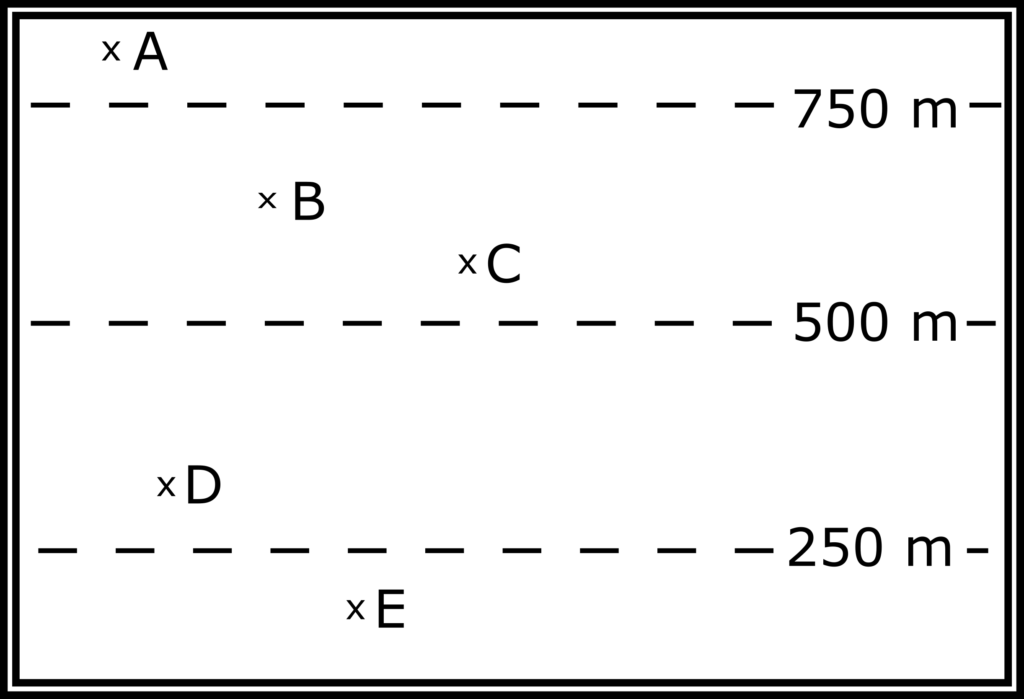
A.2. Figure 6.14 shows five waypoints (A, B, C, D, and E) on a topographic map. The dashed lines are contour lines. The slope of the area is uniform.
a) Write your estimates for the elevation at each waypoint next to the waypoint.
b) How did you decide on the estimated elevations for points A and E?
A.3. Drawing Topographic Contours
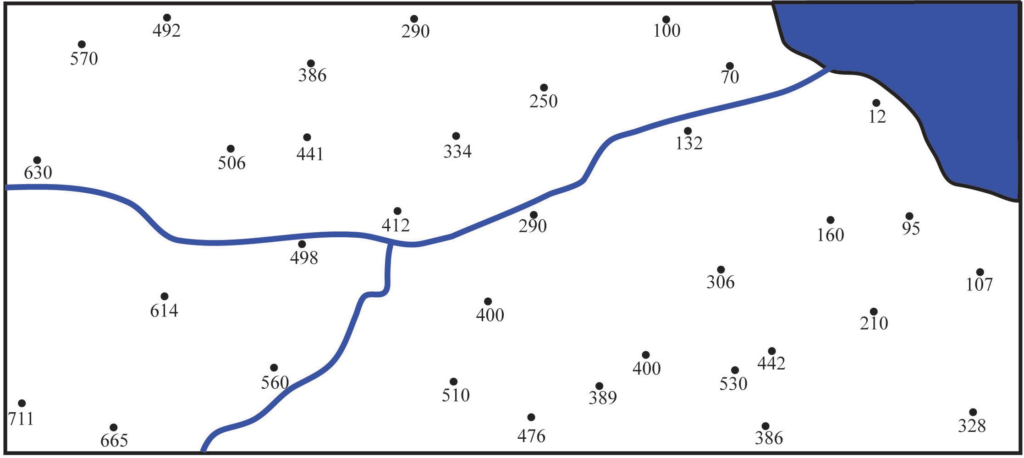
Imagine you are a geologist working for the Geological Survey of Canada. You are tasked with creating your own coastal topographic map, so you hike around a coastal area with a GPS receiver (Global Positioning System) and every so often you record your position along with the elevation in metres at that point, which results in the map below (Figure 6.15).
Complete this map by adding in contour lines using a contour interval of 100 m. Draw the contour lines so that they are continuous: they will either continue to the edge of the map or form an enclosed circle. Your contour lines will generally fall between the GPS points on your map, so you will need to estimate many of the contour line positions. Be sure to label your contour lines.
A.4. Topographic Profile
Construct a topographic profile for the map in Figure 6.16 from position A to A’ in the space provided. Hint: It may help to label all of the contours before you start.
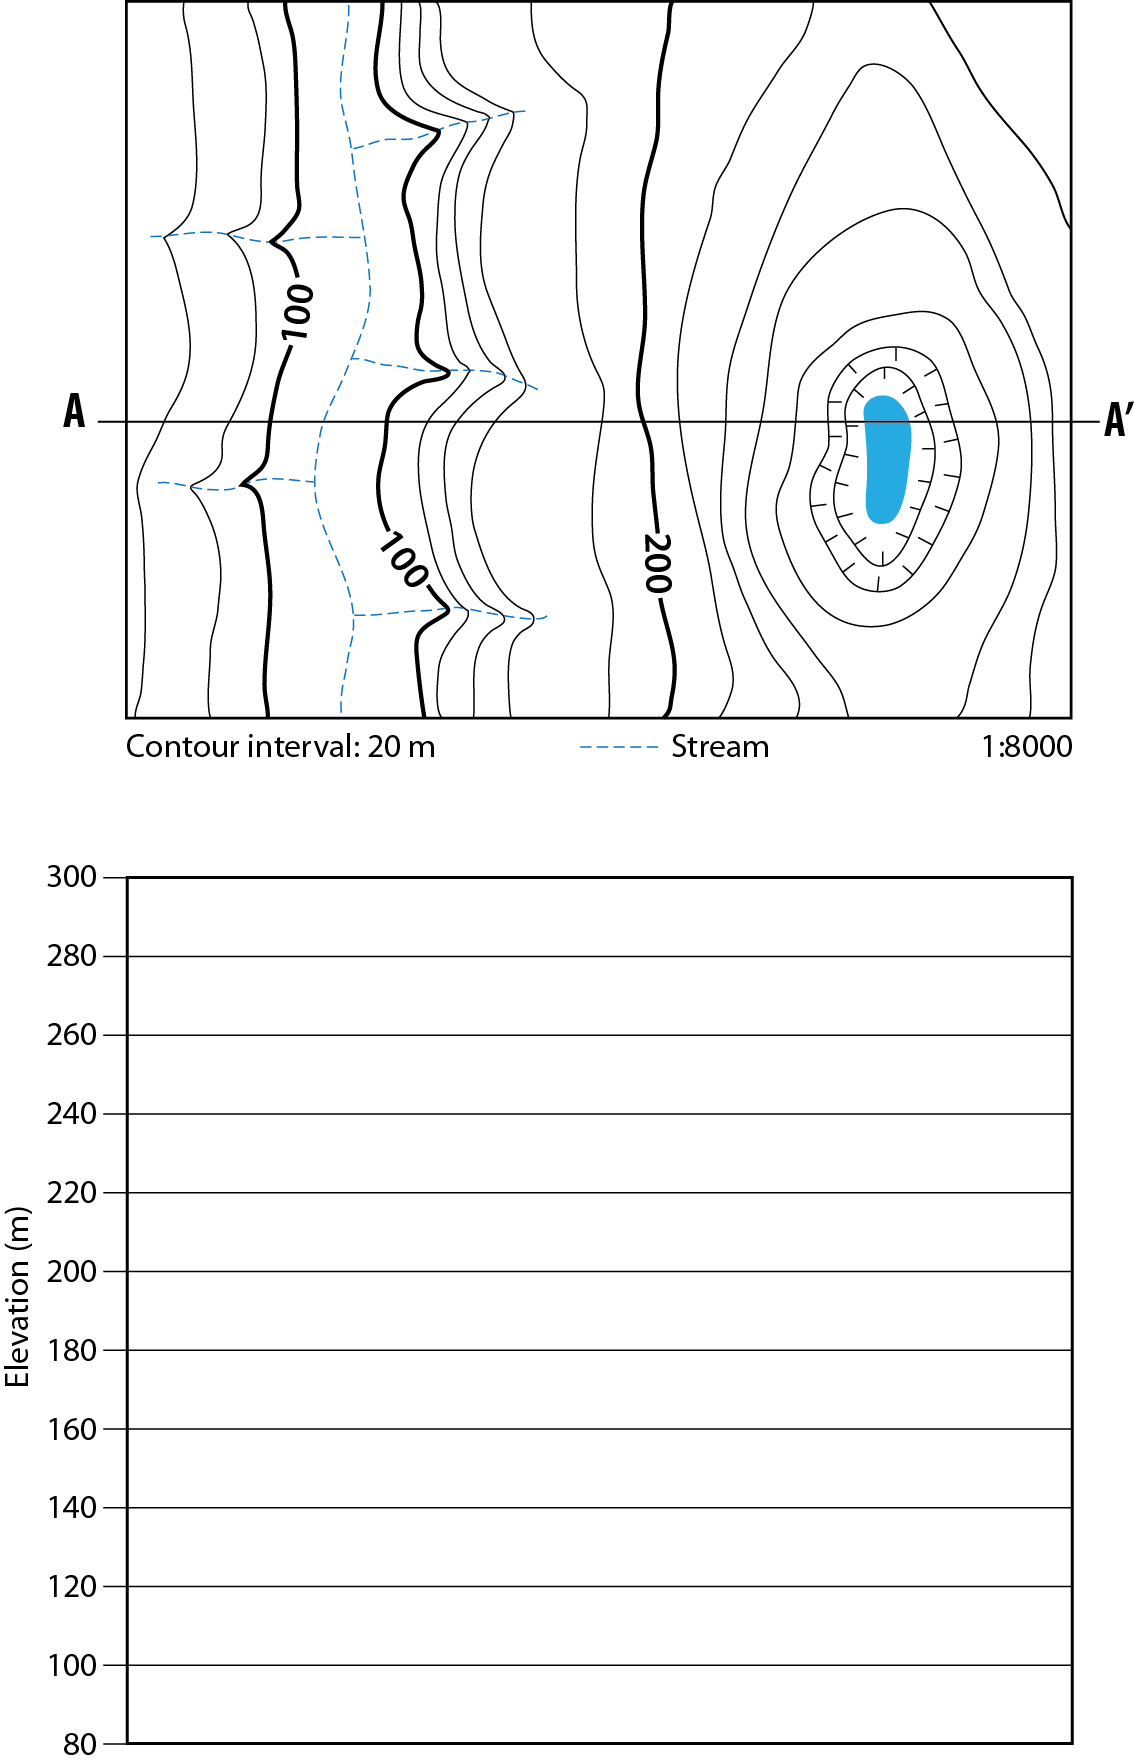
A.5. Vertical Exaggeration
Calculate vertical exaggeration on the topographic profile you constructed. Show your work. Hint: Start by writing both the map scale and the profile scale as a verbal scale (e.g., 1 cm = 50 m).
B. Topographic Map of Mt. Garibaldi Area, BC
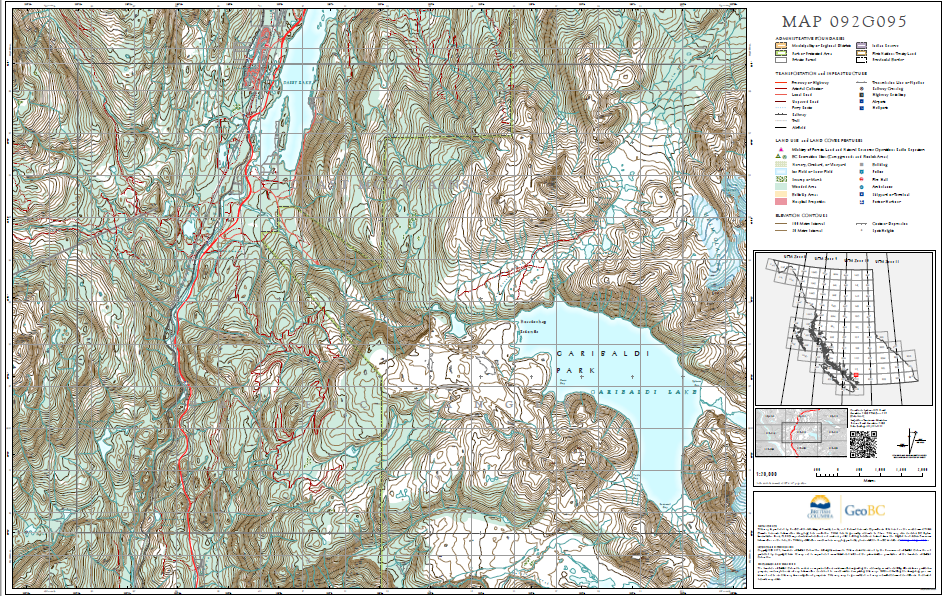
B.1. Refer to Figure 6.17, the full Mt. Garibaldi topographic map.
Note: A re-scalable version of the British Columbia Topographic Map 092G095 can be found here: https://pub.data.gov.bc.ca/datasets/177864/pdf/092G/092G095.pdf
a) What is the ratio scale of the map?
b) Explain in a sentence how a ratio scale works.
c) Examining your map, you will see there is a black line that outlines a rectangle that takes up most of the map area. What is the latitude on the northern edge of this rectangle? Remember to indicate whether the latitude is north or south.
d) What is the longitude along the eastern edge of this rectangle? Remember to indicate whether the longitude is east or west.
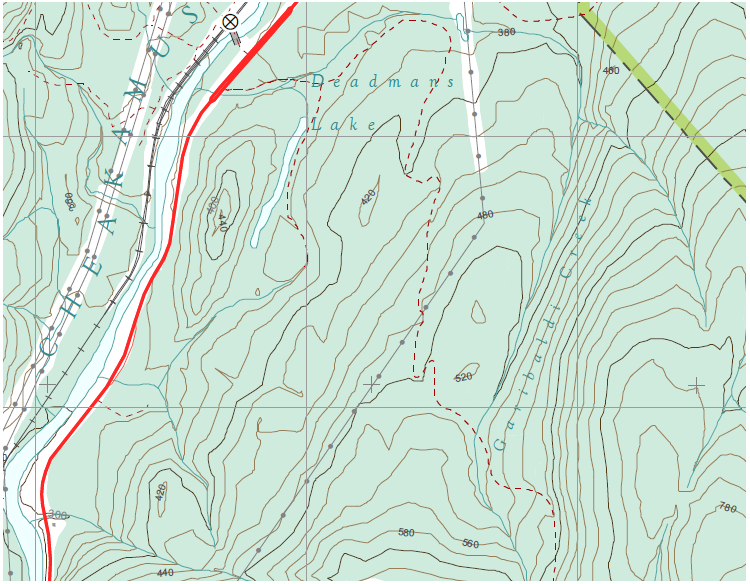
B.2. Refer to Figure 6.18, showing Deadmans Lake and Garibaldi Creek.
a) Find Deadmans Lake (it is long and narrow, east of the Cheakamus River and south of Daisy Lake). Using the surrounding contour lines, what is the approximate elevation of Deadmans Lake? Express your answer using “greater than” and “less than” symbols (i.e., <, >).
b) Garibaldi Creek is located east of Deadmans Lake. Using the contour lines, determine the general upstream direction (i.e., north, south, east, or west) of the creek. How were you able to come to this conclusion?
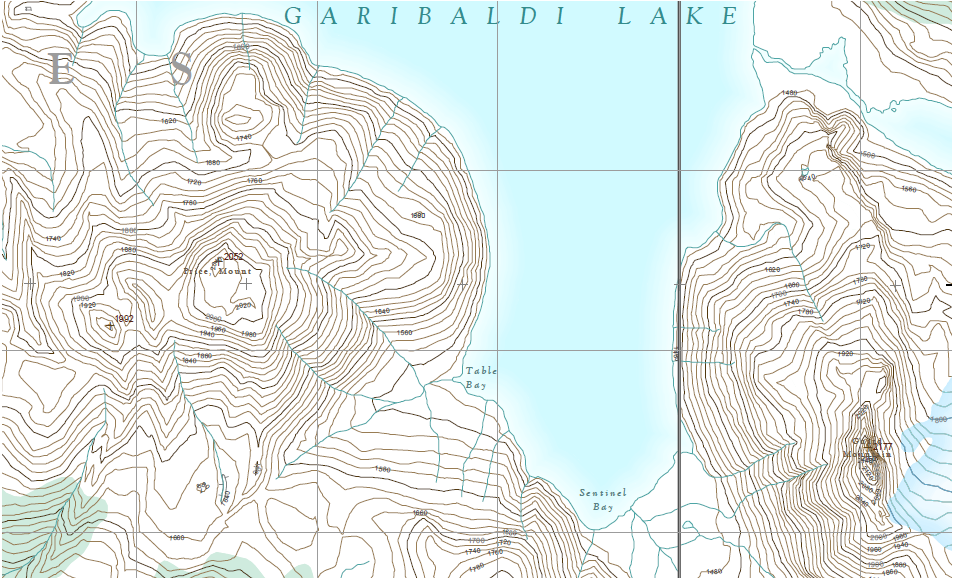
B.3. Refer to Figure 6.19, showing Mount Price and Mount Guard.
a) Mount Price is located next to Garibaldi Lake (just west of Table Bay). How high is Mount Price? Hint: Surveyors have measured the elevation of the peak.
b) How much higher is Mount Price than Garibaldi Lake? Tip: Assume that the elevation of the lake is very close to that of the nearest contour.
c) The most direct straight-line path from the peak of Mount Price to Garibaldi Lake is a horizontal distance of 1373 m. What is the gradient between Garibaldi Lake and Mount Price along that line? Express the gradient as a percentage. Show your work.
d) How would the gradient change if you measured the horizontal distance along a less direct route? Explain why.
e) If someone decided to climb Mount Price, what would be the easiest and safest route to take? Explain why. Hint: Draw a simple map or sketch a rough topographic profile to help illustrate your logic.
C. Pine River Topographic Map
To answer the following questions, use the map at this link: https://pub.data.gov.bc.ca/datasets/177864/pdf/093P/093P094.pdf
a) Pine River is classified as a meandering stream, meaning that it takes a wiggly path across the landscape. Meandering streams continuously alter the landscape around them by actively eroding one side of the riverbank (the cut bank or river cliff), and depositing sediments on the other. Active erosion can steepen the cut bank side to the point of it becoming unstable, causing landslides. Focus on the southern-most eastward meander (at approximately 55°54′ N) before the Pine River leaves the map area. Which side of the riverbank (east or west) is being actively eroded? Explain your answer.
b) The Pine River divides the map area such that the topography to the west of Pine River is very different from the topography to the east. How does the topography differ? Explain your reasoning using observations from the map.
