Michael Pidwirny
LABORATORY 10: PLANT PRODUCTIVITY AND STANDING BIOMASS
LEARNING GOALS
The objectives of this laboratory are to familiarize you with the biomass productivity of the major terrestrial and marine biomes found on planet Earth. We will also examine how the productivity of plants in terrestrial biomes is influenced by air temperature and the availability of water supplied mainly through precipitation.
Upon completion of this laboratory you will be able to:
- Describe the productivity differences that exist between the major terrestrial and marine biomes as measure by net primary production and standing biomass.
- Explain how the productivity of terrestrial biomes varies with latitude.
- Understand how variations in temperature and precipitation influence the productivity of the various terrestrial biomes.
PRODUCTIVITY OF PLANTS
The bodies of living organisms within a unit area make up a standing crop of biomass. More specifically, biomass can be defined as the mass of organisms per unit area and is usually expressed in units of energy (e.g., joules m-2) or dry organic matter (e.g., tons ha-1 or grams m-2). Most of the living biomass in an ecosystem is composed of plants. Plants produce biomass through their ability to fix carbon through photosynthesis. The chemical process behind photosynthesis can be described by the following simple formula:
6CO2 + 6H2O + light energy —-> C6H12O6 + 6O2
The product of photosynthesis is a carbohydrate, such as the sugar glucose and the byproduct oxygen. Another product of photosynthesis is oxygen which is released into the atmosphere. All the sugar produced in the photosynthetic cells of plants and other organisms is derived from the initial chemical combination of carbon dioxide and water with sunlight. This chemical reaction is catalyzed by chlorophyll acting together with other pigments, lipids, sugars, proteins, and nucleic acid molecules. Sugars created in photosynthesis can be later converted by the plant to starch for storage or can be combined with other sugar molecules to form specialized carbohydrates, such as cellulose. Sugars can also be combined with other nutrients such as nitrogen, phosphorus, and sulfur, to build complex molecules such as proteins and nucleic acids.
The primary productivity of a community is the amount of biomass produced through photosynthesis per unit area and time by plants (the primary producers). Primary productivity is usually expressed in units of energy (e.g., joules m-2 day-1) or in units of dry organic matter (e.g., kg m-2 year-1). Globally, primary production amounts to about 250 billion metric tons of dry plant biomass per year. The total energy fixed by plants in a community through photosynthesis is referred to as gross primary productivity (GPP). Because all the energy fixed by the plant is converted into sugar, it is theoretically possible to determine a plant’s energy uptake by measuring the amount of sugar produced. A proportion of the energy of gross primary productivity is in plant respiration. The cellular process of respiration provides a plant with the energy needed for various plant physiological and morphological activities. This is done by chemically breaking down the sugar fixed by photosynthesis to release the stored energy. The general equation for respiration is:
C6H12O6 + 6O2 —-> 6CO2 + 6H2O + released energy
Subtracting respiration from gross primary production gives us a quantity known as net primary productivity (NPP). Net primary productivity represents the quantity of biomass produced by plants that is potentially available for consumption (herbivory) by heterotrophic organisms (bacteria, fungi, and animals).
Globally, patterns of primary productivity vary both spatially and temporally. On land surfaces, the least productive biomes are those limited by heat energy and water like deserts and tundra (Table 10.1 and Figure 10.1). The most productive terrestrial biomes are ecosystems with high temperatures and plenty of available water to support photosynthesis. About 30% of the world’s primary productivity comes from plants living in the ocean (Figure 10.2). These plants are most productive in three environments: 1) areas of the ocean where upwelling brings nutrients from the ocean floor to surface waters, 2) in estuaries where stream runoff provides an abundant supply of nutrients transported from terrestrial habitats, and 3) algal beds and coral reefs.
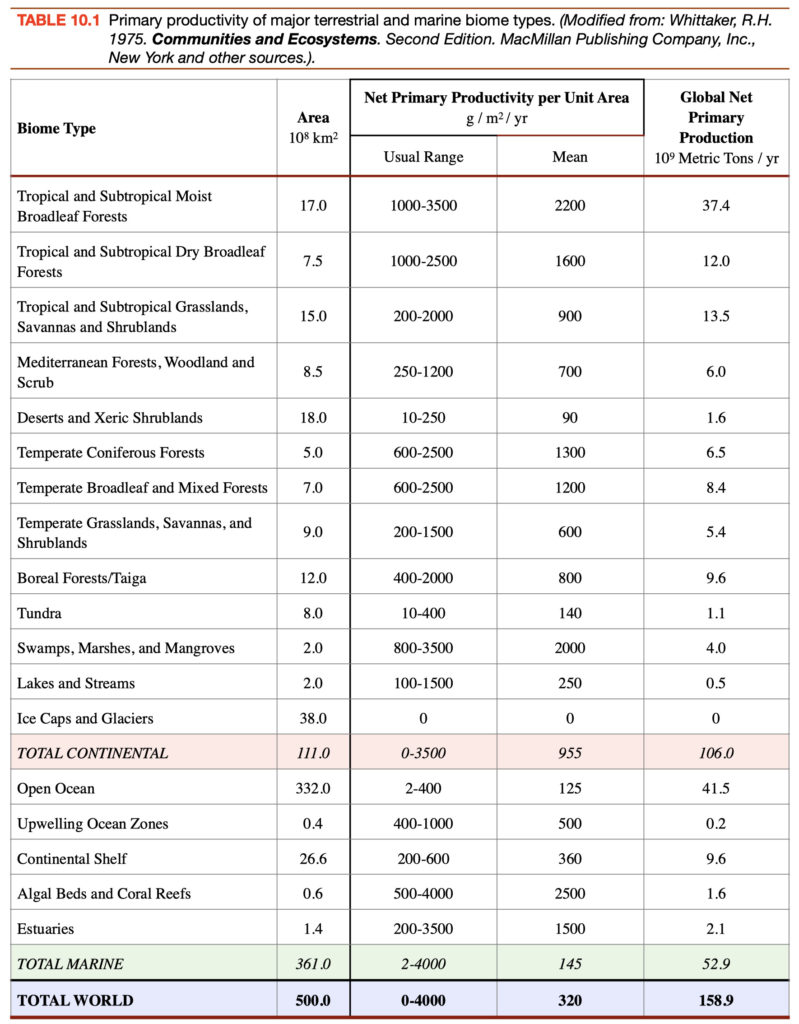
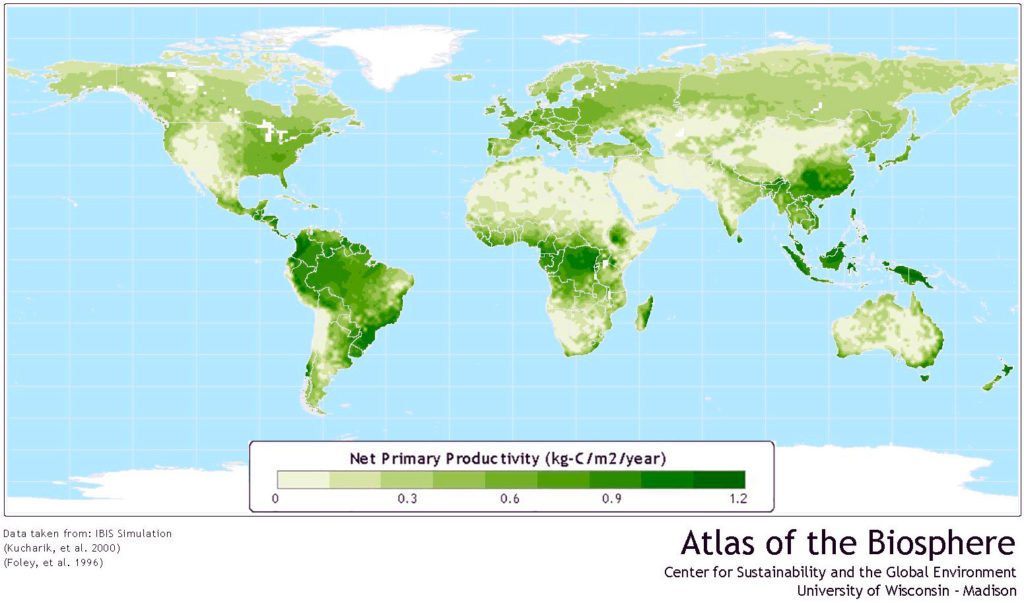
Figure 10.1. Global terrestrial net primary productivity (kg of C m-2 year-1) of our planet for the period of one year. Image Source: Image Courtesy of Atlas of the Biosphere. Data Source: Foley, J.A., I.C. Prentice, N. Ramankutty, S. Levis, D. Pollard, S. Sitch, and A. Haxeltine. 1996. An Integrated Biosphere Model of Land Surface Processes, Terrestrial Carbon Balance and Vegetation Dynamics. Global Biogeochemical Cycles, 10: 603-628. and Kucharik, C.J., J.A. Foley, C. Delire, V.A. Fisher, M.T. Coe, J. Lenters, C. Young-Molling, N. Ramankutty, J.M. Norman, and S.T. Gower. 2000. Testing the performance of a dynamic global ecosystem model: Water balance, carbon balance and vegetation structure. Global Biogeochemical Cycles, 14(3): 795-825. Used by permission of The Center for Sustainability and the Global Environment, Nelson Institute for Environmental Studies, University of Wisconsin-Madison.
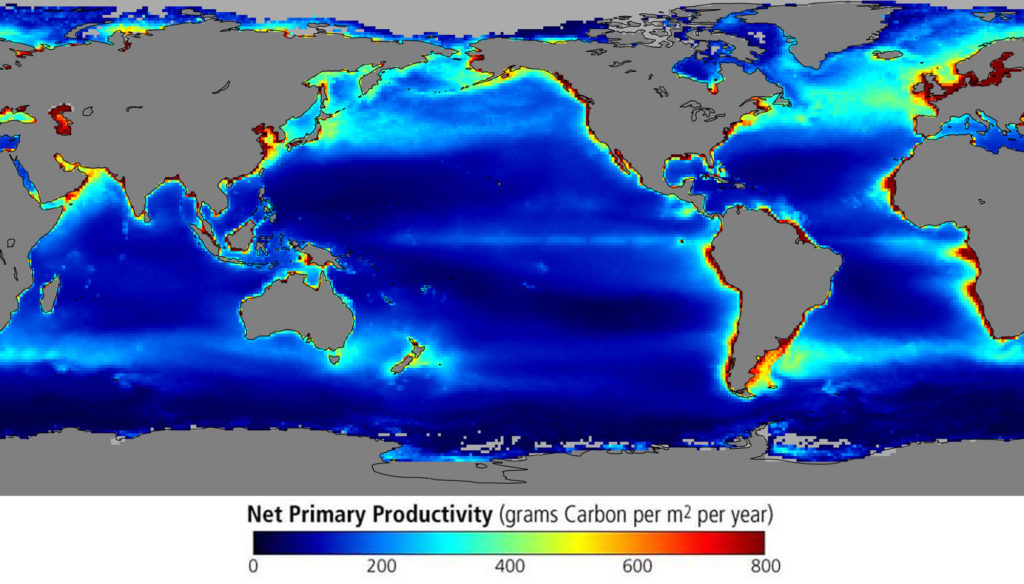
Figure 10.2. Average annual ocean net primary productivity as determined from the Sea-viewing Wide Field-of-view Sensor (SeaWiFS) on the OrbView-2 satellite for the period 1997 to 2002. Measurement units are in grams of carbon per meter squared per year. Image Source: NASA – Goddard Space Flight Center.
FACTORS LIMITING PLANT PRODUCTIVITY
Primary productivity in plants is broadly dependent on two climate factors: temperature and precipitation. Temperature (heat) controls the rate of plant metabolism that in turn determines the amount of photosynthesis that can take place. Most biological metabolic activity takes place within the range from 0 to 50°Celsius. There is little activity above or below this range. The optimal temperatures for photosynthesis coincide with about 25° to 30°Celsius. Figure 10.3 illustrates the relationship between the net primary productivity of forests with annual air temperature.
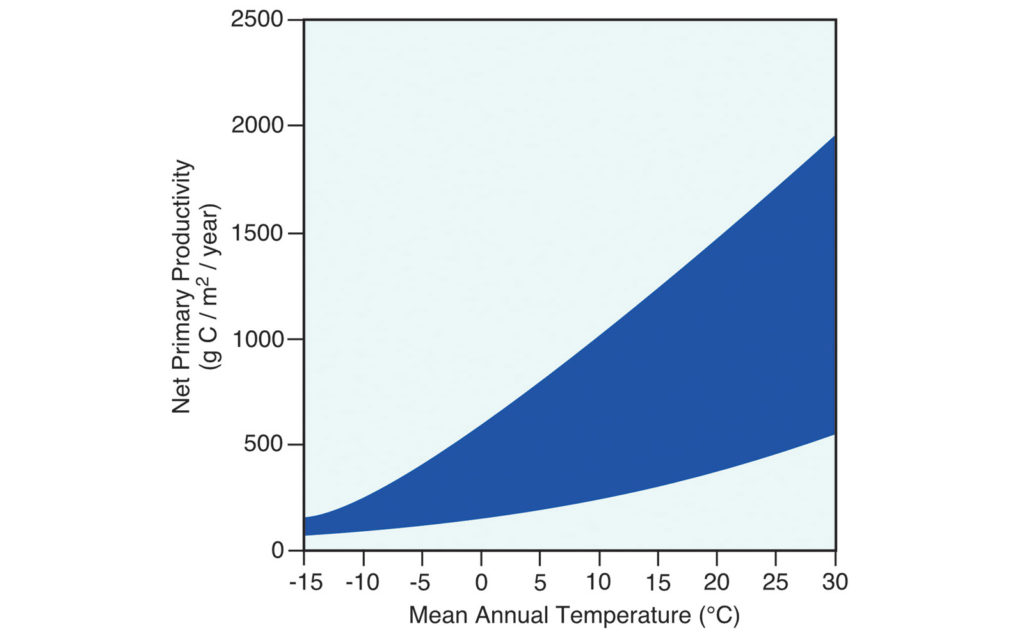
Figure 10.3. Relationship between forest net primary productivity and annual temperature. Note there are a range of productivity values for each value of temperature. Image Copyright: Michael Pidwirny, Data Source: Schuur, E.A.G. 2003. Productivity and global climate revisited: The sensitivity of tropical forest growth to precipitation. Ecology, 84(5): 1165-1170.
Water is a principal requirement for photosynthesis and the main chemical component of most plant cells. In dry regions, there is an increase in net primary productivity with increased water up to about 2400 mm of precipitation (Figure 10.4). In the more humid forest climates of the world, plant productivity declines with higher levels of precipitation as saturated soils limit root uptake of nutrients.
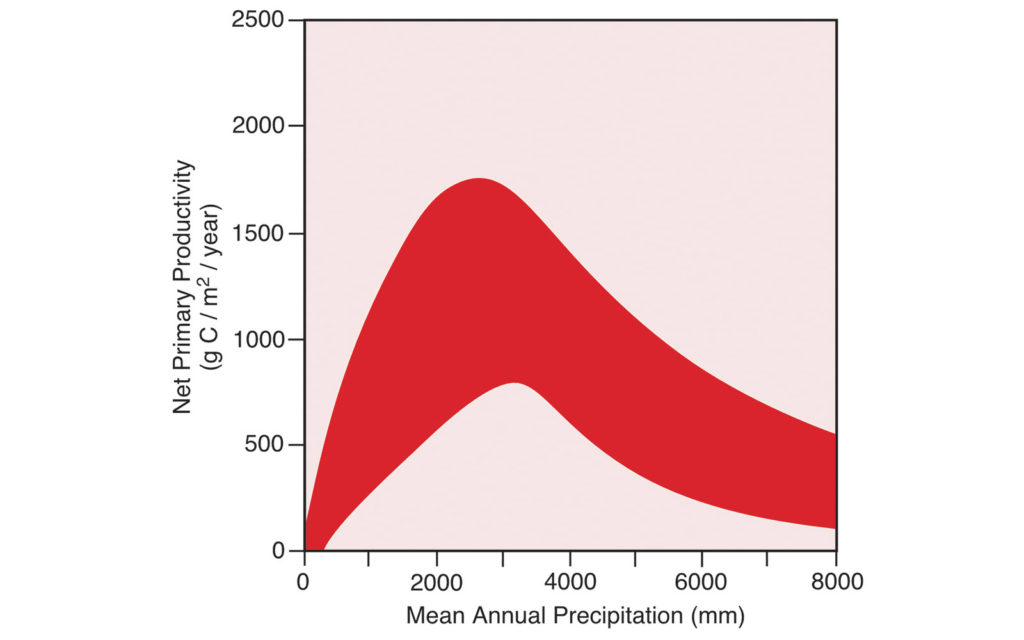
Figure 10.4. Relationship between forest net primary productivity and annual precipitation. Note there are a range of productivity values for each value of precipitation. Image Copyright: Michael Pidwirny, Data Source: Schuur, E.A.G. 2003. Productivity and global climate revisited: The sensitivity of tropical forest growth to precipitation. Ecology, 84(5): 1165-1170.
TERRESTRIAL BIOMES
Here is a brief description of the biomes mentioned in Table 10.1 and in the questions found in this lab (the map in Figure 9.1, Lab 9 shows the geographical distribution of these biomes).
TUNDRA (tu)
The geographical distribution of the Tundra biome is roughly poleward of 65° North latitude. Within the Tundra biome, temperature, precipitation, and evaporation all tend to be at a minimum. This fact has played an important role in the evolution of adaptations for plant and animal survival. This biome is characterized by the absence of trees and the presence of low-lying shrubs, mosses, and lichens.
BOREAL FORESTS (B)
Boreal Forests or Taiga biome lies mainly between 50 and 65° North latitude. The climate of this biome is cold but with more precipitation than the Tundra. Precipitation here occurs mainly in the summer. The predominant vegetation of the Boreal Forest biome are cone-bearing needle-leaf evergreen varieties of tree species.
TEMPERATE CONIFEROUS FORESTS (E)
Temperate Coniferous Forests are found south (in the Northern Hemisphere) of the Boreal Forests in warmer and wetter regions of the temperate mid-latitudes. Coniferous trees here belonging to species not found in the Boreal Forests. Because of the better climate, these forests are also more productive than the Boreal Forests.
TEMPERATE BROADLEAF AND MIXED FORESTS (De)
The Temperate Broadleaf and Mixed Forests biome (also called Temperate Deciduous Forest) is characterized by a moderate temperate climate and a dominance of broadleaf deciduous trees. This biome once occupied much of the eastern half of the United States, central Europe, Korea, and China. Over the last few centuries, this biome has been very extensively affected by human activity. Much of it has been converted into agricultural fields or urban land-use.
TEMPERATE GRASSLANDS, SAVANNAS AND SHRUBLANDS (G)
The Temperate Grasslands, Savannas and Shrublands biome (also called Prairie) once covered much of central North America, Eurasia, Australia, and South America. Before the arrival of humans, these biomes were dominated by various species of grass. Today, most of this natural land-cover has been converted into cropland.
MONTANE GRASSLANDS AND SHRUBLANDS (gm)
The Montane Grasslands and Shrublands biome is found at high elevations in temperate, subtropical, and tropical climates. This biome is dominated by grass and shrub species and tends to have a high number of endemic plants and animals.
DESERTS AND XERIC SHRUBLANDS (d)
Deserts and Xeric Shrublands biome covers about 19% of the Earth’s ground surface. Dominant plants in this biome include drought-resistant shrubs like the Creosote Bush (Larrea divaricata) and Sagebrush (Artemisia tridentata), water-storing succulents like cactus, and many species of short-lived annuals that complete their life cycles during infrequent and short rainy periods. Lastly, desert habitats can be completely devoid of vegetation if precipitation is scarce.
MEDITERRANEAN FORESTS, WOODLANDS AND SCRUB (M)
The Mediterranean Forests, Woodlands and Scrub biome (also called Chaparral) is found in a narrow zone between 32 and 40° latitude North and South on the west coasts of the continents. This area has a dry climate because of the dominance of the subtropical high-pressure zone during the fall, summer, and spring months. Precipitation falls mainly in the winter from the influence of mid-latitude cyclones. The vegetation of this biome consists of many different types of annuals and drought-resistant, evergreen, short woody shrubs and trees.
TROPICAL AND SUBTROPICAL GRASSLANDS, SAVANNAS AND SHRUBLANDS (S)
The Tropical and Subtropical Grasslands, Savannas and Shrublands biome covers extensive areas in eastern Africa, South America, and Australia. It has distinct wet and dry seasons and temperatures that are hot all year long characterize the climate of this biome. Plant life consists of a cover of perennial grass species 1 to 2 meters tall with scattered drought-resistant trees. Tree and shrub species in the savanna usually drop their leaves during the dry season. Annual rainfall varies between 900-1500 millimeters.
TROPICAL AND SUBTROPICAL DRY BROADLEAF FORESTS (Td)
The Tropical and Subtropical Dry Forests biome is found in southern Mexico, southeastern Africa, central India, Indochina, Madagascar, New Caledonia, eastern Bolivia, central Brazil, the Caribbean, and along the coasts of Peru and Ecuador. This biome exists as a zone that borders the Tropical and Subtropical Moist Broadleaf Forests biome. Because of its geographical location, the Tropical and Subtropical Dry Forest experience a dry season that lasts several months. This biome is home to tropical deciduous trees like Teak (Tectona grandis), Mahogany (Swietenia mahagoni, S. macrophylla, and S. humilis), and Mountain Ebony (Bauhinia variegata) dominate these forests. During the seasonal drought, these trees lose their leaves to conserve water.
TROPICAL AND SUBTROPICAL MOIST BROADLEAF FORESTS (T)
The Tropical and Subtropical Moist Broadleaf Forests biome occurs in a zone about 10° of latitude on either side of the equator. Annual rainfall generally exceeds 2000 millimeters and is evenly distributed throughout the year. Temperature and humidity are relatively high throughout the year. Plant life in this biome is highly diverse. A typical hectare may contain as many as 300 different tree species as compared to 20 to 30 in the temperate zone.
LABORATORY 10 QUESTIONS
QUESTION 1
After examining the data in Table 10.1 and Figure 10.1, answer the following questions.
1.1) Relative to the total continental Global Net Primary Production what percentage comes from plant growth in the Tropical and Subtropical Moist Broadleaf Forests (T) biome?
A 1.5%
B 5.1%
C 9.1%
D 35.5%
1.2) Relative to the total continental Global Net Primary Production what percentage comes from plant growth in the Deserts and Xeric Shrublands (d) biome?
A 1.5%
B 5.1%
C 9.1%
D 35.5%
1.3) Relative to the total continental Global Net Primary Production what percentage comes from plant growth in the Boreal Forests (B) biome?
A 1.5%
B 5.1%
C 9.1%
D 35.5%
1.4) Relative to the total continental Global Net Primary Production what percentage comes from plant growth in the Temperate Grassland, Savannas & Shrublands (G)?
A 1.5%
B 5.1%
C 9.1%
D 35.5%
1.5) Explain why global terrestrial net primary productivity is so low in Northern Africa? What biome is found here?
1.6) Explain why global terrestrial net primary productivity is so high in Central Africa? What biome is found here?
After examining the data in Table 10.1 and Figure 10.2, answer the following question.
1.7) In general, describe the areas in our planet’s oceans where marine global net primary productivity is the highest? Why are these areas so productive?
QUESTION 2
Standing biomass refers to the amount of biomass occupying an area at a particular time. This measurement often only includes the (plant) biomass found above-ground. In the Microsoft Excel file “Lab 10 RAW Data.xlsx” are 80 measurements of standing biomass from a variety of land-based locations. These samples are from the eleven different terrestrial biomes previously described previously. Answer the questions that follow:
2.1) Using the data found in the Microsoft Excel file “Lab 10 RAW Data.xlsx” calculate the average standing biomass for the Tundra (tu) biome _______ Tons/Hectare.
2.2) Using the data found in the Microsoft Excel file “Lab 10 RAW Data.xlsx” calculate the average standing biomass for the Boreal Forests (B) biome _______ Tons/Hectare.
2.3) Using the data found in the Microsoft Excel file “Lab 10 RAW Data.xlsx” calculate the average standing biomass for the Temperate Coniferous Forests (E) biome _______ Tons/Hectare.
2.4) Using the data found in the Microsoft Excel file “Lab 10 RAW Data.xlsx” calculate the average standing biomass for the Temperate Broadleaf & Mixed Forests (De) biome _______ Tons/Hectare.
2.5) Using the data found in the Microsoft Excel file “Lab 10 RAW Data.xlsx” calculate the average standing biomass for the Temperate Grassland, Savannas & Shrublands (G) biome _______ Tons/Hectare.
2.6) Using the data found in the Microsoft Excel file “Lab 10 RAW Data.xlsx” calculate the average standing biomass for the Desert and Xeric Shrublands (d) biome _______ Tons/Hectare.
2.7) Using the data found in the Microsoft Excel file “Lab 10 RAW Data.xlsx” calculate the average standing biomass for the Tropical & Subtropical Grasslands, Savannas & Shrublands (S) biome _______ Tons/Hectare.
2.8) Using the data found in the Microsoft Excel file “Lab 10 RAW Data.xlsx” calculate the average standing biomass for the Tropical & Subtropical Dry Broadleaf Forests (Td) biome _______ Tons/Hectare.
2.9) Using the data found in the Microsoft Excel file “Lab 10 RAW Data.xlsx” calculate the average standing biomass for the Tropical & Subtropical Moist Broadleaf Forests (T) biome _______ Tons/Hectare.
2.10) Which biome has the greatest standing biomass per unit area?
A Tropical & Subtropical Moist Broadleaf Forests (T)
B Tropical & Subtropical Dry Broadleaf Forests (Td)
C Temperate Broadleaf & Mixed Forests (De)
D Temperate Coniferous Forests (E)
2.11) Which biome has the lowest standing biomass per unit area?
A Boreal Forests (B)
B Temperate Grassland, Savannas & Shrublands (G)
C Desert & Xeric Shrublands (d)
D Tundra (tu)
QUESTION 3
After examining the data Figure 10.5, answer the following questions.
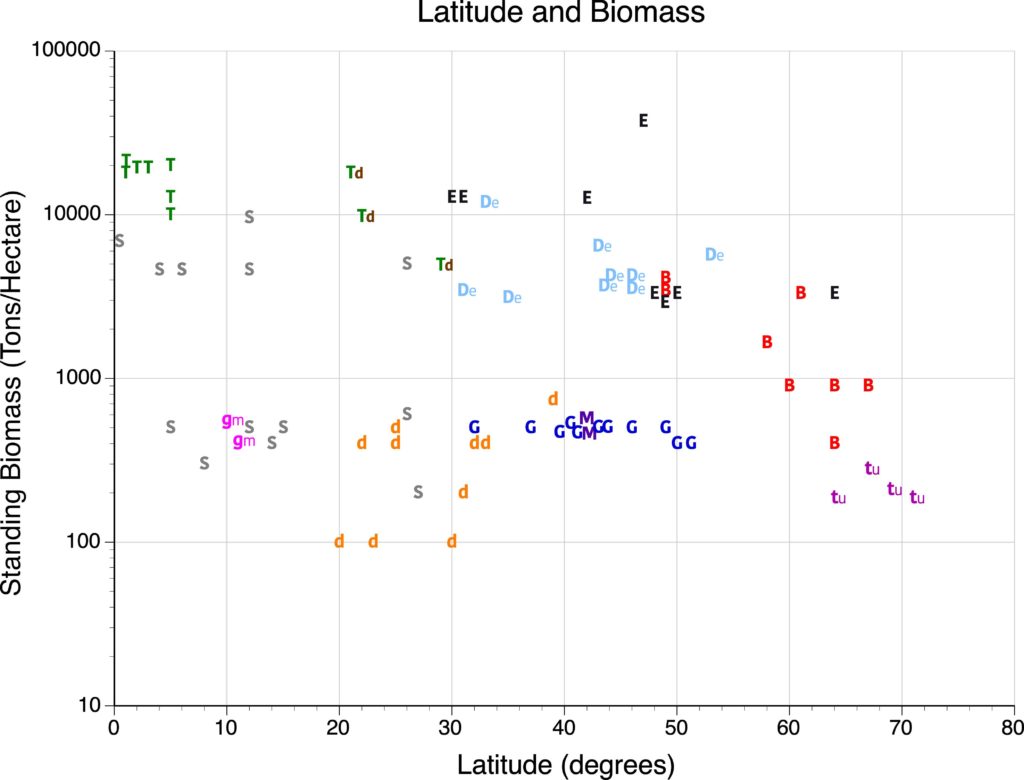
Figure 10.5. Relationship between measured standing biomass and latitude for 80 sampled locations. Eleven types of biomes are shown: T = Tropical & Subtropical Moist Broadleaf Forests, Td = Tropical & Subtropical Dry Broadleaf Forests, S = Tropical & Subtropical Grasslands, Savannas & Shrublands, d = Deserts & Xeric Shrublands, gm = Montane Grasslands & Shrublands, M = Mediterranean Forests, Woodlands & Scrub, G = Temperate Grassland, Savannas & Shrublands, De = Temperate Broadleaf & Mixed Forests, E = Temperate Coniferous Forests, B = Boreal Forests, and tu = Tundra.
3.1) According to Figure 10.5, the Tropical & Subtropical Moist Broadleaf Forests (T) biome is found between what latitudes?
A 0 to 6 degrees.
B 0 to 28 degrees.
C 20 to 30 degrees.
D 20 to 40 degrees.
3.2) According to Figure 10.5, the Desert & Xeric Shrublands (d) biome is found between what latitudes?
A 0 to 6 degrees.
B 0 to 28 degrees.
C 20 to 30 degrees.
D 20 to 40 degrees.
3.3) According to Figure 10.5, the Tropical & Subtropical Grasslands, Savannas & Shrublands (S) biome is found between what latitudes?
A 0 to 6 degrees.
B 0 to 28 degrees.
C 20 to 30 degrees.
D 20 to 40 degrees.
3.4) According to Figure 10.5, the Temperate Grassland, Savannas & Shrublands (G) biome is found between what latitudes?
A 30 to 52 degrees.
B 48 to 68 degrees.
C 20 to 30 degrees.
D 20 to 40 degrees.
3.5) According to Figure 10.5, the Boreal Forests (B) biome is found between what latitudes?
A 30 to 52 degrees.
B 48 to 68 degrees.
C 20 to 30 degrees.
D 20 to 40 degrees.
3.6) According to Figure 10.5, the Tundra (tu) biome is found between what latitudes?
A 30 to 52 degrees.
B 48 to 68 degrees.
C 20 to 30 degrees.
D 62 to 72 degrees.
QUESTION 4
After examining the data Figure 10.6, answer the following questions.
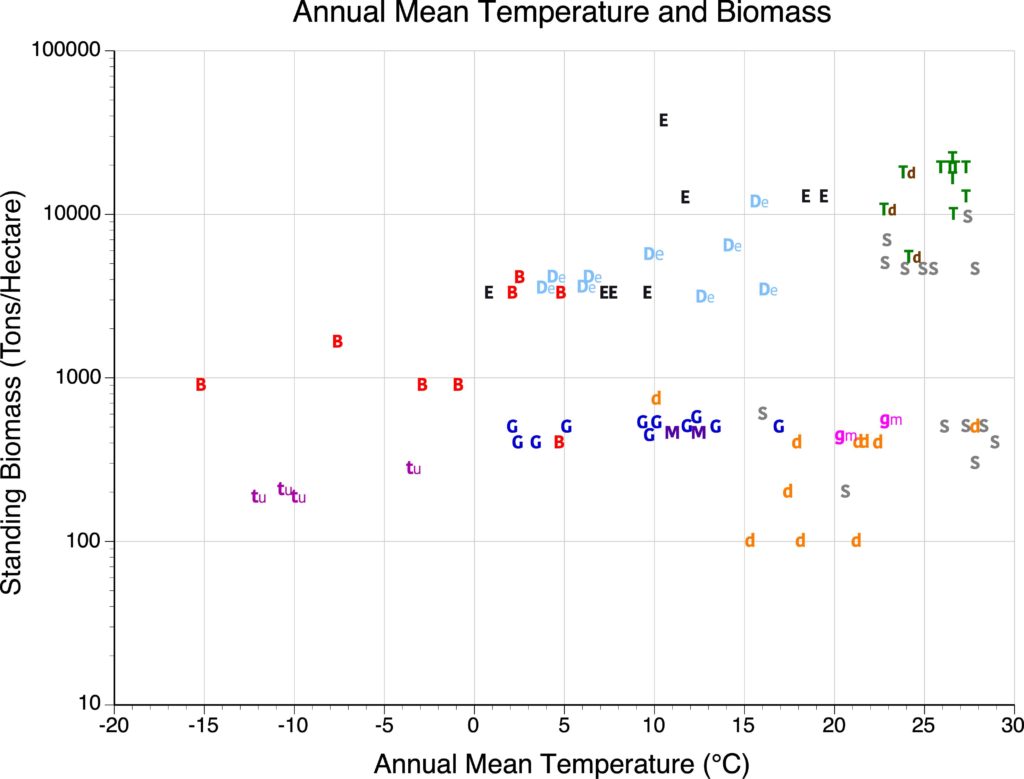
Figure 10.6. Relationship between measured standing biomass and annual mean temperature for 80 sampled locations. Eleven types of biomes are shown: T = Tropical & Subtropical Moist Broadleaf Forests, Td = Tropical & Subtropical Dry Broadleaf Forests, S = Tropical & Subtropical Grasslands, Savannas & Shrublands, d = Deserts & Xeric Shrublands, gm = Montane Grasslands & Shrublands, M= Mediterranean Forests, Woodlands & Scrub, G = Temperate Grassland, Savannas & Shrublands, De= Temperate Broadleaf & Mixed Forests, E = Temperate Coniferous Forests, B = Boreal Forests, and tu= Tundra.
4.1) According to Figure 10.6, the Tundra (tu) biome is found between what values of annual mean temperature?
A -15 to 5 degrees Celsius.
B -13 to -3 degrees Celsius.
C 2 to 17 degrees Celsius.
D 0 to 20 degrees Celsius.
4.2) According to Figure 10.6, the Boreal Forests (B) biome is found between what values of annual mean temperature?
A -15 to 5 degrees Celsius.
B -13 to -3 degrees Celsius.
C 2 to 17 degrees Celsius.
D 0 to 20 degrees Celsius.
4.3) According to Figure 10.6, the Temperate Coniferous Forests (E) biome is found between what values of annual mean temperature?
A -15 to 5 degrees Celsius.
B -13 to -3 degrees Celsius.
C 2 to 17 degrees Celsius.
D 0 to 20 degrees Celsius.
4.4) According to Figure 10.6, the Tropical & Subtropical Grasslands, Savannas & Shrublands (S) biome is found between what values of annual mean temperature?
A 10 to 28 degrees Celsius.
B 25 to 28 degrees Celsius.
C 3 to 17 degrees Celsius.
D 16 to 29 degrees Celsius.
4.5) According to Figure 10.6, the Tropical & Subtropical Moist Broadleaf Forests (T) biome is found between what values of annual mean temperature?
A 10 to 28 degrees Celsius.
B 25 to 28 degrees Celsius.
C 3 to 17 degrees Celsius.
D 16 to 29 degrees Celsius.
4.6) According to Figure 10.6, the Desert & Xeric Shrublands (d) biome is found between what values of annual mean temperature?
A 10 to 28 degrees Celsius.
B 25 to 28 degrees Celsius.
C 3 to 17 degrees Celsius.
D 16 to 29 degrees Celsius.
4.7) With the help of Figure 10.6, explain what happens to plant productivity (as measured by standing biomass) as annual mean temperature increases.
QUESTION 5
After examining the data Figure 10.7, answer the following questions.
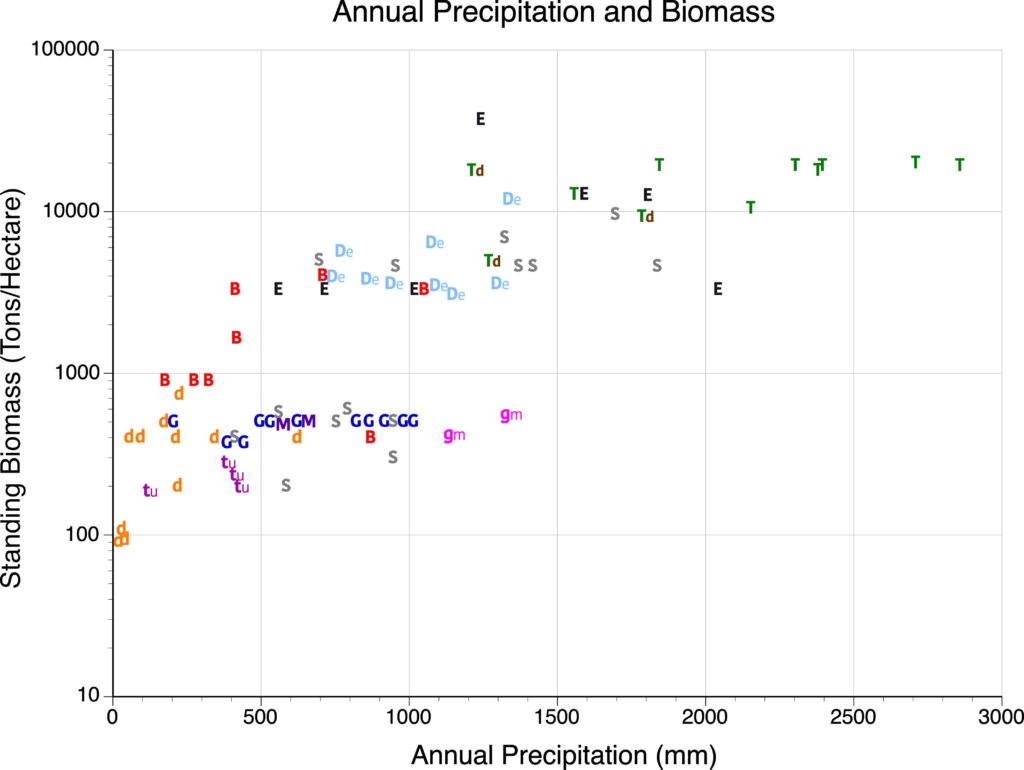
Figure 10.7. Relationship between measured standing biomass and annual precipitation for 80 sampled locations. Eleven types of biomes are shown: T = Tropical & Subtropical Moist Broadleaf Forests, Td = Tropical & Subtropical Dry Broadleaf Forests, S = Tropical & Subtropical Grasslands, Savannas & Shrublands, d = Deserts & Xeric Shrublands, gm = Montane Grasslands & Shrublands, M= Mediterranean Forests, Woodlands & Scrub, G = Temperate Grassland, Savannas & Shrublands, De= Temperate Broadleaf & Mixed Forests, E = Temperate Coniferous Forests, B = Boreal Forests, and tu= Tundra.
5.1) According to Figure 10.7, the Tundra (tu) biome is found between what values of annual precipitation?
A 0 to 500 mm.
B 0 to 700 mm.
C 500 to 2100 mm.
D 1500 to 3000 mm.
5.2) According to Figure 10.7, the Tropical & Subtropical Moist Broadleaf Forests (T) biome is found between what values of annual precipitation?
A 0 to 500 mm.
B 0 to 700 mm.
C 500 to 2100 mm.
D 1500 to 3000 mm.
5.3) According to Figure 10.7, the Temperate Broadleaf & Mixed Forests (De) biome is found between what values of annual precipitation?
A 0 to 500 mm.
B 0 to 700 mm.
C 700 to 1300 mm.
D 1500 to 3000 mm.
5.4) According to Figure 10.7, the Desert & Xeric Shrublands (d) biome is found between what values of annual precipitation?
A 0 to 500 mm.
B 0 to 700 mm.
C 700 to 1300 mm.
D 1500 to 3000 mm.
5.5) According to Figure 10.7, the Temperate Grassland, Savannas & Shrublands (G) biome is found between what values of annual precipitation?
A 0 to 500 mm.
B 200 to 1100 mm.
C 700 to 1400 mm.
D 400 to 1800 mm.
5.6) With the help of Figure 10.7, explain what happens to plant productivity (as measured by standing biomass) as annual precipitation increases.
IMAGE CREDITS
Figure 10.1: Image Source: Image Courtesy of Atlas of the Biosphere. Data Source: Foley, J.A., I.C. Prentice, N. Ramankutty, S. Levis, D. Pollard, S. Sitch, and A. Haxeltine. 1996. An Integrated Biosphere Model of Land Surface Processes, Terrestrial Carbon Balance and Vegetation Dynamics. Global Biogeochemical Cycles, 10: 603-628. and Kucharik, C.J., J.A. Foley, C. Delire, V.A. Fisher, M.T. Coe, J. Lenters, C. Young-Molling, N. Ramankutty, J.M. Norman, and S.T. Gower. 2000. Testing the performance of a dynamic global ecosystem model: Water balance, carbon balance and vegetation structure. Global Biogeochemical Cycles, 14(3): 795-825. Used by permission of The Center for Sustainability and the Global Environment, Nelson Institute for Environmental Studies, University of Wisconsin-Madison.
Figure 10.2: Image Source: NASA – Goddard Space Flight Center. Public Domain.
Figure 10.3: Image Copyright Michael Pidwirny. Data Source: Schuur, E.A.G. 2003. Productivity and global climate revisited: The sensitivity of tropical forest growth to precipitation. Ecology, 84(5): 1165-1170.
Figure 10.4: Image Copyright Michael Pidwirny. Data Source: Schuur, E.A.G. 2003. Productivity and global climate revisited: The sensitivity of tropical forest growth to precipitation. Ecology, 84(5): 1165-1170.
QUESTION ANSWER SHEET
FIGURES AND TABLES – PDF FILES
MICROSOFT EXCEL DATA FILES
This Laboratory Exercise is Licensed Under Attribution-NonCommercial-NoDerivatives 4.0 International (CC BY-NC-ND 4.0).
Updated April 6, 2021
The weight of living tissues usually measured per unit area over a particular time interval. Can include the dead parts of organisms like bark, hair, and nails.
The largest recognizable assemblage of plants and animals on the Earth. The distribution of the biomes is controlled mainly by climate.
Is the chemical process where plants and some bacteria can capture and organically fix the energy of the Sun. This chemical reaction can be described by the following simple equation:
6CO2 + 6H2O + light energy ➜ C6H12O6 + 6O2
Organisms that occupy the first trophic level in the grazing food chain. These organisms are photosynthetic autotrophs.
Total amount of chemical energy fixed by the processes of photosynthesis.
Is the process where the mitochondria of cells of an organism release chemical energy from sugar and other organic molecules through chemical oxidation. This process occurs in both plants and animals. In most organisms, respiration releases the energy required for all metabolic processes. This chemical reaction can be described by the following simple equation: C6H12O6 + 6O2 ➜ 6CO2 + 6H2O + released energy.
