Michael Pidwirny
LABORATORY 8: ATMOSPHERIC MOISTURE AND PRECIPITATION
LEARNING GOALS
The objectives of this laboratory are to familiarize you with two important components of the hydrological cycle, atmospheric moisture and precipitation, and the mechanisms that are responsible for the formation of precipitation and its global distribution.
Upon completion of this laboratory you will be able to:
- Mathematically manipulate several different measures of atmospheric moisture.
- Describe the spatial patterns of precipitation on a global scale.
- Understand the mechanisms of precipitation formation.
ATMOSPHERIC WATER
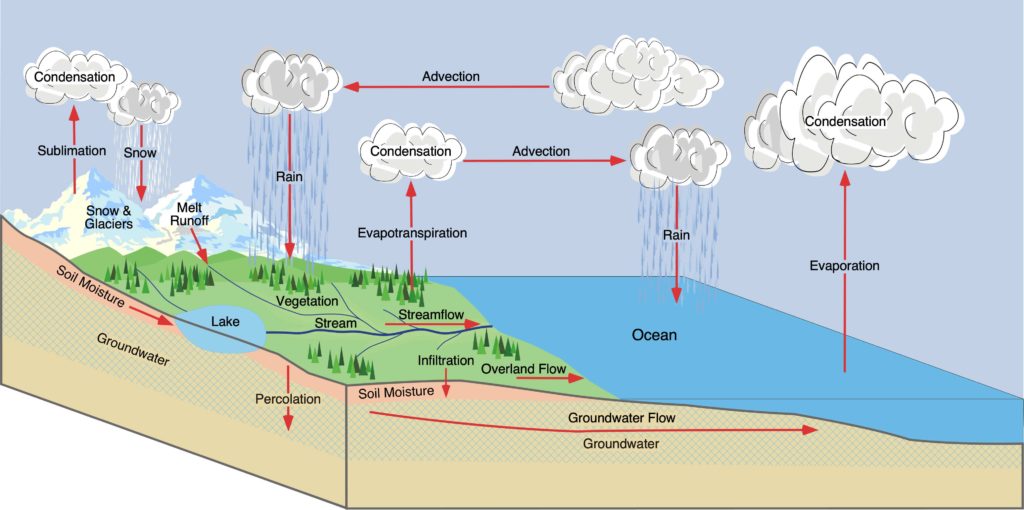
The hydrologic cycle models the course of water over the Earth’s surface and within its atmosphere (Figure 8.1). It follows the precipitation of water in the form of rain and snow to the Earth’s surface, its storage in oceans, lakes, snow, and ice, its transport by rivers and ocean currents, and its subsequent return to the atmosphere through evaporation and transpiration by vegetation. Less than 0.001% of Earth’s water is normally found in the atmosphere. Within the atmosphere, water can move about the globe through advection bringing areas more precipitation than their actual evaporation.
At any given time and place, the amount of water in the atmosphere available for precipitation is precipitable water. On average, over a year this water cycles between the atmosphere and Earth’s surface some 36 times, resulting in a mean annual global precipitation of about 1050 mm. At the global scale, evaporation from the Earth’s land and ocean surfaces balances the precipitation that falls.
In this laboratory, we focus on two components of the hydrological cycle, atmospheric storage of water vapor (humidity) and precipitation.
ATMOSPHERIC MOISTURE, HUMIDITY AND DEW POINT
The term humidity is used in climatology and meteorology to describe the water vapor content of the atmosphere. This term does not refer to the presence of water in liquid or solid forms.
Common expressions of humidity are:
- Vapor pressure (e): the pressure exerted by the vapor alone.
- Absolute humidity (ρ): the mass of water vapor in one cubic meter of air.
- Mixing ratio (r): the ratio of the mass of water vapor to the mass of dry air.
- Relative humidity (RH): the ratio of the amount of water vapor that is present to the amount of water vapor that could be present. Expressed mathematically, we can say that:
RH = e/es x 100 (Units: %)
or
RH = ρ/ρs x 100 (Units: %)
or
RH = r/rs x 100 (Units: %)
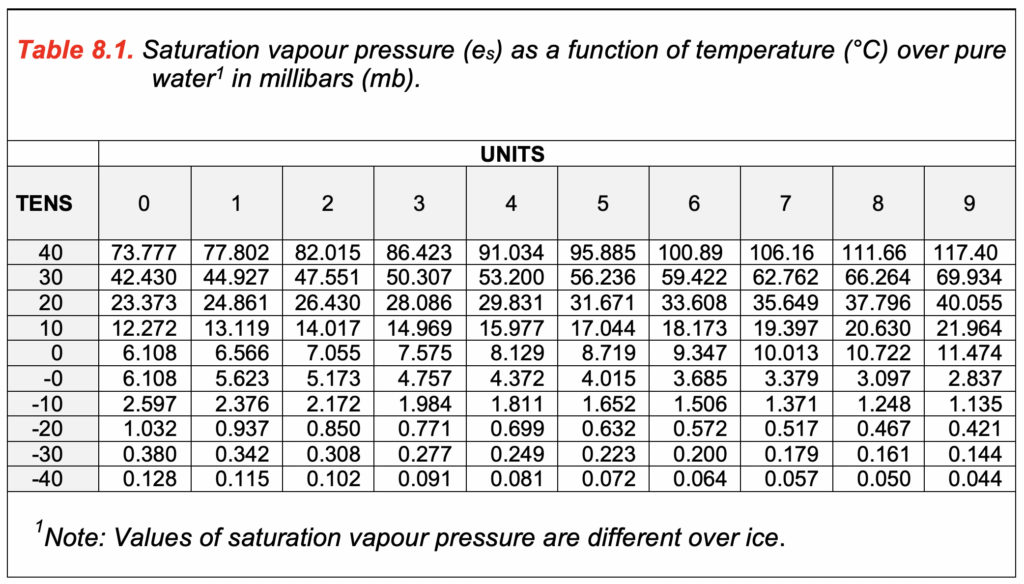
where es is the vapor pressure for saturated air at a given temperature; ρs is the absolute humidity for saturated air at a given temperature; and rs is the mixing ratio for saturated air at a given temperature. A relative humidity of 100% indicates saturation and usually results in condensation.
Table 8.1 shows the vapor pressure of saturated air:
Another important expression that can be used as a measure of atmospheric humidity is the dew point (if the dew point is below freezing, it is also referred to as the frost point). Dew point refers to the temperature at which water vapor condenses in an air mass into liquid or solid, usually forming rain, snow, frost or dew. In general, we can determine the amount of moisture in a mass of air by comparing its dew-point temperature to the actual temperature of the air mass. The greater the difference, the drier the air. According to the equations above, dew point occurs when a mass of air has a relative humidity of 100%. This happens in the atmosphere as a result of cooling through a number of different processes. Following saturation, the amount of extra cooling partially determines the quantity of water that precipitates out.
PSYCHROMETRIC TABLES
One method of measuring humidity is by using a sling psychrometer, which contains a wet-bulb thermometer (Tw) and dry-bulb thermometer (Td) . The dry-bulb is usually an ordinary mercury thermometer, while the wet-bulb is a mercury thermometer with a cloth sleeve over the bulb; the wick is moistened with water and the instrument is twirled around causing a continuous and rapid current of air to pass over the wick. If the relative humidity of the air is less than 100%, the wet-bulb thermometer cools because of evaporative cooling from the wick until equilibrium is reached between the heat flow away from the wet thermometer and that from the surrounding air with its moisture. If the air is dry, a great deal of heat will be lost until equilibrium is reached, and Tw will be much lower than Td. Conversely, the wet-bulb temperature and the dry-bulb temperature will be similar when the air is near saturation. The psychrometric tables shown in Tables 8.2a and 8.2b describe the relationships between air temperature and wet-bulb temperature in terms of relative humidity and dew point.
![]()
![]()
PRECIPITATION MECHANISMS
We can broadly define precipitation as any aqueous deposit, in liquid or solid form, derived from the atmosphere. Generally, precipitation occurs in any air mass where the relative humidity is at or near 100%. This usually arises when an air mass is cooled to dew point. The following mechanisms or processes can achieve this outcome:
- Orographic precipitation occurs when air is forced to rise over hills or mountains. As the parcel rises it cools adiabatically at a rate of ~10°C/1000 m until saturation occurs and clouds form. The large amounts of precipitation along the west coast of Canada are due mainly to this process.
- Convectional precipitation is associated with the heating of the air located at the ground surface. If enough heating occurs, the mass of air becomes warmer and lighter than the air in the surrounding environment, and just like a hot air balloon, it begins to rise, expand and cool. When sufficient cooling has taken place to force the air to dew point, saturation occurs, and clouds form. This process is often active in the interior of continents and near the Equator, typically forming cumuliform clouds. Rain is usually the precipitation type that is formed, and in most cases, this moisture is delivered in large amounts over short periods of time in localized areas.
- Convergence or frontal precipitation takes place when two air masses come together. In most cases, the two air masses have different climatological characteristics. One is usually warm and moist, while the other is cold and dry. The leading edge of the latter air mass acts as an inclined wall or front causing the moist warm air to be lifted. Of course, the lifting causes the warm moist air mass to cool due to expansion resulting in saturation. This precipitation type is common at the mid-latitudes where cyclones form along the Polar Front.
- Radiative cooling occurs when the sun is no longer supplying energy to the ground and overlying air (i.e. at night). The surface of the Earth loses energy due to a negative longwave radiation balance; this causes the ground and the overlying air to cool down. Typical precipitation that results from this process takes the form of frost, dew, or fog.
The above processes do not always act singularly – it is possible to get combinations of all four types (e.g. when convection and orographic uplift combine to cause summer afternoon showers in the mountains).
GLOBAL DISTRIBUTION OF PRECIPITATION
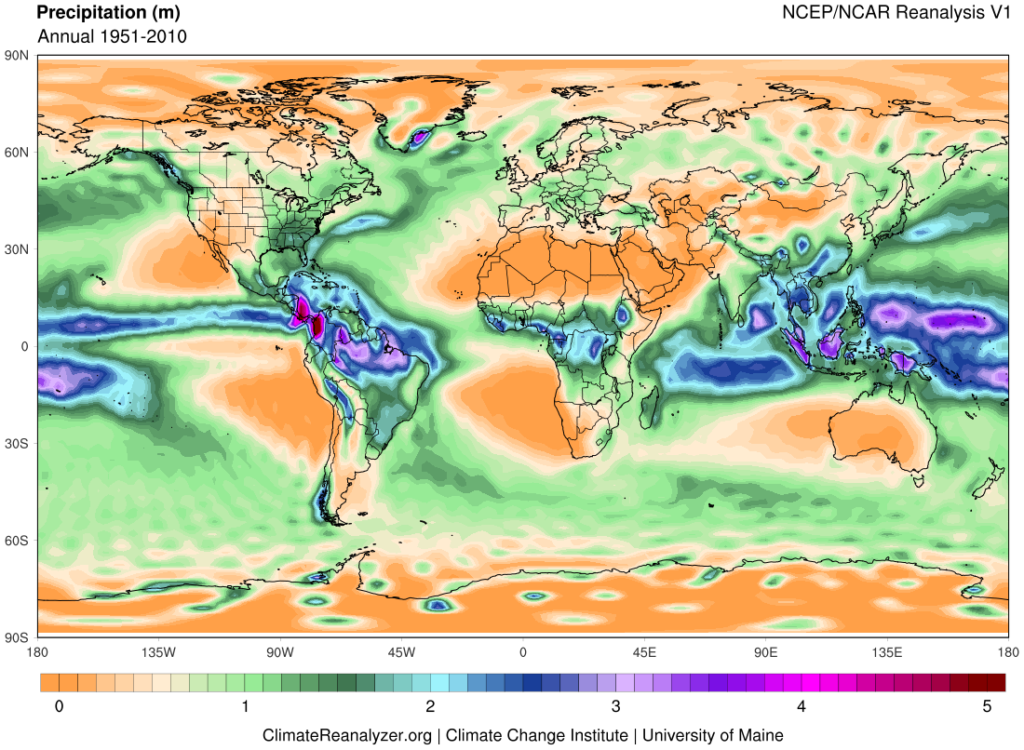
Previously it was stated that the mean annual global precipitation of the world is ~1050 mm (or 88 mm per month, or 2.9 mm per day). However, actual values do vary greatly from location to location (see Figure 8.2). The reasons for the observed distribution include:
- Deserts in subtropical regions occur because these areas do not contain any mechanism for lifting air masses. In fact these areas are dominated by subsiding air that results from global circulation patterns.
- Continental interiors tend to be dry because of their distance from moisture sources.
- Polar areas are dry because only small amounts of water vaporrainshadow effect can exist in very cold air.
- Areas near the Equator experience high rainfall amounts because strong solar heating encourages convection, and global circulation patterns cause northern and southern air masses to converge here.
- Mid-latitudes experience cyclonic activity and frontal lifting when polar and subtropical air masses meet at the Polar Front. Further, the air masses in this region generally move from west to east, causing amounts of precipitation to decrease east of source regions.
- Mountain ranges near water sources can receive high rainfalls because of orographic uplift if the prevailing winds are in their favor. This can also result in a sharp reduction in rainfall in regions adjacent or on the leeward slopes of these areas. This phenomenon is commonly known as the rainshadow effect.
LABORATORY 8 QUESTIONS
QUESTION 1
Using a sling psychrometer (this will be demonstrated by your Teaching Assistant or Instructor), measure the dry bulb and wet bulb temperatures of the air in the lab room, and then go outside (move away from buildings, vehicles, etc.) and repeat the measurements. Record the data below and calculate values for the various questions that follow. You will need to draw upon several sources of information in order to fill in all the answers.
Time/Date
Time & date of measurements: ____________________
INSIDE AIR
Location Inside
Location of inside measurements: ____________________
1.1) Dry bulb temperature (Td) = _____________°C
1.2) Wet bulb temperature (Tw) = _____________°C
1.3) Wet bulb depression value (Td – Tw) = _____________°C
1.4) Dewpoint temperature (Tdew) = _____________°C
1.5) Relative humidity (RH) = _____________%
1.6) Saturation absolute humidity (ρs) = _____________ g cubic meter
1.7) Absolute humidity (ρ) = _____________ g cubic meter
1.8) Saturation vapour pressure (es) = _____________ mb
1.9) Vapour pressure (e) = _____________ mb
OUTSIDE AIR
Location Outside
Location of outside measurements: ____________________
1.10) Dry bulb temperature (Td) = _____________°C
1.11) Wet bulb temperature (Tw) = _____________°C
1.12) Wet bulb depression value (Td – Tw) = _____________°C
1.13) Dewpoint temperature (Tdew) = _____________°C
1.14) Relative humidity (RH) = _____________%
1.15) Saturation absolute humidity (ρs) = _____________ g cubic meter
1.16) Absolute humidity (ρ) = _____________ g cubic meter
1.17) Saturation vapour pressure (es) = _____________ mb
1.18) Vapour pressure (e) = _____________ mb
QUESTION 2
Using the psychrometric Tables 8.2a and 8.2b (also available as PDF file below), complete the following questions:
2.1) Td = 24.0 °C, Tw = 18.0 °C
Calculate (Td – Tw) = _____________ °C
2.2) Td = 24.0 °C, Tw = 18.0 °C
Calculate RH = _____________ %
2.3) Td = 24.0 °C, Tw = 18.0 °C
Calculate Tdew = _____________ °C
2.4) Td = 18.0 °C, (Td – Tw) = 4.0 °C
Calculate Tw = _____________ °C
2.5) Td = 18.0 °C, (Td – Tw) = 4.0 °C
Calculate RH = _____________ %
2.6) Td = 18.0 °C, (Td – Tw) = 4.0 °C
Calculate Tdew = _____________ °C
2.7) Tw = 12.0 °C, RH = 100 %
Calculate Td = _____________ °C
2.8) Tw = 12.0 °C, RH = 100 %
Calculate (Td – Tw) = _____________ °C
2.9) Tw = 12.0 °C, RH = 100 %
Calculate Tdew = _____________ °C
2.10) Tw = 10.0 °C, Tdew = 3.9 °C
Calculate Tw = _____________ °C
2.11) Tw = 10.0 °C, Tdew = 3.9 °C
Calculate (Td – Tw) = _____________ °C
2.12) Tw = 10.0 °C, Tdew = 3.9 °C
Calculate RH = _____________ %
QUESTION 3
3.1) Using Table 8.1, calculate the change in saturation vapor pressure for each of the following 1°C drops in temperature. Give your answers to 3 decimal places.
3.1a) -15°C to -16°C, the change in saturation vapor pressure = _____________ mb (give positive value)
3.1b) -6°C to -7°C, the change in saturation vapor pressure = _____________ mb (give positive value)
3.1c) 5°C to 4°C, the change in saturation vapor pressure = _____________ mb (give positive value)
3.1d) 17°C to 16°C, the change in saturation vapor pressure = _____________ mb (give positive value)
3.1e) 25°C to 24°C, the change in saturation vapor pressure = _____________ mb (give positive value)
3.1f) Is the relationship shown between temperature and saturation vapor pressure, linear or exponential?
A Linear.
B Exponential.
3.2) Figure 8.3 shows the relationship between temperature and saturation absolute humidity (ρs). The data in Table 8.1 was used to construct this graph. Using Figure 8.3, estimate the difference in the amount of precipitation that would result from two parcels of saturated air having different initial temperatures but subject to identical decreases in temperature. Give your answers to the nearest whole number.
3.2a) Absolute humidity at 5°C = _____________ mb (give positive value)
3.2b) Absolute humidity at 0°C = _____________ mb (give positive value)
3.2c) Potential precipitation available with a cooling from 5°C to 0°C = _____________ mb (give positive value)
3.2d) Absolute humidity at 25°C = _____________ mb (give positive value)
3.2e) Absolute humidity at 20°C = _____________ mb (give positive value)
3.2f) Potential precipitation available with a cooling from 25°C to 20°C = _____________ mb (give positive value)
3.2g) Is the relationship shown between temperature and saturation absolute humidity, linear or exponential?
A Linear.
B Exponential.
3.3) All precipitation on our planet is the product of condensation or deposition from saturated air, which is cooled by any of several mechanisms to below its dew point or frost point. From questions 3.1 and 3.2, what can you conclude about the amounts of precipitation that would expect to be derived from a cold cloud versus a warm cloud? Explain.
QUESTION 4
Assume that weather conditions at 2:00 PM are T = 22°C, e = 16.930 mb, and the forecast overnight minimum temperature is 12°C.
4.1) Calculate the relative humidity at 2:00 PM. Show how you calculated your answer. (Hint: use Table 8.1.)
4.2) What is the dew point of the air mass at 2:00 PM? Explain how you found your answer. (Hint: use Table 8.2.)
4.3) Based on your answer to (4b), will dew form overnight? Explain your reasoning.
QUESTION 5
Use the following web link to go to Climate Reanalyzer, Monthly Reanalysis Maps.
https://climatereanalyzer.org/reanalysis/monthly_maps/
Create a global map showing annual average precipitable water for the 30-year period 1981-2010 with the following inputs.

Meteorologists use radiosonde and satellite data to derive the quantity of precipitable water in the atmosphere. In the map that you have produced, is determined for a column of atmosphere extending from the Earth’s surface to an altitude of approximately 3 kilometers and is measured in kilograms of water per square meter (kg m-2). This measurement is very important in weather forecasting because it can be used to estimate how much precipitation may fall to the ground.
Answer the following questions.
5.1) Generally, where is precipitable water higher?
A Over land surfaces.
B Over ocean surfaces.
5.2) Explain the answer you gave in Question 5a.
5.3) Which area of our planet listed below has the lowest amount of precipitable water?
A Sahara Desert.
B Antarctica.
C Siberia.
D Tibetan Plateau.
5.4) Which area of our planet listed below has the highest amount of precipitable water?
A Area around Indonesia.
B India.
C Central Africa.
D Southeastern USA.
Create a SECOND global map showing Winter Season (DJF – December/January/February) average precipitable water for the 30-year period 1981-2010 with the following inputs. Create this map in a separate window so you can make comparisons to the annual average.

Answer the following questions.
5.5) Relative to the annual plot, what happens to precipitable water in the Northern Hemisphere during the months of December, January, and February?
Create a THIRD global map showing Summer Season (JJA – June/July/August) average precipitable water for the 30-year period 1981-2010 with the following inputs. Create this map in a separate window so you can make comparisons to the annual average.

Answer the following questions.
5.6) Relative to the annual plot, what happens to precipitable water in the Northern Hemisphere during the months of June, July, and August?
QUESTION 6
Use the following web link to go to Climate Reanalyzer, Monthly Reanalysis Maps.
https://climatereanalyzer.org/reanalysis/monthly_maps/
Create a map of North America showing annual average precipitation for the 30-year period 1981-2010 with the following inputs.

Answer the following questions.
6.1) What two regions of North America have relatively high amounts of precipitation annually? (Multiple answers: Multiple answers are accepted for this question)
A Northern Canada.
B Coastal Western Canada and Northwest USA.
C California and Northwestern Mexico.
D Eastern USA and Canada.
E Central North America.
6.2) What two regions of North America have relatively low amounts of precipitation annually?
A Northern Canada.
B Coastal Western Canada and Northwest USA.
C California and Northwestern Mexico.
D Eastern USA and Canada.
E Central North America.
Create a SECOND North American map showing Winter Season (DJF – December/January/February) average precipitation for the 30-year period 1981-2010 with the following inputs. Create this map in a separate window so you can make comparisons to the annual average.

Answer the following questions.
6.3) What region of North America has relatively high amounts of precipitation during the winter season?
A Northern Canada.
B Coastal Western Canada and Northwest USA.
C California and Northwestern Mexico.
D Eastern USA and Canada.
E Central North America.
6.4) What factors are responsible for the high amounts of precipitation in the region identified in question 6c? Explain.
6.5) Why is it so dry in the other parts of North America? Explain fully.
Create a THIRD North American map showing Summer Season (JJA – June/July/August) average precipitation for the 30-year period 1981-2010 with the following inputs. Create this map in a separate window so you can make comparisons to the annual average.

Answer the following questions.
6.6) What region of North America has relatively high amounts of precipitation during the summer season?
A Northern Canada.
B Coastal Western Canada and Northwest USA.
C California and Northwestern Mexico.
D Eastern USA and Canada.
E Central North America.
6.7) What factors are responsible for the high amounts of precipitation in the region identified in question 6.6? Explain.
IMAGE CREDITS
Figure 8.1: Image Source: Climate Reanalyzer, Monthly Reanalysis Maps. Data Source: NOAA National Center for Environmental Prediction, National Center for Atmospheric Research dataset version 1. Public Domain.
Figure 8.2: Image Copyright Michael Pidwirny.
QUESTION ANSWER SHEET
FIGURES AND TABLES – PDF FILES
This Laboratory Exercise is Licensed Under Attribution-NonCommercial-NoDerivatives 4.0 International (CC BY-NC-ND 4.0).
Updated April 4, 2021
A generalized model that describes the movement of water between the hydrosphere, lithosphere, atmosphere, and biosphere. Also called the hydrological cycle.
Is any aqueous deposit, in liquid or solid form, that develops in a saturated atmosphere (relative humidity equals 100%) and falls to the ground generally from clouds. Most clouds, however, do not produce precipitation. In many clouds, water droplets and ice crystals are too small to overcome natural updrafts found in the atmosphere. As a result, the tiny water droplets and ice crystals remain suspended in the atmosphere as clouds. Some forms of precipitation include rain, snow, drizzle, hail, ice pellets, and snow pellets.
Evaporation can be defined as the process by which liquid water is converted into a gaseous state. Evaporation can only occur when water is available. It also requires that the humidity of the atmosphere be less than the evaporating surface (at 100% relative humidity there is no more evaporation). The evaporation process requires large amounts of energy. For example, the evaporation of one gram of water at a temperature of 100°C requires 540 calories of heat energy (600 calories at 0°C).
Transpiration is the process of water loss from plants through stomata. Stomata are small openings found on the underside of leaves that are connected to vascular plant tissues. Some dry environment plants have the ability to open and close their stomata. Transpiration is a passive process largely controlled by the humidity of the atmospheric and the moisture content of the soil. Of the transpired water passing through a plant only about 1% is used in the growth process. Transpiration also transports nutrients from the soil into the roots and carries them to the various cells of the plant.
Process that involves the transfer of mass and heat energy using horizontal motions through a fluid substance like air or water.
Amount of water potentially available in the atmosphere for precipitation. Usually measured in a vertical column that extends from the Earth's surface to the upper edge of the troposphere.
A general term used to describe the amount of water vapor found in the atmosphere. Also see relative humidity, vapor pressure, and mixing ratio.
The pressure exerted by water vapor molecules in a given quantity of atmosphere.
A measurement of humidity in the atmosphere. Absolute humidity is the mass of water vapor in a given volume of air (this measurement is not influenced by the mass of the air). This measurement is normally expressed in grams of water vapor per cubic meter (g/m3 or g m-3) of atmosphere at a specified temperature.
The ratio between the weight (mass) of water vapor (or some other gas) held in the atmosphere compared to the weight of the dry air in a given volume of air. Usually measured in grams water vapor (or gas) per kilogram of dry air.
The ratio between the actual amount of water vapor held in the atmosphere compared to the amount required for saturation. Relative humidity is influenced by temperature and atmospheric pressure.
Is the temperature at which water vapor saturates from an air mass into liquid forming rain or dew. Dew point normally occurs when a mass of air has a relative humidity of 100% and temperatures are above 0°C. If the dew point is below freezing, it is referred to as the frost point.
The temperature at which water vapor saturates in an air mass into solid, usually forming snow or frost. The frost point occurs normally at a temperature at 0°C or less and when a mass of air has a relative humidity of 100%.
Scientific instrument used to measure dew point and relative humidity. This type of psychrometer consists of two thermometers (dry-bulb thermometer and a wet-bulb thermometer) incased in a housing (see image). It uses a rotating handle and a twirling motion to ventilate its wet-bulb thermometer.
One of two thermometers on a sling psychrometer that has a moistened cotton wick on its reservoir bulb. When ventilated this thermometer records a temperature that is modified by the cooling effects of evaporation. This measurement and the temperature reading from a dry-bulb thermometer are then used to determine the air's relative humidity or dew point from a psychrometric table.
One of two thermometers on a sling psychrometer used to measure current air temperature. This measurement and the reading from a wet-bulb thermometer are then used for the determination of relative humidity or dew point from a psychrometric table.
Device used to measure temperature. A variety of different devices have been invent to measure temperature by converting some physical change into a numerical value. Some of the methods employed in these devices include thermal expansion of substances, pressure changes associated with substances, and the measurement of electromagnetic radiation emission.
Table of values that allows for the determination of relative humidity and dew point from dry-bulb and wet-bulb temperatures recorded on a psychrometer.
Area of low pressure in the atmosphere that displays circular inward movement of air near the ground surface. In the Northern Hemisphere circulation is counterclockwise, while Southern Hemisphere cyclones have clockwise wind patterns. A term can be used to refer to mid-latitude cyclones, tropical storms, and hurricanes.
Weather front located typically in the mid-latitudes that separates arctic and polar air masses from tropical air masses. Along the polar front we get the development of the mid-latitude cyclone. Above the polar front exists the polar jet stream.
Process where an object cools in temperature and experiences a reduction in internal heat energy because of the net loss of electromagnetic radiation. This net loss of radiation occurs because outgoing radiation exceeds incoming radiation for the object.
The reduction of precipitation commonly found on the leeward side of a mountain. This reduction in precipitation is the result of compression warming of descending air.
