Michael Pidwirny
LABORATORY 9: CLIMATE AND THE DISTRIBUTION OF BIOMES AND SOILS
LEARNING GOALS
The objectives of this laboratory are to familiarize you with the location of the major (plant) biomes and soil types, and the causal relationships that exist between climate, plants, and soils. We will also examine how predicted climate change by the end of the 21st century will alter the geographic distribution of our planet’s biomes.
Upon completion of this laboratory you will be able to:
- Describe the location of the major soil and biome types.
- Visualize the relationship between climate and soil and biome distributions.
- Understand the role of plant communities in soil formation.
- Describe how the major biomes on our plant will shift with climate change in the 21st century.
TEMPERATURE, MOISTURE, AND PLANT DISTRIBUTION
All living organisms are affected by heat or energy conditions. Physiological processes in plants are strongly controlled by temperature according to a simple thermodynamic rule: a rise of temperature of 10°C usually causes a doubling or tripling of the rates of chemical reactions within the plant, which in turn increases the growth rate of the plant. This rule applies until lethally high temperatures are reached.
Water is important to plant life for a number of reasons. It participates in numerous chemical reactions in plant cells, of which the most important is photosynthesis. Water acts as a solvent and a transporting agent moving vital soil nutrients and photosynthetic by-products throughout the plant’s structure. In general, the absorption of water by a plant is controlled by the amount being lost from aerial parts by transpiration, in which the amount of water lost is controlled by the plant’s stomata in the leaves.
The distribution of species on the Earth is primarily a function of their tolerance to the ambient temperature and moisture. These variables often define the boundaries of a species’ geographic range. Rarely do two species have exactly the same requirements. Each species on the Earth has evolved a certain number of physiological and morphological traits that permit them to best survive in a particular environment. For example, deserts are dominated by plants with well-developed adaptations for conserving water, and fast-growing annuals which can run through their complete life-cycle on the water delivered by one rainy spell.
PLANT GROWTH FORMS AND EARTH’S BIOMES
The various plant growth forms that occur on the Earth are the result of functional species adaptations to the variety of terrestrial environments. These adaptations determine whether a species can inhabit a particular set of environmental conditions. For example, in areas where precipitation is high, the usual dominant growth form is that of a tree. In contrast, short forms of vegetation, like grasses and herbaceous plants, grow where moisture is limiting or where temperatures are extremely low or high. The most important growth forms of terrestrial plants are shown in Table 9.1.
Table 9.1. Major growth forms of land plants.
| Trees: Larger woody plants, usually with a single stem and have a height greater than 6 meters.
Needle-leaf evergreen trees, are mainly conifers with thin needle-like leaves found in the middle to high latitudes some species drop their leaves during the winter to reduce moisture loss. Broadleaf evergreen trees, occur mainly in the tropics and subtropics and have medium-sized leaves. Broadleaf deciduous trees, shed their leaves in the tropical dry season or in the temperate because of the cold temperatures associated with winter. |
| Shrubs: Woody plants usually between 2 to 6 meters in height. Most shrubs have broadleaves and are deciduous. Leaves are shed because of drought or cold temperatures. In Mediterranean and desert locations, shrubs are often evergreen and protected by thorns. |
| Stem-succulents or Cacti: Are specially adapted plants without leaves. They grow in environments where moisture loss is a problem because of high temperatures and insufficient precipitation. These plants are often protected from consumption by herbivores by the presence of thorns. |
| Lianas: Woody climbers or vines common to habitats dominated by trees. Liana’s do have roots below the ground surface. |
| Epiphytes: Plants growing entirely above the ground surface, on other plants. |
| Herbs: Leafy flowering plants with soft green stems. Herbs do not have perennial aboveground woody stems. |
| Ferns: Leafy vascular plants that reproduce through spores not seeds. |
| Grasses: Are plants with long narrow leaves that grow from the ground base. Most species of grass belong to the plant family Poaceae. Also includes sedges and other grass-like plants. |
| Mosses: Small non-vascular plants that do not have roots. Reproduce through spores not seeds. |
| Lichens: A symbiotic organism consisting of a fungus and a species of algae or cyanobacterium. |
Scientists group the various ecosystems that occupy the terrestrial areas on our planet into more general associations called biomes. One such biome is Tropical Rain Forest. This biome is found in a broad zone that circles the Earth’s equator. Despite looking very similar, tropical rain forests found in Brazil do not contain the same mix of species as tropical rain forests in Africa. So what makes them the same biome? These ecosystems are considered to be the same biome because they have species with similar adaptive strategies for survival.
Many places on Earth share similar climatic characteristics despite being found in areas with different geography. As a result of natural selection, comparable ecosystems containing species with similar strategies for survival have developed in these separated areas with like climates. Consequently, the geographical distribution of the various biomes is controlled primarily by the climatic variables precipitation and temperature and the seasonal distribution of these two factors.
The map in Figure 9.1 describes the geographical locations of the major terrestrial biomes of the world based on the work of Olson et al. 2001 (a high-resolution copy of this map can be found in the file Lab9_Figure_9.1.pdf). Fourteen unique biomes are identified on this map.

Figure 9.1. Global distribution of the Earth’s thirteen major terrestrial biomes. Image Copyright: Michael Pidwirny, Data Source: Olson, D.M. et al. 2001. Terrestrial ecoregions of the world: A new map of life on Earth. BioScience, 51(11): 933-938.
The following discussion describes the characteristics of a subset of eleven terrestrial biomes which we will examine in this laboratory exercise.
TUNDRA
The geographical distribution of the Tundra biome is roughly poleward of 65° North latitude. Within the Tundra biome, temperature, precipitation, and evaporation all tend to be at a minimum. This fact has played an important role in the evolution of adaptations for plant and animal survival. This biome is characterized by the absence of trees and the presence of low-lying shrubs, mosses, and lichens.
BOREAL FORESTS
Boreal Forest or Taiga biome lies mainly between 50 and 65° North latitude. The climate of this biome is cold but with more precipitation than the Tundra. Precipitation here occurs mainly in the summer. The predominant vegetation of the Boreal Forest biome are cone-bearing needle-leaf evergreen varieties of tree species.
TEMPERATE CONIFEROUS FORESTS
Temperate Coniferous Forests are found south (in the Northern Hemisphere) of the Boreal Forests in warmer and wetter regions of the temperate mid-latitudes. Coniferous trees here belonging to species not found in the Boreal Forests. Because of the better climate, these forests are also more productive than the Boreal Forests.
TEMPERATE BROADLEAF AND MIXED FORESTS
The Temperate Broadleaf and Mixed Forests biome (also called Temperate Deciduous Forest) is characterized by a moderate temperate climate and a dominance of broadleaf deciduous trees. This biome once occupied much of the eastern half of the United States, central Europe, Korea, and China. Over the last few centuries, this biome has been very extensively affected by human activity. Much of it has been converted into agricultural fields or urban land-use.
TEMPERATE GRASSLANDS, SAVANNAS AND SHRUBLANDS
The Temperate Grasslands, Savannas and Shrublands biome (also called Prairie) once covered much of central North America, Eurasia, Australia, and South America. Before the arrival of humans, these biomes were dominated by various species of grass. Today, most of this natural land-cover has been converted into cropland.
MONTANE GRASSLANDS AND SHRUBLANDS
The Montane Grasslands and Shrublands biome is found at high elevations in temperate, subtropical, and tropical climates. This biome is dominated by grass and shrub species and tends to have a high number of endemic plants and animals.
DESERTS AND XERIC SHRUBLANDS
Deserts and Xeric Shrublands biome covers about 19% of the Earth’s ground surface. Dominant plants in this biome include drought-resistant shrubs like the Creosote Bush (Larrea divaricata) and Sagebrush (Artemisia tridentata), water-storing succulents like cactus, and many species of short-lived annuals that complete their life cycles during infrequent and short rainy periods. Lastly, desert habitats can be completely devoid of vegetation if precipitation is scarce.
MEDITERRANEAN FORESTS, WOODLANDS AND SCRUB
The Mediterranean Forests, Woodlands and Scrub biome (also called Chaparral) is found in a narrow zone between 32 and 40° latitude North and South on the west coasts of the continents. This area has a dry climate because of the dominance of the subtropical high-pressure zone during the fall, summer, and spring months. Precipitation falls mainly in the winter from the influence of mid-latitude cyclones. The vegetation of this biome consists of many different types of annuals and drought-resistant, evergreen, short woody shrubs and trees.
TROPICAL AND SUBTROPICAL GRASSLANDS, SAVANNAS AND SHRUBLANDS
The Tropical and Subtropical Grasslands, Savannas and Shrublands biome covers extensive areas in eastern Africa, South America, and Australia. It has distinct wet and dry seasons and temperatures that are hot all year long characterize the climate of this biome. Plant life consists of a cover of perennial grass species 1 to 2 meters tall with scattered drought-resistant trees. Tree and shrub species in the savanna usually drop their leaves during the dry season. Annual rainfall varies between 900-1500 millimeters.
TROPICAL AND SUBTROPICAL DRY BROADLEAF FORESTS
The Tropical and Subtropical Dry Forests biome is found in southern Mexico, southeastern Africa, central India, Indochina, Madagascar, New Caledonia, eastern Bolivia, central Brazil, the Caribbean, and along the coasts of Peru and Ecuador. This biome exists as a zone that borders the Tropical and Subtropical Moist Broadleaf Forests biome. Because of its geographical location, the Tropical and Subtropical Dry Forest experiences a dry season that lasts several months. This biome is home to tropical deciduous trees like Teak (Tectona grandis), Mahogany (Swietenia mahagoni, S. macrophylla, and S. humilis), and Mountain Ebony (Bauhinia variegata) dominate these forests. During the seasonal drought, these trees loose their leaves to conserve water.
TROPICAL AND SUBTROPICAL MOIST BROADLEAF FORESTS
The Tropical and Subtropical Moist Broadleaf Forests biome occurs in a zone about 10° of latitude on either side of the equator. Annual rainfall generally exceeds 2000 millimeters and is evenly distributed throughout the year. Temperature and humidity are relatively high throughout the year. Plant life is highly diverse: a typical hectare may contain as many as 300 different tree species as compared to 20 to 30 in the temperate zone.
ENERGY AND MOISTURE RELATIONSHIPS
In the previous section, energy (temperature) and moisture were identified as being important in determining the global distributional patterns of vegetation. In this laboratory exercise, however, we will use two specific variables to approximate the climatic parameters of temperature and moisture. These variables are potential evapotranspiration (PE) and moisture index (Im).
Potential evapotranspiration (PE) can be defined as a measure of the demand for moisture for plant transpiration and soil evaporation, both of which generally increase with intensifying heat or energy supply. Thus, we would expect to find a simple latitudinal relationship for potential evapotranspiration with the highest values near the Equator and the lowest values at the poles.
The moisture index (Im) approximates how well the available supply of moisture from precipitation is able to offset the potential demand for moisture (potential evapotranspiration). This index is calculated as:
Im = (P/PE – 1) x 100
where P is the annual precipitation, and PE is the annual potential evapotranspiration. If annual precipitation is equal to annual potential evapotranspiration then the index is equal to zero, and plant needs for water are met by annual precipitation. Positive values indicate more precipitation than potential evapotranspiration. Negative values indicate less precipitation then potential evapotranspiration, and under these conditions plants must adapt to drought stress by reducing biomass accumulation and evolve morphological and physiological traits that restrict water loss from plant tissues.
SOIL FORMING FACTORS
Five factors are generally thought to be responsible for the formation of soils. These factors are: climate; organisms; topography; parent material; and time. We can model the action of these factors on soil and soil properties with the following simple equation:
Soil = f(cl, o, r, pm, t, …)
where soil formation is a function (f) of the factors within the brackets, cl denotes the climate factor, o the biotic factor, r the topographic factor, pm the parent material, t the time factor, and the dots after t represent undefined factors.
On a global scale, climate is probably the most important factor is the formation of a soil because it determines the nature and rate of parent material weathering, and type of organisms located on and within the soil. In humid regions, abundant rainfall provides an environment favourable for the tree growth. The combination of this vegetation type and a humid climate results in the chemically aided formation of podzolic or brunisolic (brown) soils in the mid-latitudes, and red and yellow latosolic soils near the tropics. In contrast, semi-arid regions are dominated by short-grassland species, and the climatic and vegetative conditions tend to form chernozems, which are characterized by an organic rich dark-brown to black upper horizon that is produced by the decomposition of plant material. In the high latitudes and alpine areas, cold temperatures inhibit the action of the soil forming factors, and these areas are dominated by immature soils which are either gleysols or cryosols. Poorly developed soils are also common is hot and dry regions of the world. In such conditions, sparse desert vegetation add little organic matter to the soils surface and the lack of moisture inhibits normal soil chemical reactions.
Soil organisms play an important role in soil profile formation on the macro and micro-scale. Organic matter accumulation, profile mixing, nutrient cycling, and structural stability in soils are all enhanced by soil organisms. As previously discussed, the effect of vegetation on soil formation can be seen by comparing soils formed under forest and grassland ecosystems. The dark colour of the grassland chernozemic soils occurs because organic matter and humus content of grassland soils is higher than forest soils. Higher organic content gives these soils a darker colour and higher moisture and nutrient-holding capacity. In forest soils the litter from falling tree leaves produces acidic leachates upon decomposition. These acidic substances move down through the soil profile leaching iron, aluminium and humus from upper soil horizons. Thus, podzolic soils are easily recognized by the presence of a grey leached horizon followed by a yellow to reddish horizon where there is an accumulation of iron, aluminium, and humus.
LABORATORY 9 QUESTIONS
QUESTION 1
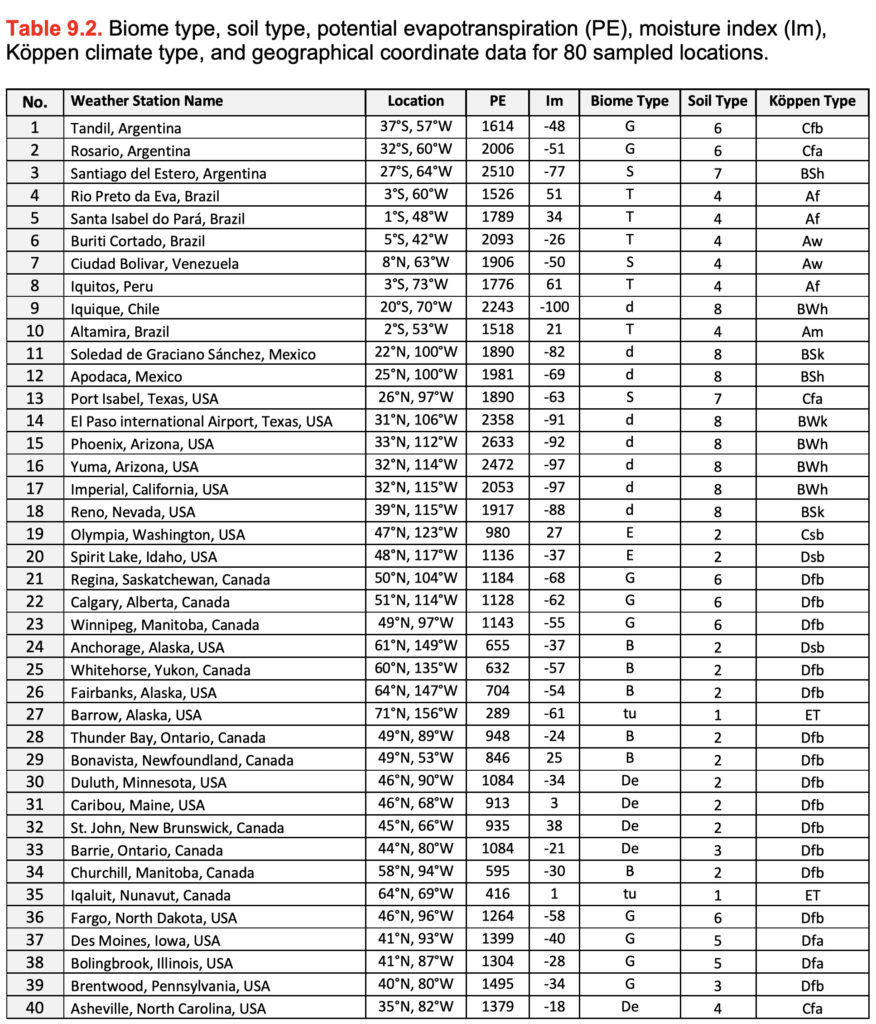
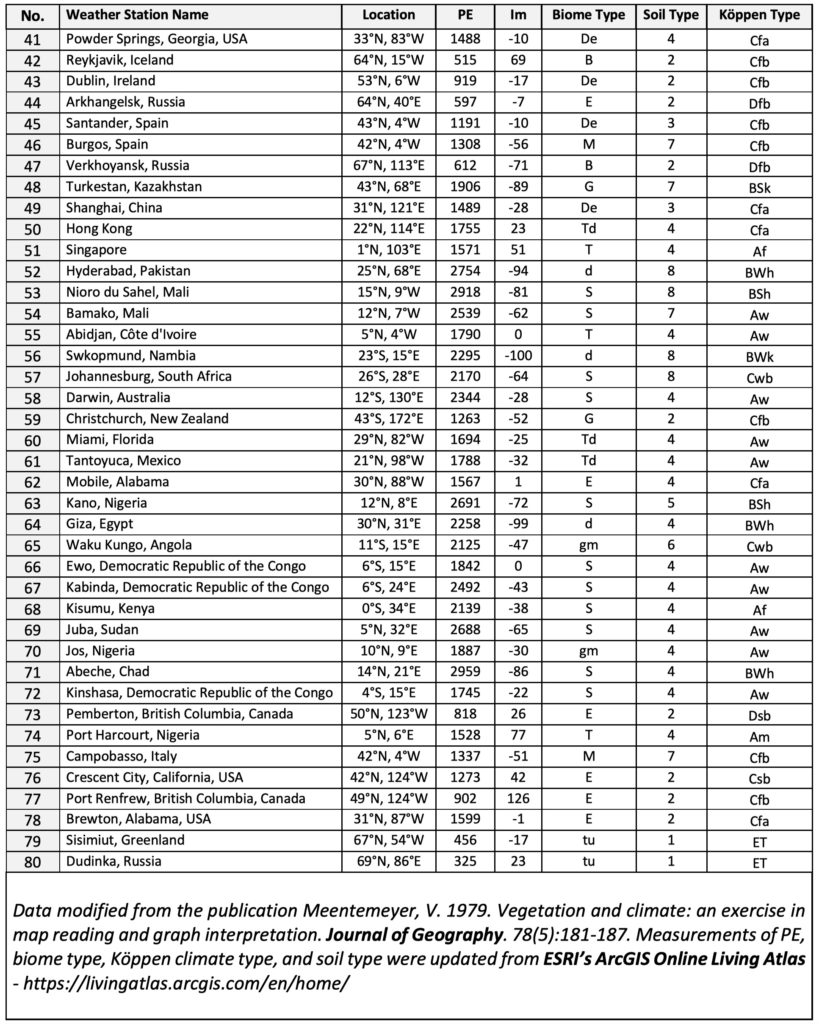
Table 9.2 describes biome and soil type data for 80 locations scattered across our planet. This data has been plotted on Figures 9.2 and 9.3 for you.
Visually analyze the distribution of the plotted biome data and identify obvious clusters on the graph. Note that in some cases, one type may overlap with another type, but in others only one group will be found in a particular part of the graph. On this graph, the following “colored letters” are used to identify the various biomes described below.
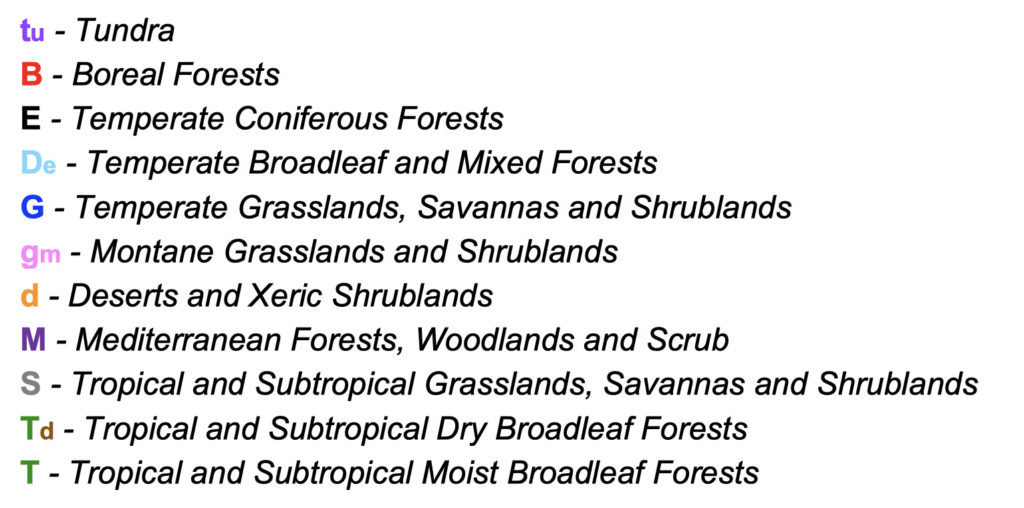
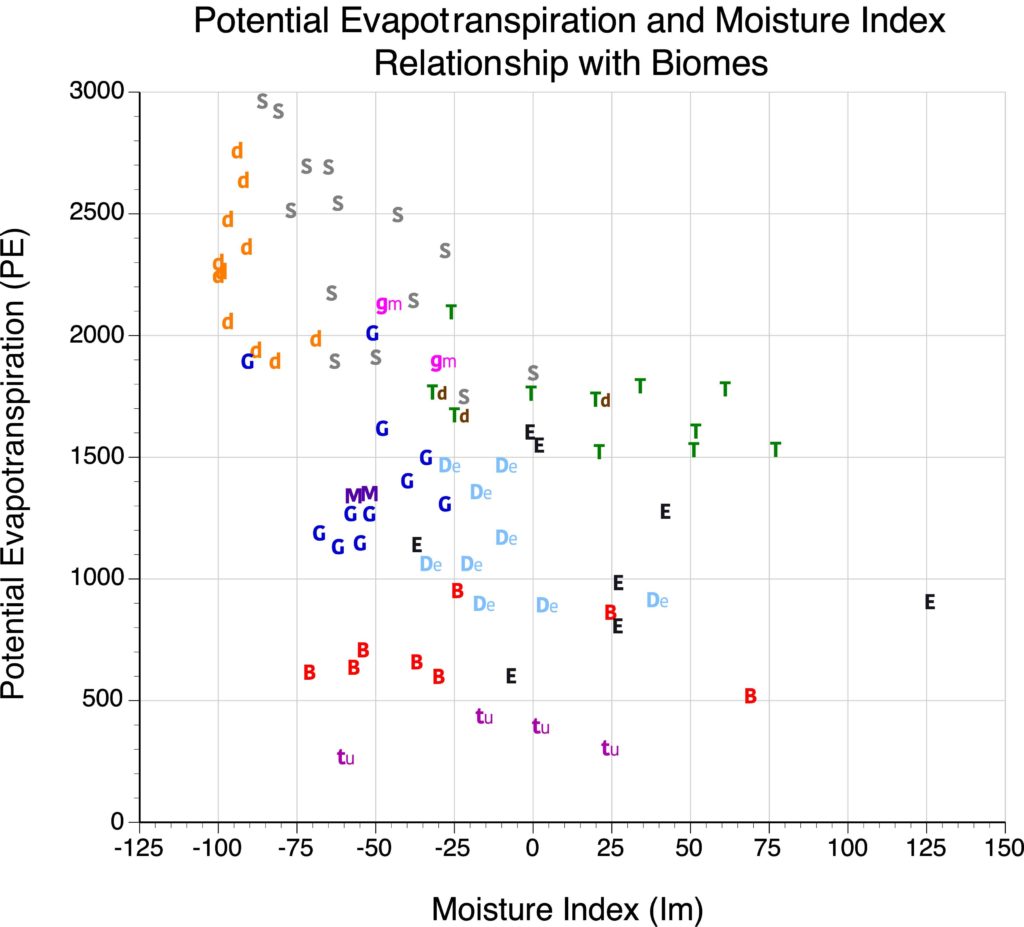
Figure 9.2. Plot of 80 locations with biome types, and measurements of potential evapotranspiration and moisture index.
Answer the questions that follow:
1.1) The Tundra (tu) biome has Potential Evapotranspiration values that range from
A 250-500.
B 500-1000.
C 1000-1500.
D 1500-2000.
1.2) Geographically, where is the Tundra (tu) biome found?
A Poleward of 65° North.
B Between 55 and 65° North.
C Central Greenland.
D Central Antarctica.
1.3) After carefully examining Table 9.2, what Köppen climate classification type is usually associated with the Tundra (tu) biome?
A A climate type.
B BW and BS climate type.
C C climate type.
D D climate types
E E climate type.
1.4) What value for PE would serve as a good boundary between the Boreal Forests (B) and Tundra (tu) biomes?
A 250
B 500
C 750
D 1000
1.5) Which biome replaces the Temperate Broadleaf and Mixed Forests (De) biome when moisture becomes less available?
A Temperate Coniferous Forests (E).
B Mediterranean Forests, Woodlands and Scrub (M).
C Deserts and Xeric Shrublands (d).
D Temperate Grasslands, Savannas and Shrublands (G).
1.6) After carefully examining Table 9.2, what two Köppen climate classification types are usually associated with the Temperate Broadleaf and Mixed Forests (De) biome?
A A climate type.
B BW and BS climate type.
C C climate type.
D D climate types.
E E climate type.
1.7) Which biomes replaces the Boreal Forests (B) biome when energy (Potential Evapotranspiration) becomes more available? (Multiple answers are accepted for this question)
A Temperate Broadleaf and Mixed Forests (De).
B Mediterranean Forests Woodlands and Scrub (M).
C Deserts and Xeric Shrublands (d).
D Temperate Grasslands Savannas and Shrublands (G).
1.8) At approximately what values of the Moisture Index (Im) do places become so dry that desert vegetation becomes common?
A -120 to -100.
B -100 to -70.
C -70 to -40.
D -40 to 0.
1.9) Which biome replaces the Tropical and Subtropical Grasslands, Savannas and Shrublands (S) biome when moisture becomes less available?
A Tropical and Subtropical Moist Broadleaf Forests (T).
B Mediterranean Forests, Woodlands and Scrub (M).
C Deserts and Xeric Shrublands (d).
D Temperate Grasslands, Savannas and Shrublands (G).
1.10) After carefully examining Table 9.2, what Köppen climate classification type is usually associated with the Deserts and Xeric Shrublands biome?
A A climate type.
B BW and BS climate type.
C C climate type.
D D climate types.
E E climate type.
QUESTION 2
Visually analyze the distribution of the plotted soil type data and identify obvious clusters on the graph. Note that in some cases, one type may overlap with another type, but in others only one group will be found in a particular part of the graph. On this graph, the following “colored letters” are used to identify eight general soil types described below.
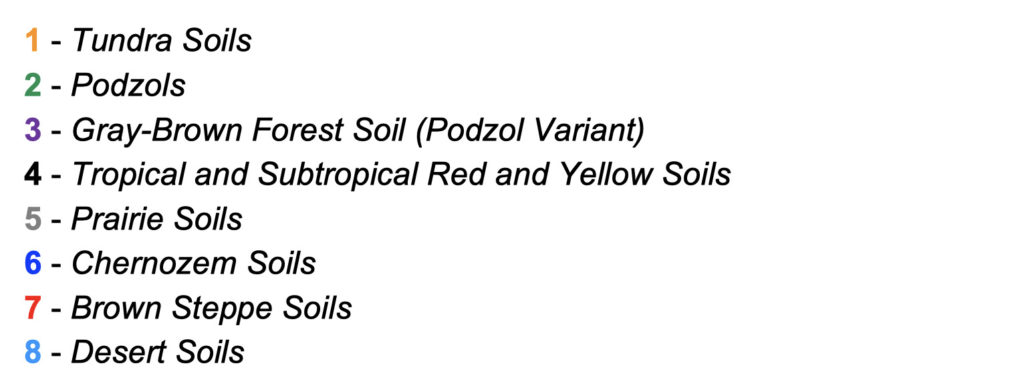
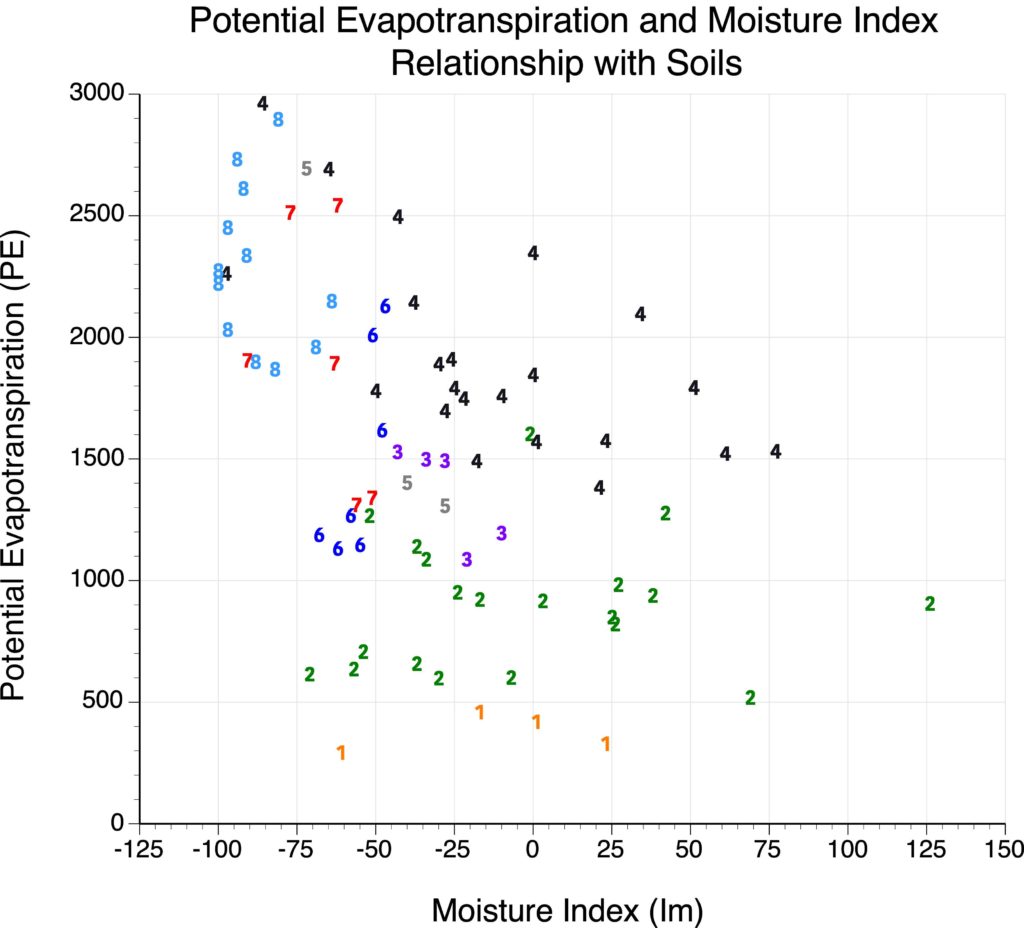
Figure 9.3. Plot of 80 locations with soil types, and measurements of potential evapotranspiration and moisture index.
Answer the questions that follow:
2.1) What two biomes are associated with Tropical and Subtropical Red and Yellow Soils (4)? (Multiple answers are accepted for this question)
A Tropical and Subtropical Moist Broadleaf Forests (T).
B Mediterranean Forests Woodlands and Scrub (M).
C Deserts and Xeric Shrublands (d).
D Temperate Grasslands Savannas and Shrublands (G).
2.2) What two biomes are associated with Podzol Soils (2)? (Multiple answers are accepted for this question)
A Boreal Forests (B).
B Mediterranean Forests Woodlands and Scrub (M).
C Tundra (tu).
D Temperate Coniferous Forests (E).
2.3) What biome is associated with Desert Soils (8)?
A Tropical and Subtropical Moist Broadleaf Forests (T).
B Mediterranean Forests, Woodlands and Scrub (M).
C Deserts and Xeric Shrublands (d).
D Temperate Grasslands, Savannas and Shrublands (G).
2.4) What biome is associated with Chernozem Soils (6)? (Multiple answers are accepted for this question)
A Tropical and Subtropical Moist Broadleaf Forests (T).
B Mediterranean Forests Woodlands and Scrub (M).
C Temperate Broadleaf and Mixed Forests (De).
D Temperate Grasslands Savannas and Shrublands (G).
2.5) Tundra and Desert soils are commonly recognized as immature soils with no or limited profile development. The particular environments they exist in add little organic matter to the soil profile and limit the chemical reactions necessary for pedogenesis. What climate factors are responsible and how do they limit these two important factors in soil development?
QUESTION 3
We are now going to use a computer model to investigate how future climate change will influence the spatial distribution of North America’s biomes. This model is available on Climate Reanalyzer and is called the Environmental Change Model (ECM). Note that ECM uses a biome classification system that is slightly different and more complex than the one you are familiar with. The biomes displayed on ECM are (in brackets the roughly equivalent biome found in Figure 9.1 is given):
- Cool Conifer Forest (Boreal Forest/Taiga)
- Mixed Forest (Temperate Broadleaf & Mixed Forests)
- Warm Broadleaf Forest (Temperate Broadleaf & Mixed Forests)
- Temperate Rainforest (Temperate Conifer Forests)
- Tropical Rainforest (Tropical & Subtropical Moist Broadleaf Forests)
- Tall Grass Prairie (Temperate Grasslands, Savannas & Shrublands)
- Short Grass Prairie (Temperate Grasslands, Savannas & Shrublands)
- Polar Desert (Tundra)
- Dry Tundra or Alpine (Tundra)
- Moist Tundra (Tundra)
- Forest-Tundra Transition (Boreal Forest/Taiga)
- Cool Steppe (Temperate Conifer Forests)
- Steppe (Temperate Grasslands, Savannas & Shrublands)
- Low Latitude Desert (Desert & Xeric Shrublands)
The figure below from Climate Reanalyzer’s Environmental Change Model shows the potential distribution of the 14 biomes under the climate typical for the period 1979-2000 – note the inputs used to produce this map, in particular Global ΔT°C = 0.
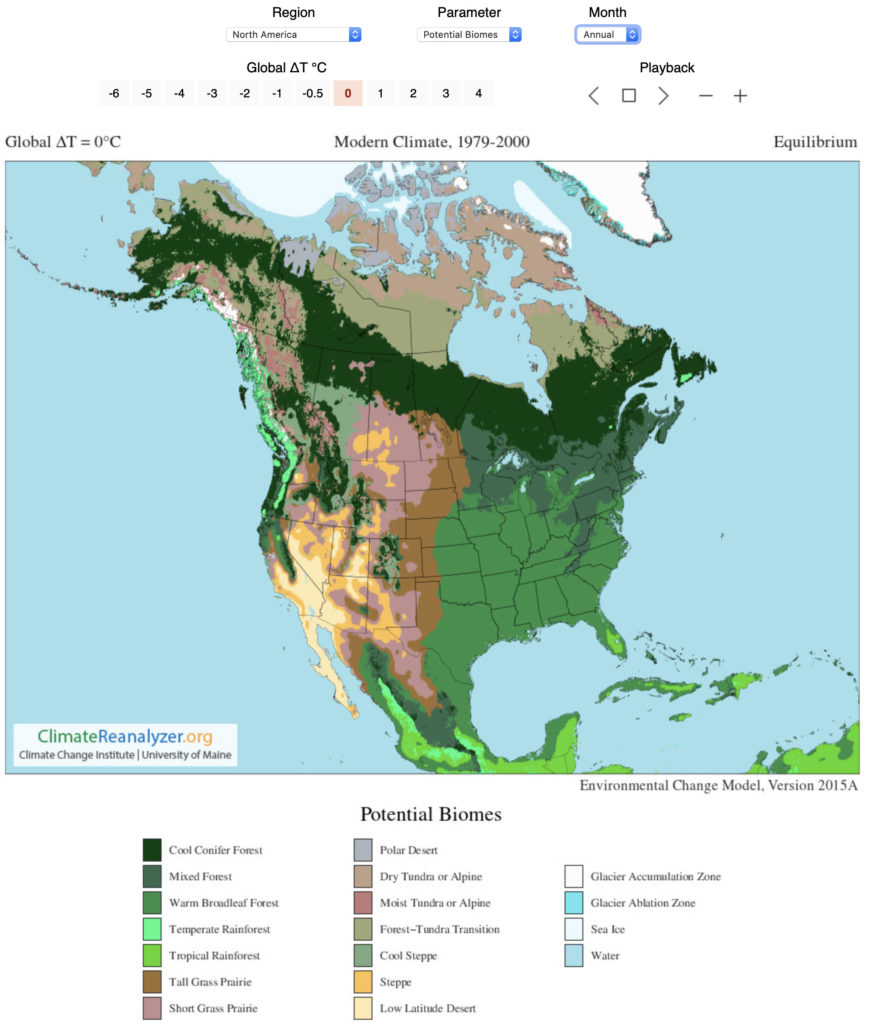
In a separate browser window recreate the map above. In another browser window create a map of North America showing the potential distribution of the 14 biomes under a worst case scenario where Global ΔT°C = 4. Examine the differences between the two maps and answer the following questions.
3.1) Which forest biome listed below shows the greatest increase in surface coverage over North America under Global ΔT°C = 4 when compared to Global ΔT°C = 0?
A Warm Broadleaf Forest.
B Mixed Forest.
C Cool Coniferous Forest.
D Temperate Rainforest.
3.2) Which forest biome listed below shows the greatest decline in surface coverage over North America under Global ΔT°C = 4 when compared to Global ΔT°C = 0?
A Warm Broadleaf Forest.
B Mixed Forest.
C Cool Coniferous Forest.
D Temperate Rainforest.
3.3) Over the provinces of Alberta, Saskatchewan, and Manitoba surface coverage of Short Grassland, Tall Grassland, and Steppe combined increases by how much under Global ΔT°C = 4 when compared to Global ΔT°C = 0?
A 10%
B 30%
C 50%
D 100%
3.4) What two biomes replace Mixed and Cool Conifer Forests in Ontario under Global ΔT°C = 4 when compared to Global ΔT°C = 0? (Multiple answers are accepted for this question)
A Warm Broadleaf Forest.
B Tall Grass Prairie.
C Short Grass Prairie.
D Temperate Rainforest.
3.5) Do Texas, Louisiana, Mississippi, Florida, and Georgia see much change in their biomes under Global ΔT°C = 4 when compared to Global ΔT°C = 0?
A Yes.
B No.
IMAGE CREDITS
Figure 9.1: Image Copyright Michael Pidwirny. Data Source: Olson, D.M. et al. 2001. Terrestrial ecoregions of the world: A new map of life on Earth. BioScience, 51(11): 933-938.
Figure 9.2: Image Copyright Michael Pidwirny.
Figure 9.3: Image Copyright Michael Pidwirny.
QUESTION ANSWER SHEET
FIGURES AND TABLES – PDF FILES
This Laboratory Exercise is Licensed Under Attribution-NonCommercial-NoDerivatives 4.0 International (CC BY-NC-ND 4.0).
Updated April 6, 2021
The largest recognizable assemblage of plants and animals on the Earth. The distribution of the biomes is controlled mainly by climate.
Transpiration is the process of water loss from plants through stomata. Stomata are small openings found on the underside of leaves that are connected to vascular plant tissues. Some dry environment plants have the ability to open and close their stomata. Transpiration is a passive process largely controlled by the humidity of the atmospheric and the moisture content of the soil. Of the transpired water passing through a plant only about 1% is used in the growth process. Transpiration also transports nutrients from the soil into the roots and carries them to the various cells of the plant.
Small openings on the surface of a plant that are used for gas exchange.
The spatial distribution of a species. The geographic ranges of species often change over time.
Heterotrophic organism that consumes plants for nutrition. Also known as a primary consumer.
Is a measure of the ability of the atmosphere to remove water from the surface through the processes of evaporation and transpiration assuming no limitation on water supply.
Evaporation can be defined as the process by which liquid water is converted into a gaseous state. Evaporation can only occur when water is available. It also requires that the humidity of the atmosphere be less than the evaporating surface (at 100% relative humidity there is no more evaporation). The evaporation process requires large amounts of energy. For example, the evaporation of one gram of water at a temperature of 100°C requires 540 calories of heat energy (600 calories at 0°C).
Is any aqueous deposit, in liquid or solid form, that develops in a saturated atmosphere (relative humidity equals 100%) and falls to the ground generally from clouds. Most clouds, however, do not produce precipitation. In many clouds, water droplets and ice crystals are too small to overcome natural updrafts found in the atmosphere. As a result, the tiny water droplets and ice crystals remain suspended in the atmosphere as clouds. Some forms of precipitation include rain, snow, drizzle, hail, ice pellets, and snow pellets.
