Lab 04: Weather Forecasting
Terence Day
Weather forecasts… do you trust them? If not, then can you do better? In this lab you will prepare your own weather forecast for tomorrow. You can do the forecast for anywhere in Canada that you’re located. If you’re not presently in Canada, then you can do it for a Canadian place of your choosing.
Learning Objectives
After completion of this lab, you will be able to
- Use a climate forecast to determine normal weather for a particular place.
- Describe current weather conditions.
- Convert UTC to local time.
- Interpret cloud cover from satellite imagery.
- Read a weather map.
- Construct a weather forecast.
Pre-Readings
Weather Radar
Weather radar is an application of Doppler radar. In this technique, a ground based antenna sends a pulsed radio-frequency beam out into the atmosphere, and then listens for the response. The responses are echoes created by radio waves hitting particles of precipitation (rain, snow, ice) and rebounding. The intensity of the echo (energy) is a function of the number, size and type of precipitation particles (Environment and Climate Change Canada, 2021). Be aware that gaps may appear in the data because the radio waves can be blocked by hills and mountains. Some radars are blocked from looking in these directions, and so a permanent blanked sector will be visible.
Coordinated Universal Time (UTC), also known as UTC, or Zulu time, is used to state the time of data collection. Note that the concept of UTC is different from GMT (Greenwich Mean Time), but the times are actually the same.
Satellite Imagery and Clouds
Satellite imagery is a type of remote sensing. Satellite imagery is created from radiant energy emitted by surface features of Earth that is sensed by satellites. This data is sent to receiving stations on the ground where it is broken down into pixels and identified by coordinates. Weather satellites have geostationary orbits, which means that they are effectively parked above the same location on Earth at all times.
Different types of clouds can be identified on satellite images. Cloud type can be identified by shape and height. Remember that it gets colder as you get higher. If a cloud is very low (where the temperature is similar to ground temperature) and featureless it is probably stratus. If it’s fairly low and lumpy in texture it’s probably cumulus, and if it’s high and streaky it is cirrus. Cumulonimbus can be identified by the range of different temperatures within the cloud, and sometimes the anvil shape of those clouds is apparent.
Reading Weather Maps
Weather maps contain a lot of information, and reading them takes some practice. An example complete surface weather map (northern hemispheric coverage) produced by Environment and Climate Change Canada is provided as Figure 4.1. Take a moment to inspect the map, and pick out the features that are familiar to you, as well as those that are not.
The weather map contains the following information:
- Pressure systems:
- High-pressure systems are identified by an H, and low-pressure systems are identified by an L. High-pressure systems have pressure higher than average sea-level pressure, whereas low-pressure systems have pressure lower than mean sea-level pressure. Mean sea-level pressure is approximately 1013 mb (millibar).
- The solid thin lines on the map are isobars, lines of equal pressure.
- Dashed lines identify troughs and ridges, elongated areas of low- and high-pressure that extend from centres of low- and high-pressure respectively. To find troughs, look for places where isobars make a sharp bend around a low-pressure system; ridges where this occurs around high-pressure systems. Note that these dashed lines are not provided on upper air analyses.
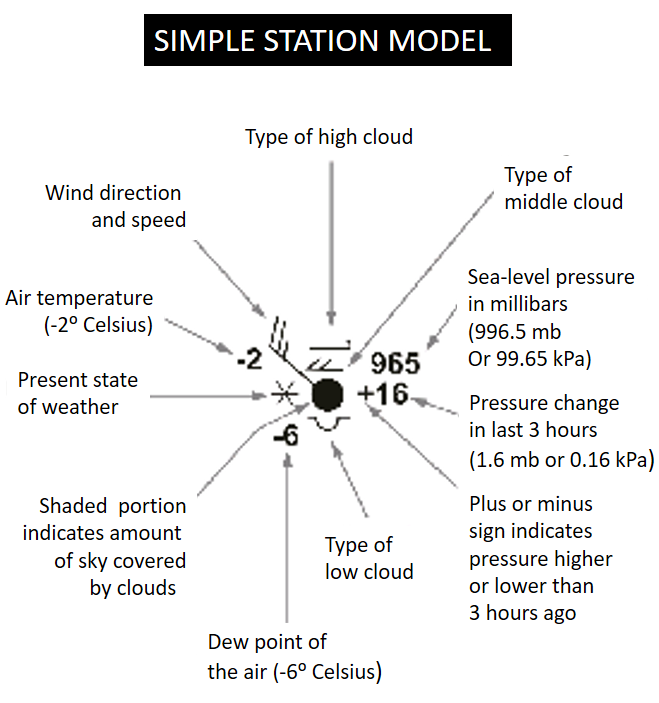
- Station data: For each station in the network, cloud type, sea-level pressure, pressure change, wind direction and speed, air temperature and dew point temperature are provided. Refer to the key in Figure 4.2. You can use this information to identify warm and cold air. Air masses are vast bodies of air with the same properties.
- Fronts: The thick solid lines with semi-circles and/or triangles attached indicate fronts, the locations where air masses meet. There are four types of fronts:
- Cold front – indicated by triangles pointing towards the direction of movement.
- Warm front – indicated by semi-circles pointing towards the direction of movement.
- Occluded front – indicated by triangles and semi-circles on the same side of the line.
- Stationary front – indicated by semi-circles on one side of the line and triangles on the other.
On analyses of the upper atmosphere, e.g., at 250 hPa (hectopascal), you may also find a J identifying the location of the jet stream. Jet streams are fast flowing, narrow, meandering air. On Earth, the main jet streams are located near the altitude of the tropopause and are westerly winds. Their paths typically meander. They form the boundary between adjacent air masses with significant differences in temperature, such as the polar region and warmer air to the south.
Lab Exercises
In this lab you will
- Identify normal weather conditions for tomorrow.
- Construct a weather forecast through collection and analysis of temperature, precipitation, atmospheric circulation data and analyses.
- Write a script for your weather forecast that is suitable for presentation on radio.
With the exception of the script, this lab must be completed during class time, or at the time agreed with your instructor.
EX1: Climate and Weather
“Climate is what you expect, and weather is what you get” (Heinlein, 1973, p. 352). So, based on climate information, what should we expect tomorrow?
Step 1: Open the WeatherStats website to access climate data. Go to List View at the top-left of the page. Here there is a list of major Canadian stations, but you will find more places listed by province under the tabs at the top of the page. Note that the full list of stations may take a couple of minutes to load. Choose the place you wish to produce a forecast for, and click on it.
Step 2: You want the data for tomorrow, so click on Time Warp in the top-right of the weather dashboard page and enter tomorrow’s date in the Date box.
Step 3: Towards the bottom of the weather dashboard page is the Daily Almanac. This gives you the normal expected weather for the selected date. Ideally this will be based on 30 years of data, but sometimes the data are for a shorter period. Your forecast will focus mostly on temperature and precipitation, so take a look at the normal maximum and minimum values of temperature and precipitation for tomorrow. Also look at the extreme values.
- State the average and range of temperature and precipitation for tomorrows’ date. You will need to calculate the range from the available data. This is a climate forecast for tomorrow, based on what’s happened on tomorrow’s date over the past 30 years. It is possible that these values will be exceeded, but it’s also quite likely that temperature and precipitation tomorrow will fall in the range that you’ve just determined.
EX2: What’s Been Happening in the Past 24 Hours?
Before we can predict the future weather, we need to know the current and recent weather. Return to today’s date using the Time Warp.
You will find Current Conditions listed, plus the temperature changes over the past 24 hours.
- Write a short paragraph on the current weather and changes over the past 24 hours. If you are or were at or close to that location then please add your own observations, e.g., Although no rain was recorded, I felt a few drops as I waited for the bus outside City Hall at 10am. Be sure to include the wind direction in your description.
EX3: Weather Radar
Weather radar is also on the same page. Weather radar is used to show regional precipitation patterns, and originates from ground stations. For example, there is one located at Silver Star Mountain Resort in Vernon, British Columbia. There are (or were) 31 stations in Canada, all located along the United States / Canada border, where most of the Canadian population is located.
The radar is shown as an animation and the times are at the bottom of the radar panel. These times are in UTC (see Weather Radar).
Answer the following questions:
- When does the animation start and end (in UTC)?
- When does the animation start and end in local time?
- In 2-3 sentences, describe where precipitation is occurring, where it came in from, and where it appears to be headed. Does it look like any precipitation is headed towards the place you’re interested in?
EX4: Satellite Imagery
All of the data on WeatherStats comes from Environment and Climate Change Canada. To get deeper into what’s happening we will need to use the Environment and Climate Change Canada website.
Step 1: On the Environment and Climate Change Canada website, click on Satellite. Click on GOES-East if your location is in Eastern Canada or GOES-West if your location is in Western Canada.
Step 2: Click on Visible. This gives you visible light imagery, which is what you would see if you were looking down from the satellite. At the top of the image there is some information. The last bit will read something like, 13.20 UTC. This is the UTC time of the image. In other words, this is data captured in the past few hours, but is not quite real time data. You can click on the image to enlarge it. Trick question: How many people are on board a weather satellite?
Step 3: Now try the animation feature. Click on the Back arrow to return to the Menu screen. Click on Animation. This feature links a series of six images taken at 10 minute intervals over the preceding hour. Control buttons (play, stop, fast forward, reverse) are located at the bottom of the image. You can also control the speed at which the images change with the Speed buttons.
Answer the following questions:
- What is your local time of the latest image (converted from UTC)?
- What is the time duration between the earliest and latest images in the animation, based on the UTC times of the images?
- What does GOES stand for?
- Explain the G in GOES.
EX5: Interpreting Satellite Imagery
The satellite imagery we’ve looked at so far is based on visible light. Return to the Menu screen. Now look at the IR (10.7 μm) and the Visible & topography images. The IR image gives the temperature of the clouds and surface. Note that the scale is counterintuitive, with red as the coldest.
Answer the following questions:
- What cloud types can you identify near your forecast location using the visible and infrared images?
- Looking at the animation of satellite images, where are the clouds moving from and to? Include known locations and the direction.
- Identify locations near your forecast site where clouds are dissipating and areas where clouds seem to be growing.
- Can you see any evidence of low- or high-pressure systems? Remember in the northern hemisphere a low pressure system rotates counter-clockwise.
- Can you see any weather systems moving towards or away from your forecast location?
EX6: Surface and Upper Air Analyses
Go back to the Environment and Climate Change Canada website. Scroll approximately halfway down the page and click on Analyses and Modelling. This is where you’ll find links to professional weather maps and the models that forecasters use.
Click on the Surface located under the Analyses heading. Look at the most recent MSLP (mean sea-level pressure) chart first. Use the Complete (Northern Hemispheric coverage) maps, since these have the fronts marked on them. There are four versions of the charts: 00, 06, 12, and 18. These are the UTC times. Click on each to view. You will see a date, as well as the time. Use the one that is most recent. You can enlarge the map by clicking anywhere on it so that you can read the numbers more clearly.
- Locate the following features on the MSLP chart if present, and describe their location relative to your forecast area:
- High- and low-pressure systems.
- Areas of warm and cold air.
- Different air masses.
- Any fronts.
Return to the Analyses page. Scroll down to Upper Air Analyses.
- Click on 500 hPA: Geopotential height, 1000-500hPa thickness to view the most recent 500 hPa map. Where are troughs and ridges located relative to your forecast site?
- Click on 250 hPA: Geopotential height, wind velocity to view the most recent 250 hPa map. Where is the jet stream located relative to your forecast site?
EX7: Producing Your Forecast
Summarize your findings for your forecast location. Include the following information:
- Where are weather systems coming from?
- What are the temperatures and dew point temperatures like upstream of your forecast location?
- Based on the satellite images, what do you think the cloud cover will be like overnight and tomorrow? How will cloud cover influence the temperature?
- Will tomorrow’s weather be different from today’s weather? Why or why not? What major processes will determine tomorrow’s weather?
Use this summary to write your forecast.
- Write a script for your weather forecast that could be read on the radio. Be sure to include your predicted temperature, cloud cover, precipitation, and wind speed and direction.
Reflection Questions
- Compare your forecast for tomorrow with the average and range of temperature and precipitation you obtained in EX1. What does this tell you about the difference between weather and climate?
- Now that you have experience creating a weather forecast, would you like to do this professionally? What do you see as the major challenges?
- Consider the types of decisions people make based on the weather forecast. Given your experience creating a weather forecast, do you believe that these decisions can be made confidently, and how far in advance?
References
Heinlein, R. A. (1973). Time enough for love. G.P. Putnam’s Sons
Environment and Climate Change Canada. (n.d.). About Canadian historical weather radar. Government of Canada. https://www.canada.ca/en/environment-climate-change/services/weather-general-tools-resources/radar-overview/about.html. Accessed July 14, 2021.
Image Descriptions
Figure 4.2. Key to weather station data on the weather map
Example values are presented with a description of the type of value for each position around the central circle. Symbols are used to represent cloud type and cover, the current state of the weather, and wind speed and direction. Numerical values are provided for sea level pressure, pressure change, dew point of the air, and air temperature.

![Environment and Climate Change Canada [GIF]](https://weather.gc.ca/data/analysis/947_100.gif)