Lab 20: Water Cycle and Water Resources
Craig Nichol
Water, like air, is one of the key fluids that helps to move energy and matter around on Earth. Water is endlessly cycled on Earth from the oceans up into the atmosphere, and down onto the land by the power of the sun. Fresh water on land is a critical nutrient for all life, as well as creating habitat for life through the water in the soil, deeper in the ground, in rivers and in lakes. Physically, water acts to erode sediments, and chemically, it carries dissolved materials back to the ocean. Earth’s ice caps and glaciers act as massive stores of fresh water. All the phases that water can take on (gas, liquid, solid) are interconnected as one seamless whole, endlessly circulating through the water cycle.
This lab explores the different flow processes of water within a single watershed and examines how those processes interact. It examines what happens to the natural water cycle when humans choose to divert water from its natural flow, and to use it for another purpose. Any water pumped from either surface water or from groundwater eventually leads to a decrease in the surface water flow within the watershed. You will expand your understanding of the different flow processes by plotting graphs of precipitation, groundwater level, and stream discharge, and by observing and explaining the interactions between these components.
Learning Objectives
After completion of this lab, you will be able to
- Describe the distribution of water and freshwater on Earth.
- Plot precipitation on a daily or annual basis.
- Plot surface water flow using a hydrograph.
- Plot groundwater levels and determine changes in groundwater storage.
- Describe how the pumping of surface water or groundwater affects surface water flow.
- Use a spreadsheet to create graphs of values over time using multiple scales.
- Appreciate an integrated approach to water management at the watershed scale.
Pre-Readings
The Water Cycle
A brief introduction to the water cycle is provided in the pre-reading Lab 09 The Water Cycle, which includes both the hydrosphere (liquid water) and cryosphere (frozen water). When considering water resources, a more detailed understanding of the processes that occur at the soil surface, the generation of runoff to streams, and infiltration to groundwater is important. The pre-reading Lab 19 Catchments as Systems introduces the catchment, or watershed, as a fundamental landscape unit. Precipitation moves through the watershed either as runoff or interflow to become surface water directly. Or, precipitation may infiltrate down to the water table where the groundwater system begins. Net infiltration (the water that that reaches the water table) raises the groundwater level and is stored in the pores spaces in the ground. Groundwater then gradually flows underground to discharge to surface water bodies, where it can provide baseflow to streams year-round.
This series of short videos (Video 20.1, Video 20.2 and Video 20.3) introduces the major terms and concepts:
Video 20.1: The Water Cycle. This video (6:46) introduces all parts of the water cycle, and covers many of the terms used.
Video 20.2: What is Groundwater? This video (5:10) is a good introduction to groundwater, and how groundwater interacts with surface water.
Video 20.3: Have you drunk Dinosaur Pee? This humorous video examines how water can be tracked in the water cycle.
Stream Hydrographs
A stream hydrograph presents the amount of water flowing in a stream over time. Become familiar with how streamflow, also known as discharge, is measured and how hydrographs are created by reading How streamflow is measured.
A summary of hydrographs and the impact of different types of watersheds on hydrographs can be found at Interpretation of Hydrographs, pages 1 and 2.
Groundwater, the Water Table, and Groundwater Pumping
A good introductory summary of groundwater can be found in Groundwater and the rural homeowner from the United States Geological Survey. Read from the beginning to the end of the Increased Pumping in the Immediate Area section (pages 5-18). Read from Quality of Water onwards just for interest sake if you wish. For a local perspective on groundwater, watch Video 20.4.
Video 20.4: It’s called groundwater! This video introduces groundwater in British Columbia and how it is monitored.
Hydrology Jargon
The three preceding pre-readings introduce a wide range of terms that describe the water cycle, streamflow and its measurement, and groundwater. You will need to become familiar with the following terms to complete this lab:
Precipitation: The total amount of water deposited on the ground surface from the atmosphere.
Rainfall: The proportion of total precipitation that reaches the ground as liquid water.
Snowfall: The proportion of total precipitation that falls as frozen water (snow, sleet, ice).
Watershed: An area of land drained by a stream system, or other body of surface water.
Runoff: Water that flows laterally above the soil surface.
Interflow: Water that flows laterally in the unsaturated soil zone towards a surface water body.
Net infiltration: Water that flows downwards from the soil zone to become part of the groundwater system.
Water table: The location where soil pores become saturated with water. The water table separates the unsaturated soil zone (above) from the groundwater (below).
Groundwater: Water held or flowing underground through pores or fractures between mineral grains that are fully saturated with water.
Streamflow: A general term for water flowing in a creek, stream or river.
Discharge: The volume of water flowing in a creek, stream or river, commonly measured in cubic metres a second (m3/s; also called cumecs).
Peak discharge: The highest value of stream discharge for a particular time range.
Lag time: The difference in time between a first event, and a second event. For example, the time between the peak of a rainfall event, and the peak of measured stream discharge.
Baseflow: The water flowing in a stream when there has been no recent precipitation. Baseflow is largely supplied by groundwater flowing into the stream, or glacial melt.
Hydrograph: A graphical presentation of stream discharge against time.
Aquifer: a region of saturated geological materials from which groundwater can be pumped out easily.
Groundwater level: the elevation of groundwater inside a groundwater well.
Groundwater pumping: the removal of groundwater from a groundwater well using a pump.
Water as a Resource – Human Alteration of the Water Cycle
Surface water features within watersheds can be altered by land use within the watershed. All water use within a watershed affects the water cycle. The impacts may show up as changes to stream discharge, groundwater levels and/or on the overall nature of the water balance in the watershed.
On the input side of the water balance, precipitation is the main input of water to a watershed, and land use type can affect how much precipitation ends up as runoff, and how much water ends up infiltrating into the ground to become groundwater. Sophisticated analysis may be required to determine any effects of human alteration of the watershed on the stream discharge.
The output side of a water balance is also affected. Humans may extract water from surface water or groundwater to provide domestic water supply (a single household), to supply drinking water (a water utility supplying many houses), to provide irrigation water, or for commercial purposes. This water may be returned to places within the watershed after it has been used (for example, some domestic water use is collected, treated, and discharged back to surface water), or water volume may be lost from the watershed if the water is evapotranspired by plants back to the atmosphere through use of the water for agricultural irrigation or for watering household lawns and gardens.
The timing and scale of effects depends on the timing and scale of alteration. Drinking water usage tends to be consistent year round, except where populations are highly seasonal. Irrigation water usage peaks in summer time when crops are growing. Commercial/industrial uses can vary over the year, depending on the type of production. Water extracted directly from a surface water feature will immediately reduce the stream discharge or water level in that feature. Water extracted from groundwater either intercepts groundwater that was on its way to discharging to surface water as groundwater baseflow, or, the groundwater pumping may lower the water level enough to cause water to flow out of surface water and into the groundwater. Both effects reduce the amount of surface water flow.
British Columbia Water Data Sources
Data for water resources in British Columbia (BC) are collected by a variety of different organizations:
- Environment and Climate Change Canada is the federal government ministry that looks after weather and climate stations;
- Water Survey of Canada (part of ECCC) maintain Canada’s network of stream discharge measuring stations and prepare hydrographs; and
- BC Ministry of the Environment collects groundwater data.
The BC Government has created a web-based portal, the BC Water Tool, to allow the public to easily access all of the water-related data in a convenient place.
Functions in the BC Water Tool
At the top left hand side of the BC Water Tool screen, there is a series of buttons that you can click to change the way data is presented on the screen:
- The + and – buttons allow the screen to be zoomed in and out.
- The hand icon allows you to use a mouse to drag the screen to new locations.
- The disk icon below the +/- allows you to save your current view as a url, or to download the data on the screen to a file.
- The folded paper icon allows you to change the map style (really, the basemap). Default is likely the best scheme to use to see all the drainage features. You will also find Satellite. Click on this view, and the simplified map will be replaced with a detailed colour satellite image. Try out some of the different view types.
- The i (for information) icon provides access to the map legend.
As you navigate around the map, you may also <right click> using a mouse at any location. A small dialogue box will open on the screen with the title Coordinates. The box contains the latitude and longitude of the location clicked expressed in decimal degrees.
Further to the left are a second series of buttons arranged vertically. Click on each button in turn, and see how the data presented on the screen changes. From top to bottom, the buttons are
- Book icon: watershed reporting;
- Upwards trending graph icon: surface water hydrometric stations;
- S: surface water quality measurement stations;
- G: groundwater quality monitoring stations;
- Downward trending graph icon: groundwater level monitoring stations; and
- Cloud icon: climate stations.
On each different data screen, different markers are used to indicate currently active stations, and inactive stations for which there is historical data, but not current data. Click on i (for information) and the legend will display.
Graphing Using a Spreadsheet
The lab requires that you be able to download data on precipitation, stream discharge and groundwater levels from different BC and Federal government sources. The data will be collected together in a spreadsheet, and then graphed over time. You should be familiar with spreadsheets and how to open a file, copy and paste data, save a spreadsheet, and plot data as an x-y graph of a value plotted over time. Please complete the spreadsheet tutorial (Tutorials 1, 2, 6, 7, and 8) if you require a review.
Lab Exercises
This lab examines the ground-based components of the water cycle at the scale of a watershed. It is based on the watershed of the Nicomekl River near Langley, British Columbia, located to the east of Vancouver in the Fraser Valley. In this lab you will:
- Examine the geography of the watershed.
- Download precipitation, stream flow and groundwater level data.
- Analyse daily and annual patterns in this data.
- Plot the data in a spreadsheet.
- Consider the effects of water resource use on a watershed.
It is estimated that the lab will take 2-4 hours to complete. Submit your answers as directed by your instructor.
EX1: Exploring the Watershed Area
In this exercise, you will use the BC Water Tool to examine the overall geography of the watershed.
Step 1: Open the BC Water Tool website, and navigate to the Water Portal for the South and Coast Area (link near the top of the home page). You may have to accept a data license agreement.
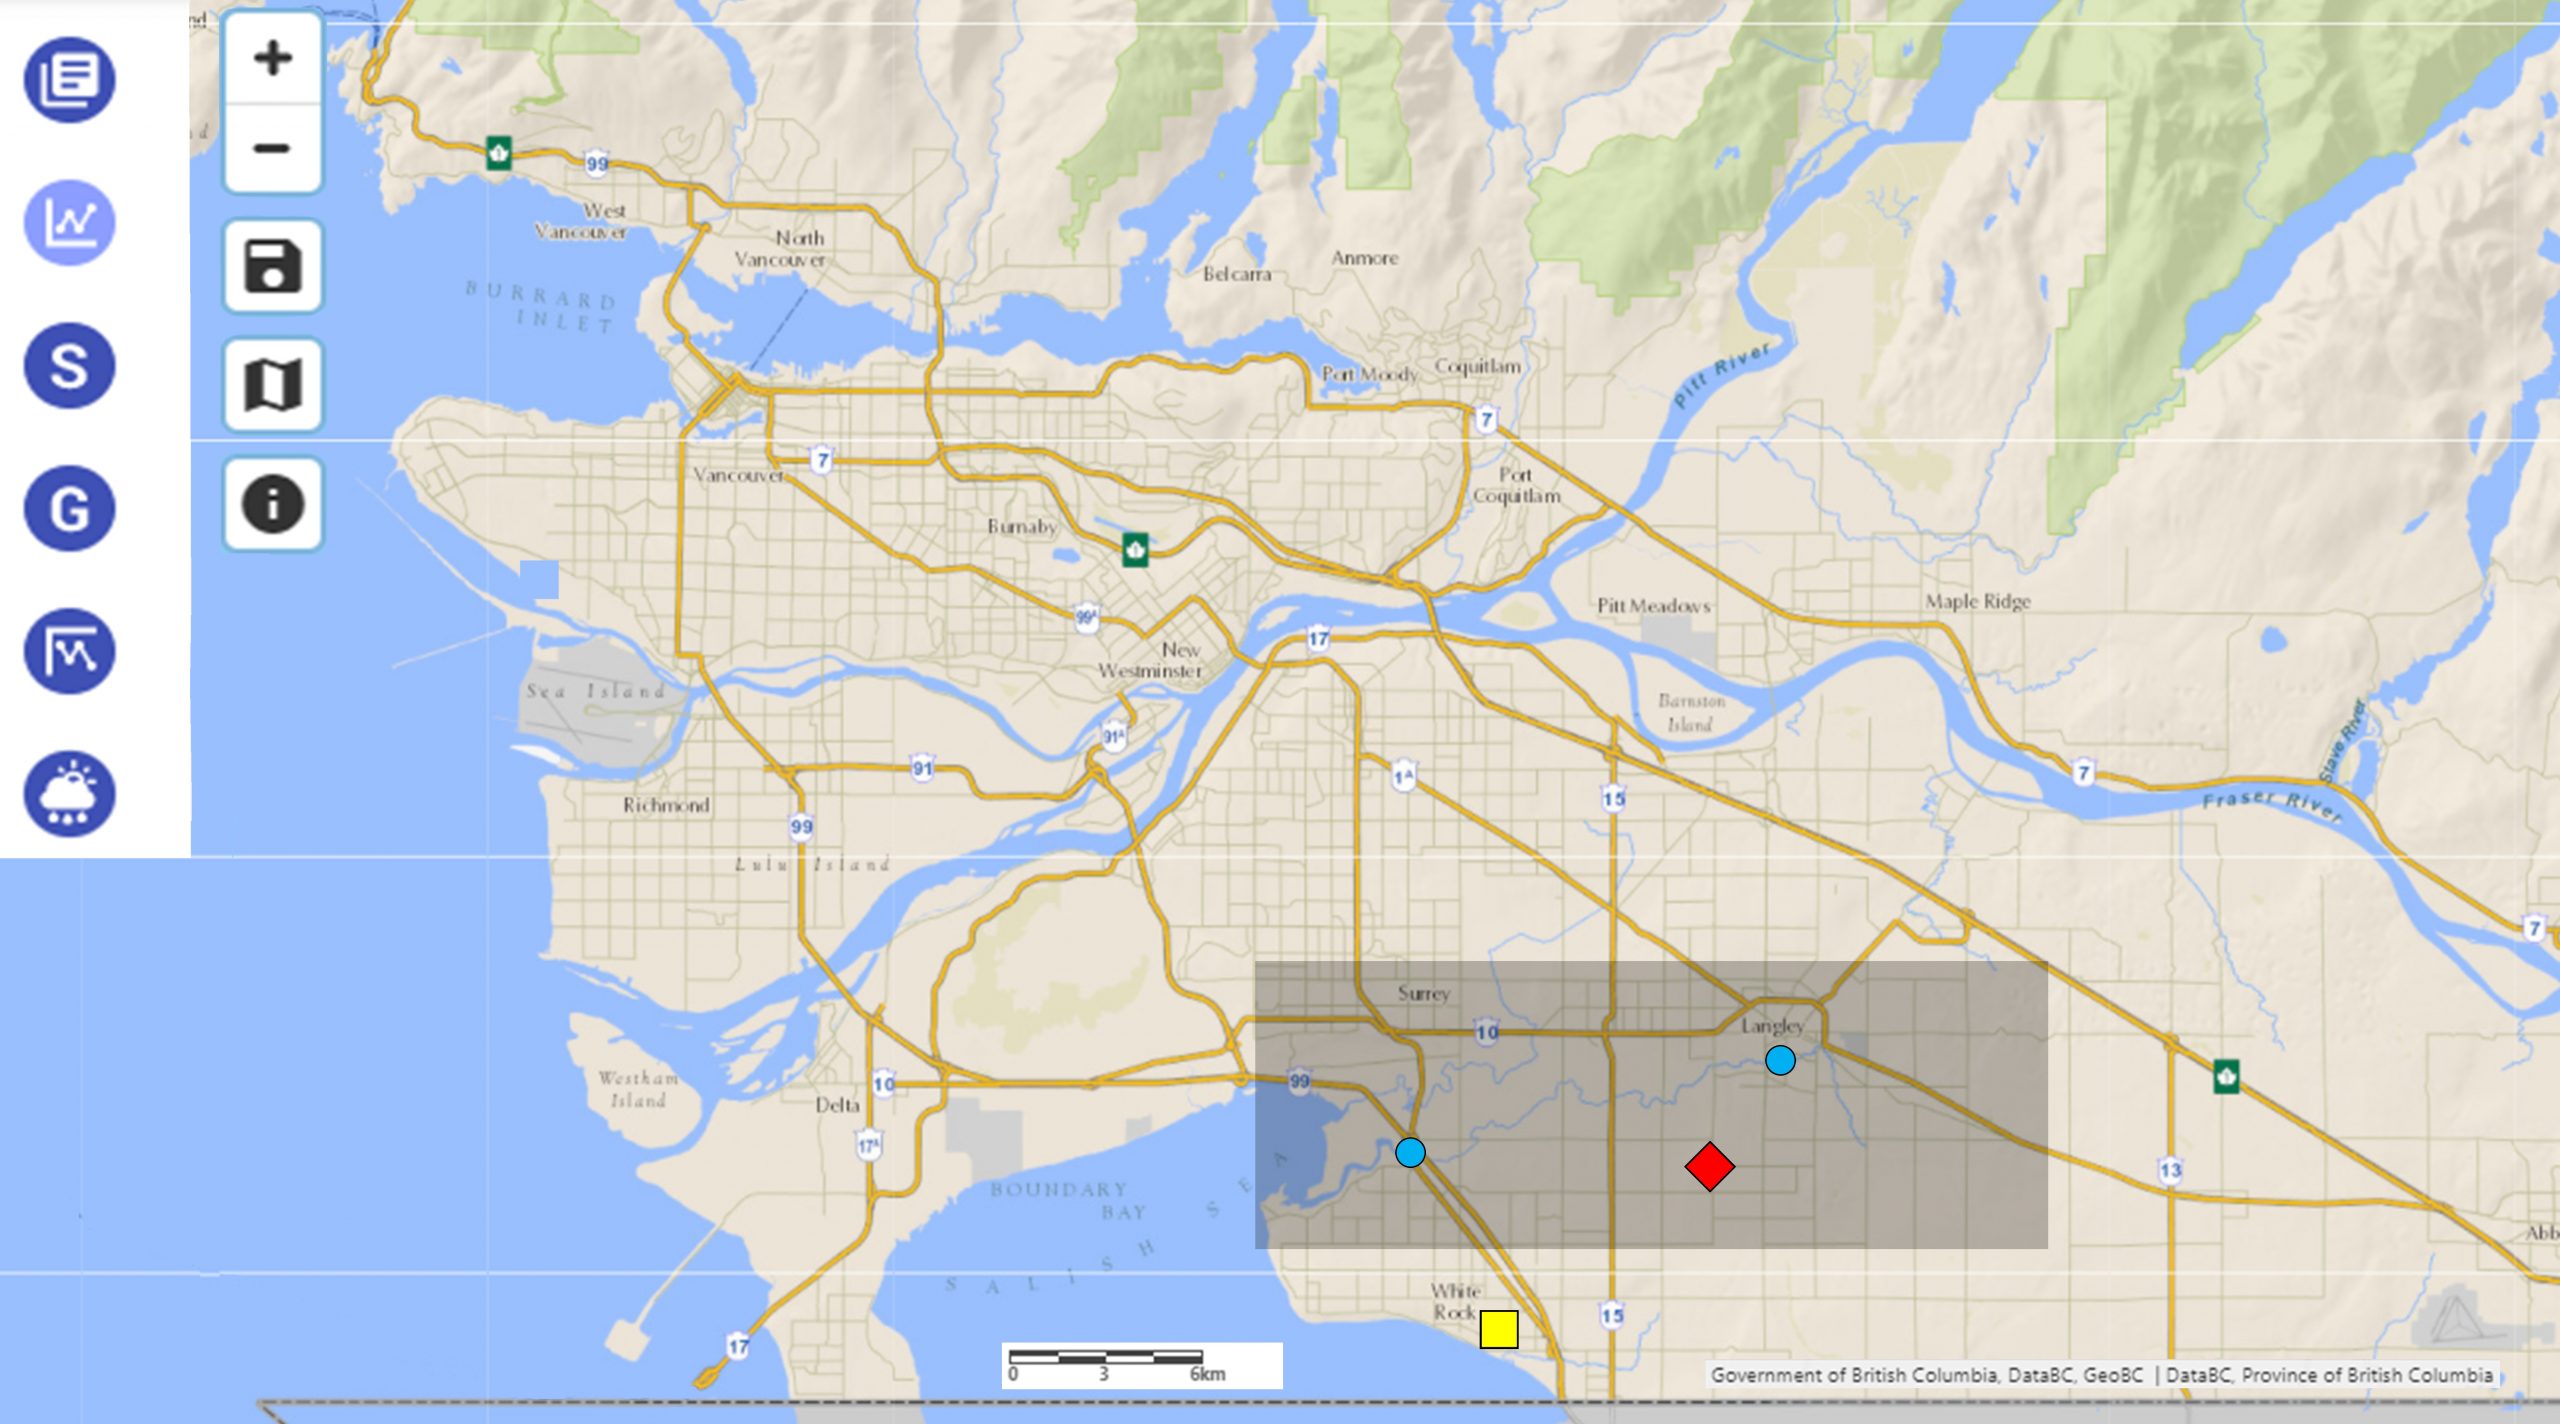
Step 2: Zoom the map into the area of Vancouver, and to the Fraser Valley located to the east, and locate the sub-area outlined in Figure 20.1.
Step 3: Take 15 minutes and explore the Nicomekl River watershed using the BC Water Tool. You may wish to alternate your map view between the default line map view, and the satellite view. You can click on the i information icon to activate the map legend display. You may find that the top book icon (watershed reporting) does not work in this area.
Step 4: (Optional) If you are familiar with Google Earth (Web), you may also wish to explore the watershed using this program.
Step 5: Locate the Nicomekl River at the point where it flows east to west to the ocean at the hydrograph station to the left of Figure 20.1 (49.06917N or 49 04’ 09”N; 122.82500W or 122 49’ 30”W). Starting from this point, trace the river to the east where it passes through the City of Langley to the hydrograph station to the right of Figure 18.1 (49.10417N or 49 06’ 15” N; 122.6603W or or 122 39’ 37” W). Further to the east, the river may become difficult to trace.
Step 6: Examine some of the major tributaries of the Nicomekl as well. The Nicomekl has two side creeks that branch off to the south of the river – Anderson Creek just west of Langley, and another the branches off southeast of Langley.
Once you have taken some time to explore the watershed, use the BC Water Tool answer the following questions in 3-5 sentences each:
- Using the Default map style and the Satellite map style, describe the land use within the watershed and estimate the approximate proportions (%) of the land within the Nicomekl watershed that are covered by farmland, urban land, and natural land.
- Examine the character of the side creeks from the Nicomekl River on the south side of the river in the area of Highway 15 (from 168th to 164th St) in the Default map style, and compare to the Satellite map style. Describe the dominant land use and how it impacts the drainage pattern.
- Examine the area of Langley city center (approx. 49.104, -122.657; the intersection of Glover Road or 203rd Street and the Fraser Highway). The urban area is bounded on the north by the Langley Bypass of Highway 10, on the south by the Nicomekl. On the west by 192nd Street and on the east by 208th Street and the Langley Bypass. There appear to be creeks branching off the Nicomekl river to the south and east. Describe how the channel patterns on the north side of the main Nicomekl channel differ compared to the south. Viewing both Default map style and Satellite map style, explain why.
EX2: Annual Precipitation, Stream Discharge and Groundwater Level Data
In this exercise, we will visit a series of data sources using the BC Water Tool to visually examine graphs of climate and precipitation, stream discharge in the Nicomekl, and groundwater levels. You will note important features of the annual changes in each graph, then compare those to monthly average data prepared for you.
You will also download raw data in spreadsheet form. You will use this data in EX3. In each case, save the gathered data to a folder in a known location. If you find that you are unable to complete this step, contact your instructor, who will have a set of data downloaded that you can use.
Precipitation and Climate Data
Step 1: Click on the Cloud icon on the left of the screen to show climate stations. Click on the information icon (i) to see the legend for active and historical stations.
Step 2: Zoom out until you locate the closest active climate station. It is located south of the watershed close to the United States border in White Rock BC.
Step 3: Click on the station on the map and information will load on the right of the screen for White Rock station 1108910. Click DOWNLOAD DATA (large button also on the right of the screen) to download the data from this station. Save the file using the name suggested (station-data-12418.csv) to a folder you can find.
Step 4: On the bottom right of the screen, you will see panels indicating graphs for Temperature, Precipitation, and Snow on Ground. Depending on the size of your screen, you may need to scroll down to see these.
Step 5: Click on the panel for Precipitation. You should now see a graphic displaying precipitation such as the one shown in Figure 20.2. The graphic has the following features:
- Precipitation amount is plotted on the y-axis and date is plotted on the x-axis.
- The black horizontal line in each month indicates the median value in that month.
- Dark shading indicates the more common historical ranges of data in that month of the year.
- Light grey shading indicates the more extreme variations in historical data.
- Blue graphs show the cumulative amount of precipitation for each month in the current year.
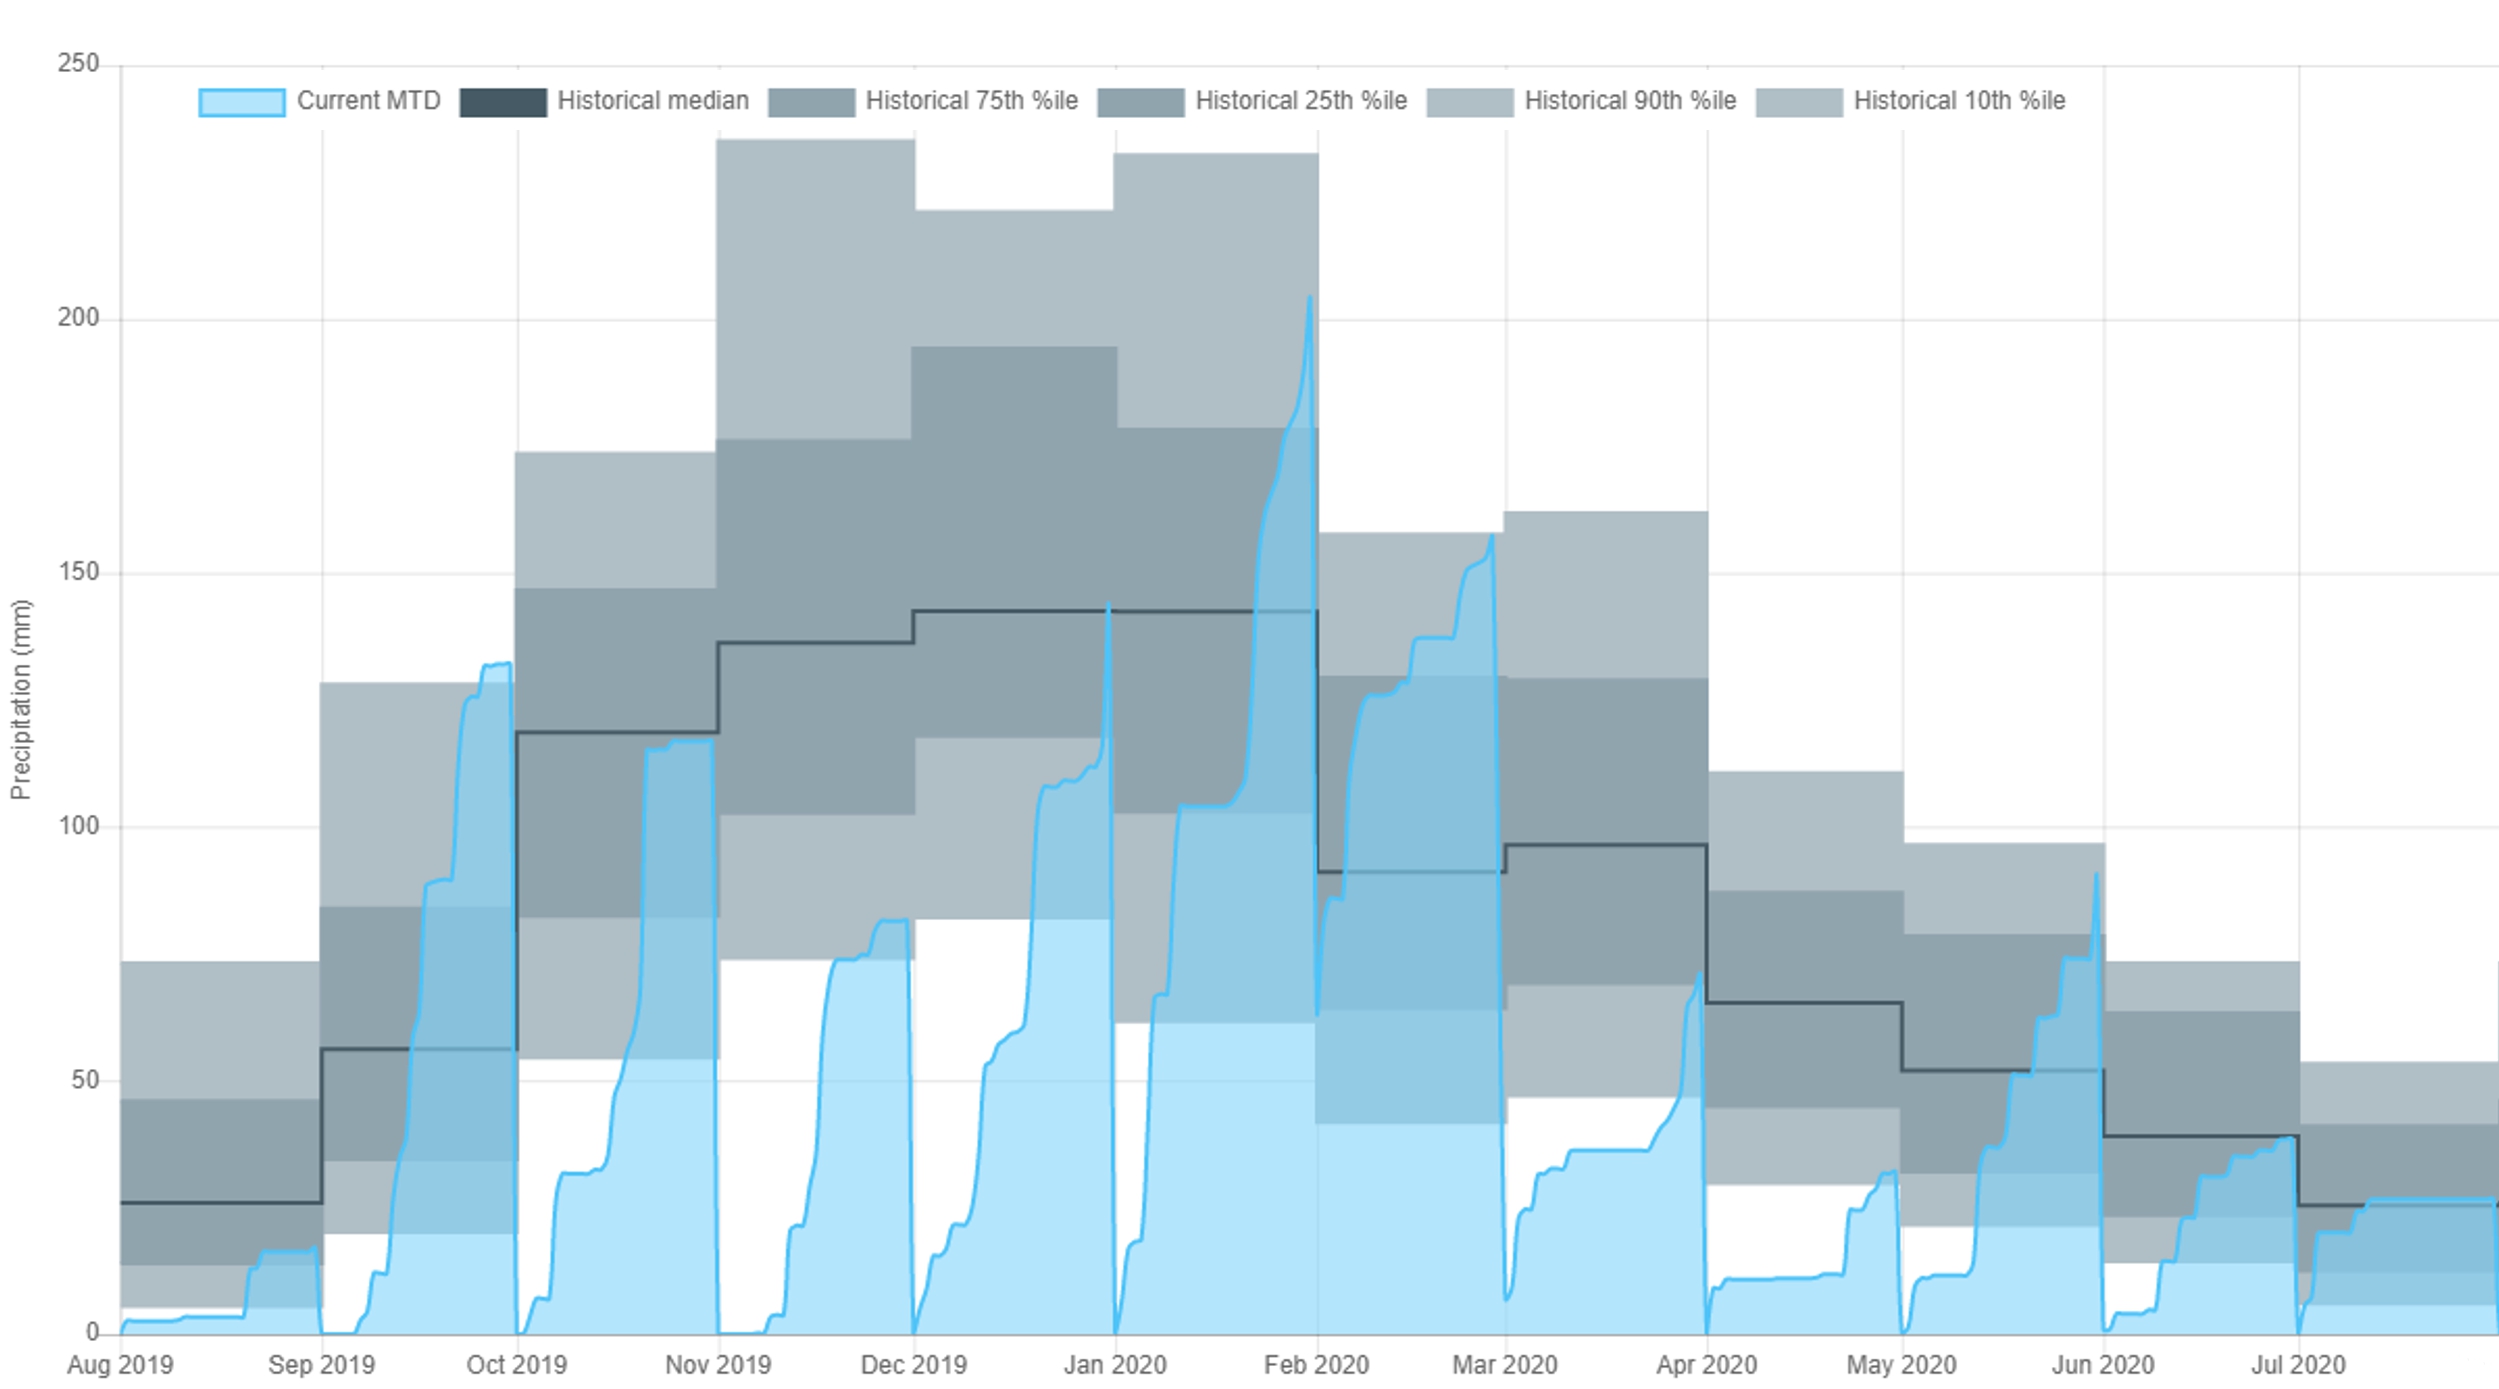
Visually trace the black line across the figure. Write down which two months have the highest precipitation and which two months have the lowest precipitation.
Step 6: To exit this screen, click on the X located in the top right of the screen.
Hydrograph Data
Step 1: Click on the upwards trending graph icon to activate the display of the locations of hydrographic stations.
Step 2: Locate the active hydrograph station located near the center of Langley (Nicomekl River At 203 Street, Langley, 08MH155, 49 06’ 15” N, 122 39’ 37” W).
Step 3: On the right of the screen, click DOWNLOAD DATA and save the file (station-data-4268.csv) to your folder.
Step 4: On the right of the screen, click on 7 Day Flow. You will see a graph similar to Figure 20.3. The stream discharge is plotted on the y-axis in m3/s. The date is plotted on the x-axis. Statistical features are as per Figure 20.2. As you move the cursor across the screen, the values of the median value of discharge on that day, and the range over time, will be displayed. The orange (may appear yellow) line shows the actual discharge over the last 1 year period and is labelled Current.
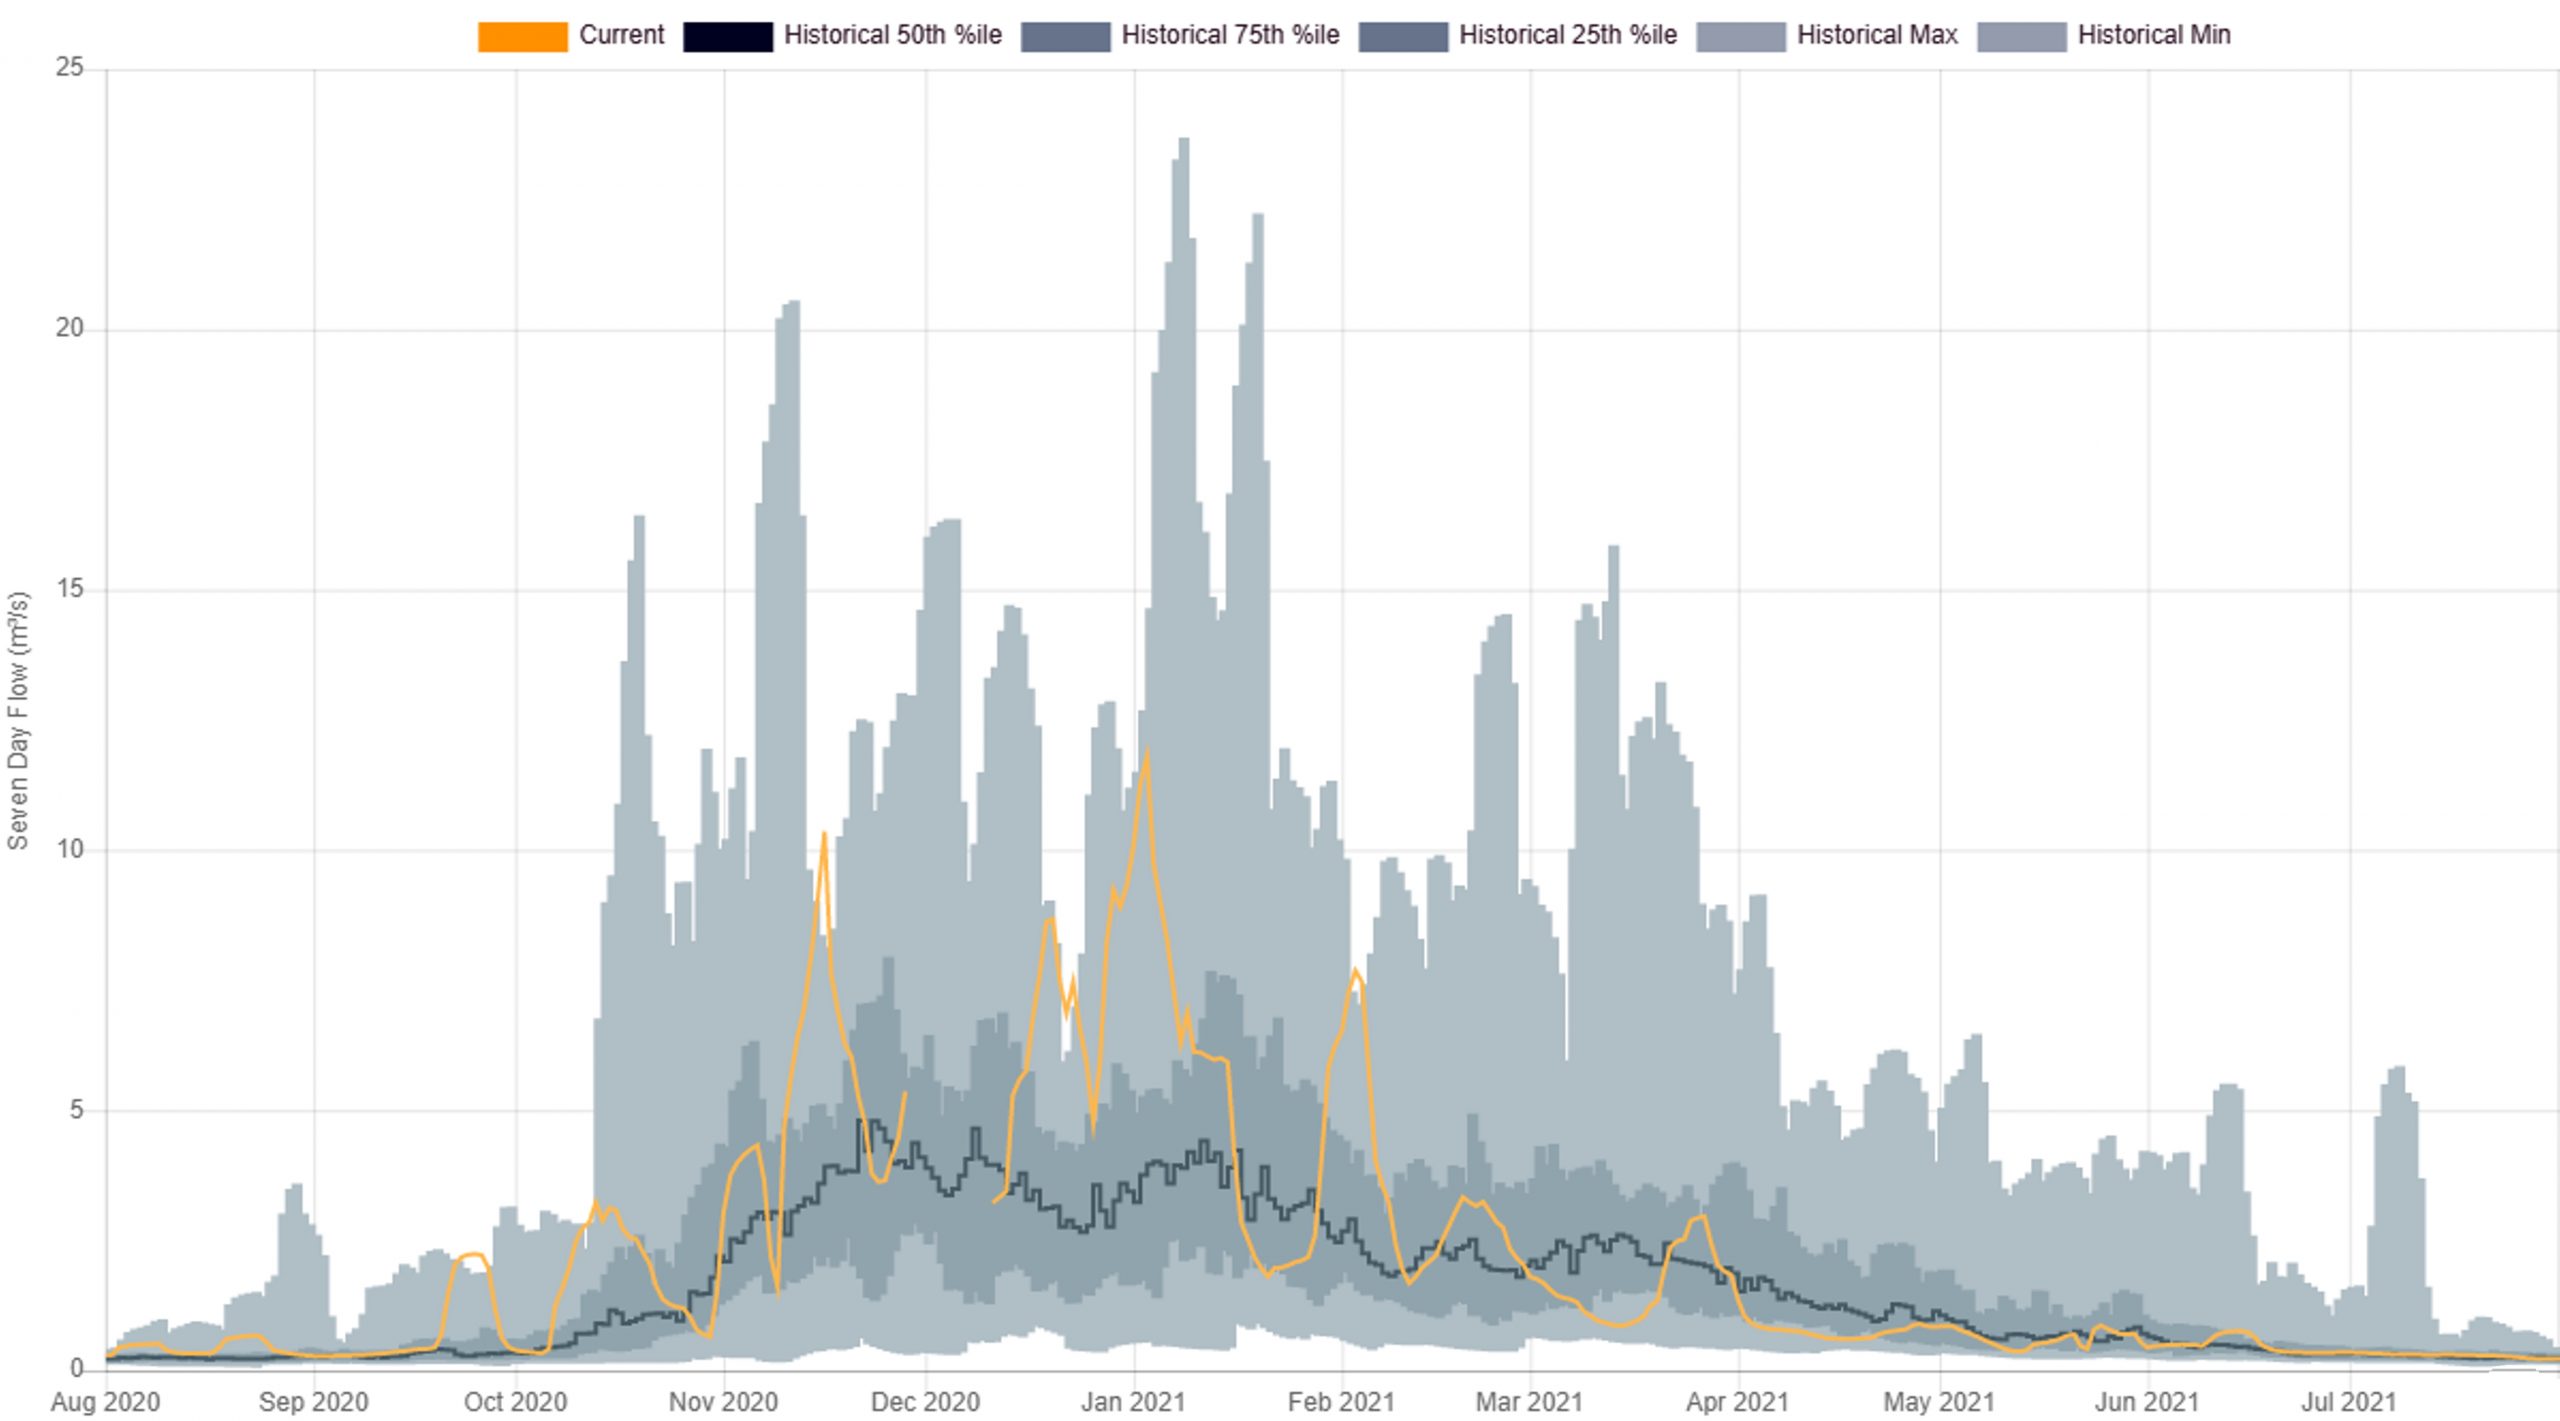
Visually trace the black line across the figure. In this case, the black line marks the daily average, with the range for that day shown in grey. Examine the data and write down which two months have, on average, higher discharge, and which two months have the lowest discharge. You will have to use your judgement to translate the daily data to determine the months with highest flow. Follow the orange line across the graphic, and look at how discharge over the last year has changed.
Step 5: To exit this screen, click on the X located in the top right of the screen.
Groundwater Data
Step 1: Click on the downward trending graph icon to active groundwater level monitoring stations. You may need to zoom out.
Step 2: Locate the two groundwater monitoring well locations to the south of Langley close to Anderson Creek (red diamond in Figure 20.1).
Step 3: Zoom in, and locate the eastern (on the right) of the two wells at this location (Langley 196 St near 36 Ave, Observation Well #353). Click on this well, and then click DOWNLOAD DATA and save the data to your folder (station-data-8309.csv).
Step 4: Click on the Level button on the right. You will see a graph similar to Figure 20.4. Notice that the groundwater data is plotted as depth to water on the y-axis, but it has been plotted as increasing downwards. This is how water levels are measured in groundwater wells, using a specialized tape measure to record the depth to water downwards from the ground surface. A large depth to water therefore means a lower water elevation. Statistical features are as per Figure 20.2.
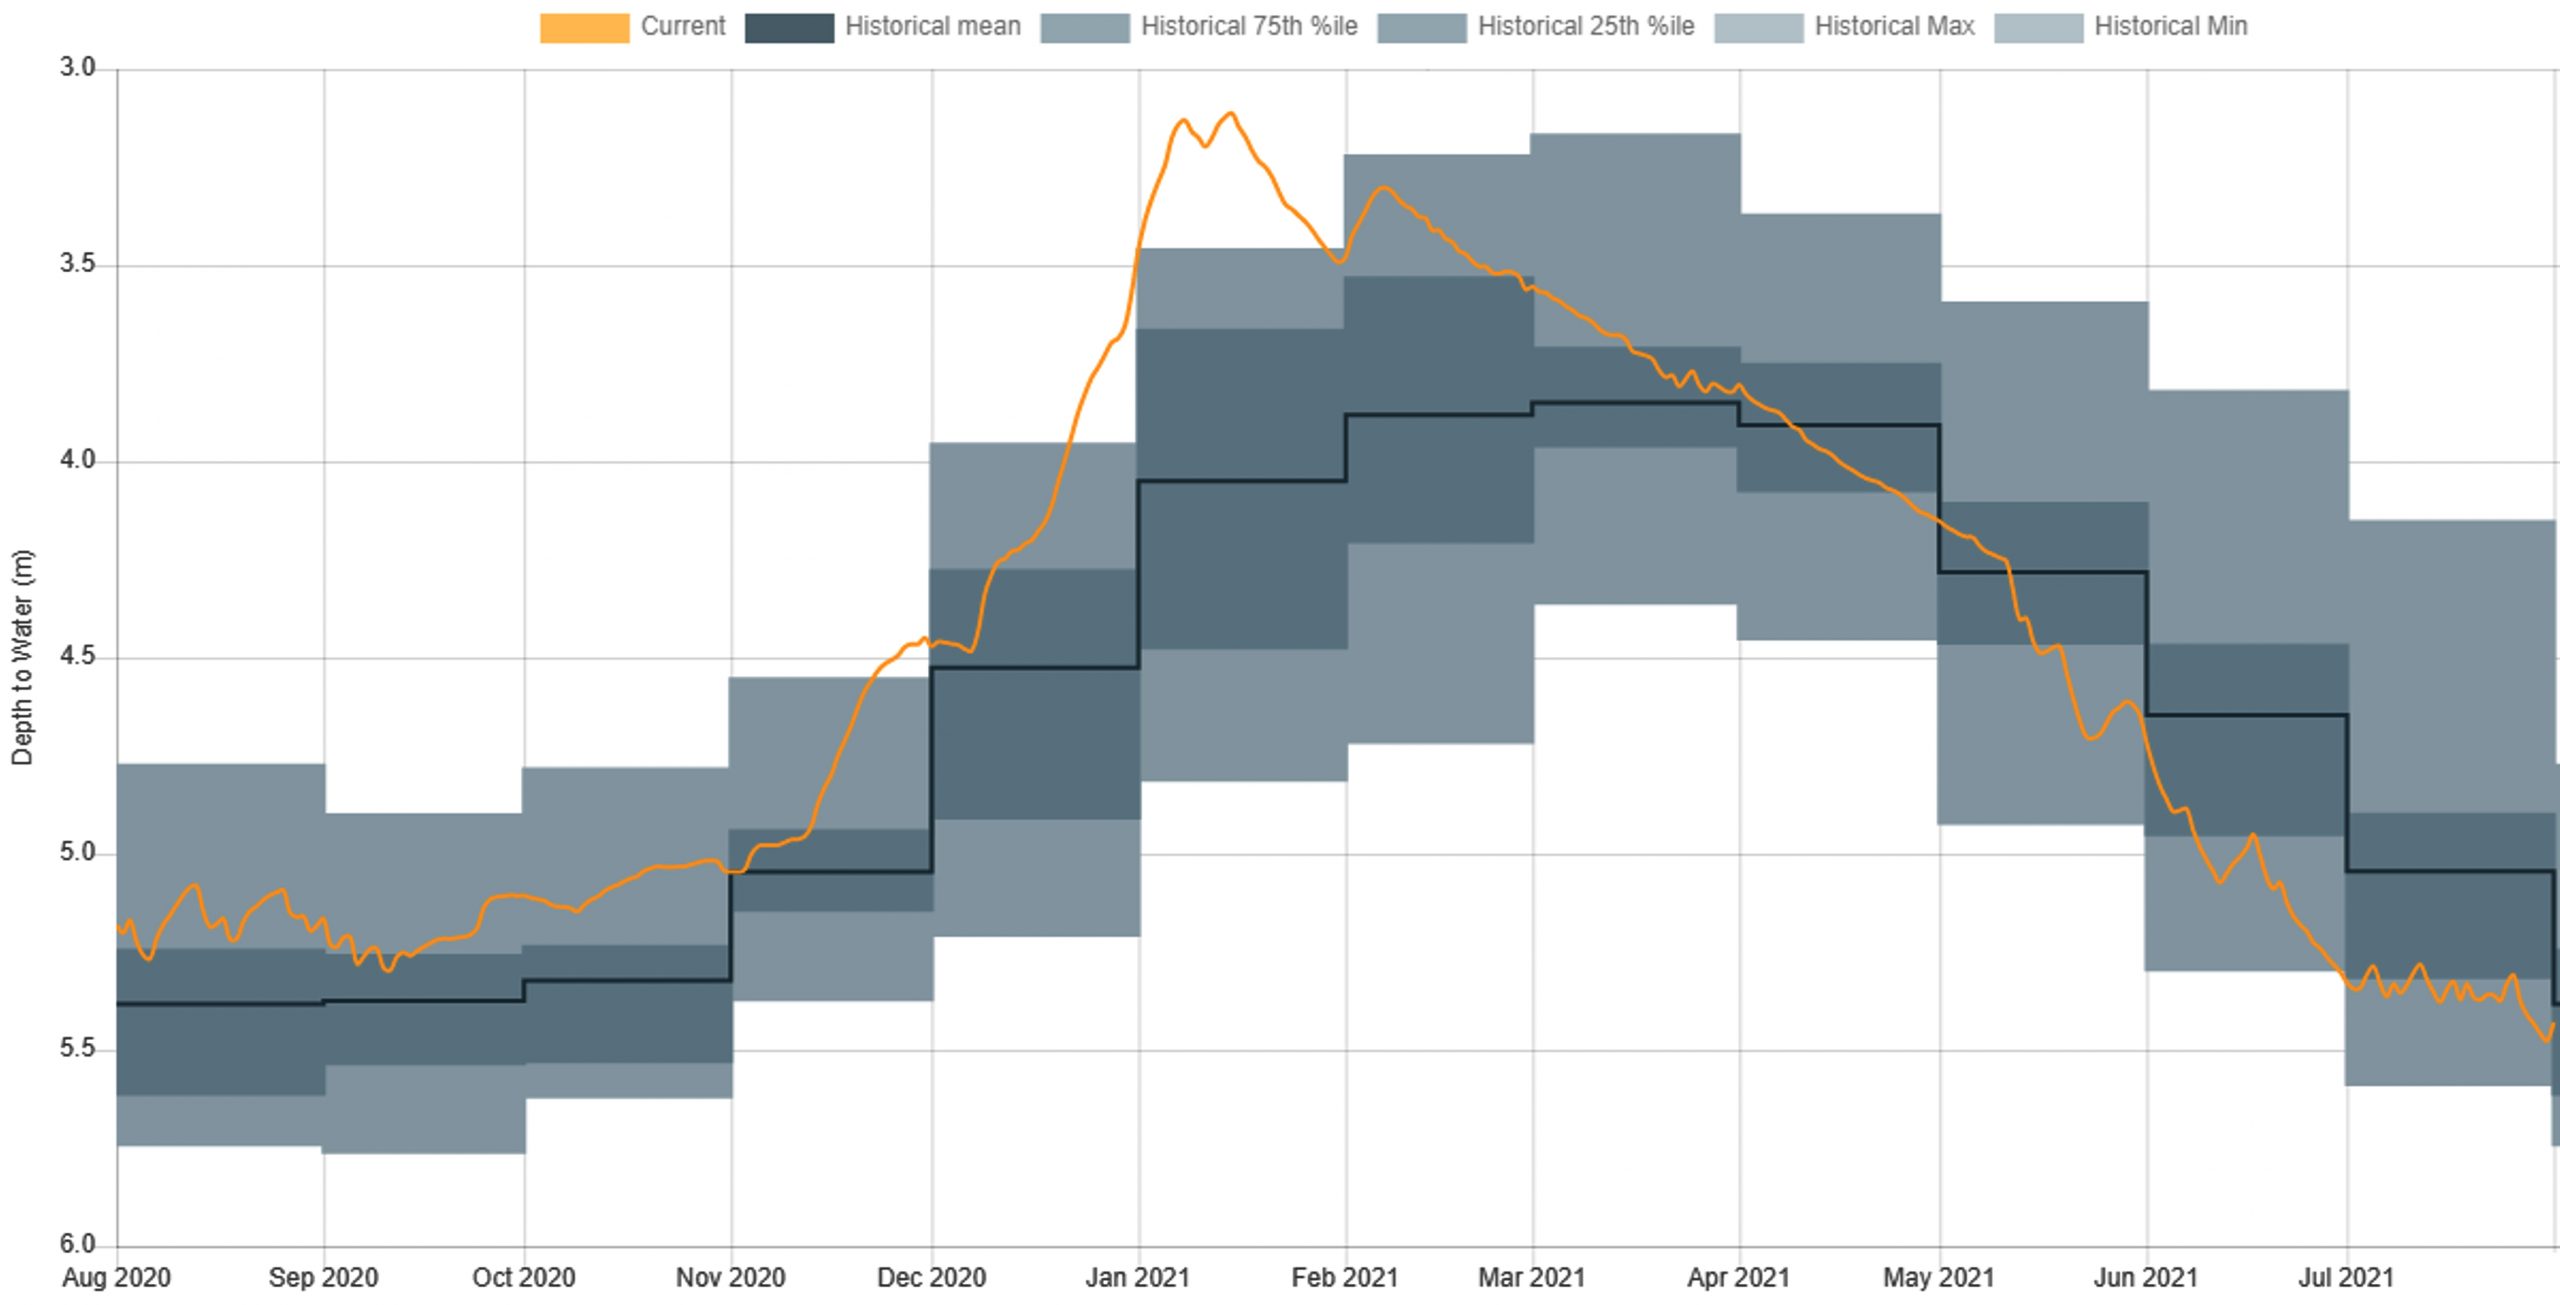
Trace the black line across the figure. Write down which two months have, on average, higher groundwater levels (small depth to water) and which two months have lower groundwater levels (large depth to water). If you click on a point on the interactive figure, the values for the month will be displayed.
Step 5: To exit this screen, click on the X located in the top right of the screen.
- Confirm that you have a folder containing three data files in .csv format, one each for precipitation, discharge and groundwater level.
Examining Data on an Annual Basis
Now it is time to examine how water moves in and out of a watershed on an annual basis. The precipitation and groundwater level graphics were done on monthly basis, but flow was on a daily basis. To assist you, your instructor has calculated flow data on a monthly basis. Obtain the set of mean monthly data covering the calendar year prior to your lab from your instructor. Examine the data and answer the following questions:
- Examine the annual pattern of rainfall data. Which two months represent the peak inputs of water to the watershed from precipitation? In which month(s) are precipitation inputs the lowest?
- Which two months represent the peak stream discharge out of the watershed? In which month(s) is discharge the lowest? Earlier, you visually assessed the raw stream discharge data to identify your estimates of the high and low flow months. Did your choices from the graphs of discharge match the calculated averages data?
- Which two months represent the peak groundwater elevation? Which month(s) have the lowest elevation? Note: the data record depth from surface; the largest depth to groundwater indicates the lowest groundwater level.
- How much does the groundwater level change over a year (in m)? What does this water level change represent?
- What is the lag time between peak precipitation and peak discharge? What is the lag time between peak precipitation and peak groundwater level? Explain what is happening.
EX3: Daily Precipitation, Stream Discharge and Groundwater Level Data
In this exercise you will examine the response time between precipitation, stream discharge, and groundwater level on a daily basis to gain an understanding of how quickly discharge responds to runoff and interflow compared to groundwater flow.
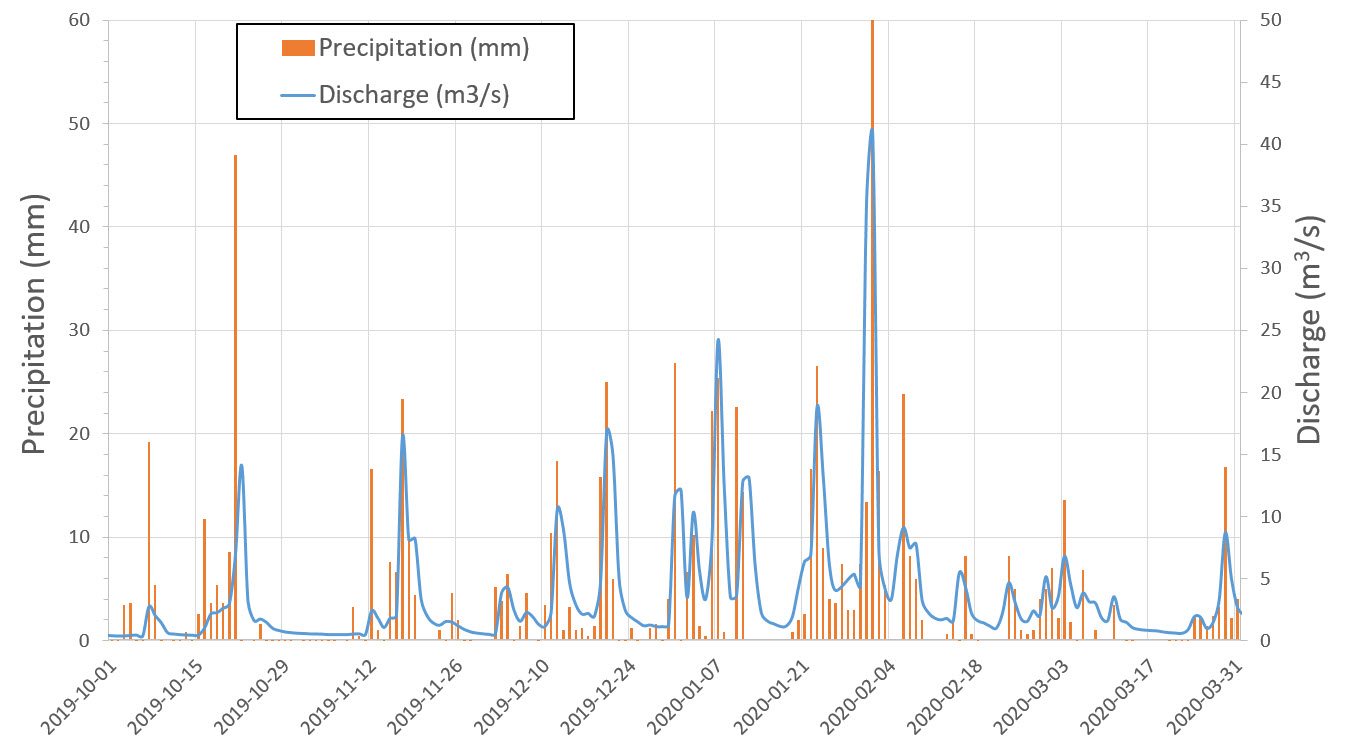
Step 1: Download the EX3 spreadsheet from Worksheets and open it. Here you will note that the station data for precipitation, discharge, and groundwater level have been provided from 2004-09-10 to 2020-12-31. You will also note two graphs. First, a graph of precipitation and discharge for the 2019/2020 water year (October 1, 2019 to September 30, 2020) on a single graph, plotting precipitation as a column, and discharge as a XY type joined by a line. An example is shown on Figure 20.5.
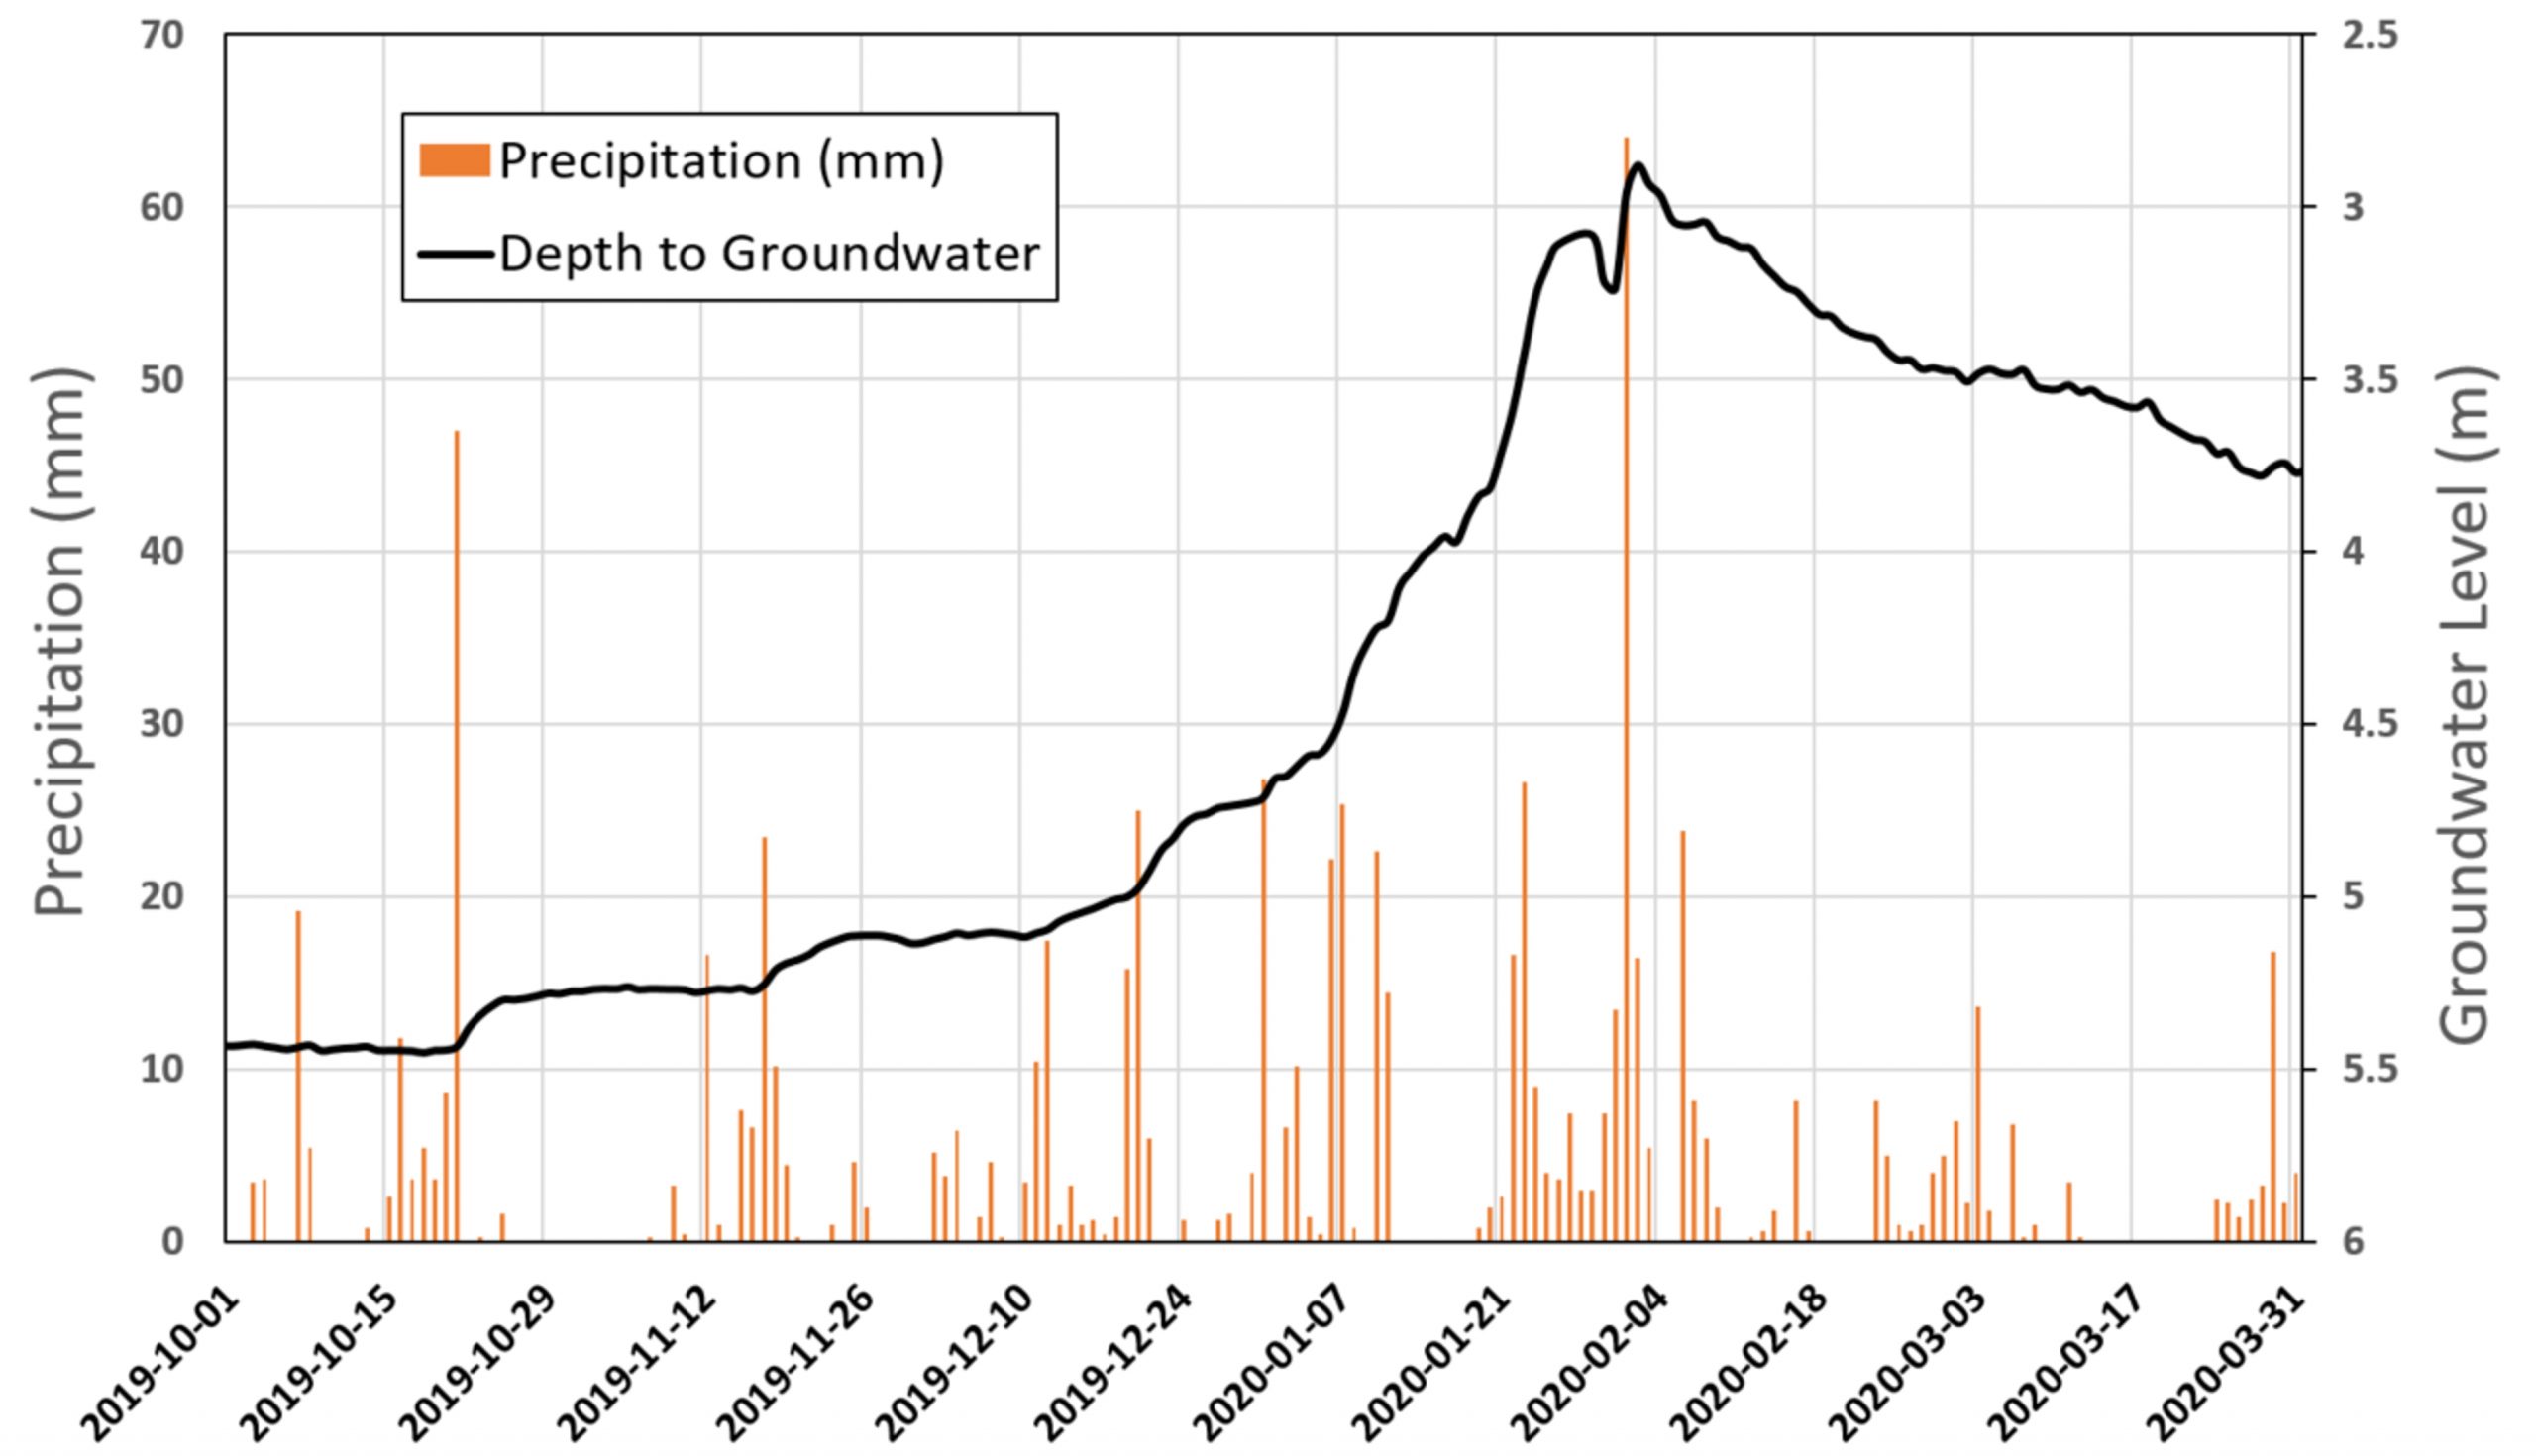
Second, you will see a graph of precipitation and groundwater level for the 2019/2020 water year on a single graph, plotting precipitation as a column, and groundwater level as an X-Y scatter plot joined by a line. An example is shown on Figure 20.6.
Step 2: Open your file for climate data (Station-data-12418.csv) by double clicking on the file. You may need to start your spreadsheet program first, and then use File > Open to open the file. This file contains precipitation data, then snowfall data, and then a number of temperature data. You only need the precipitation data, and can delete everything after the precipitation data if you wish. Scroll down the data until you see the data for Jan 1, 2021 onwards. Copy and paste this data into the Precipitation Data portion of your EX3 spreadsheet.
Step 3: Open the file for hydrometric data (Station-data-4268.csv). This file contains both discharge and water level data. You only need the discharge data, and can delete the water level data if you wish. Copy and paste the discharge data from Jan 1, 2021 onwards into the Streamflow Data portion of your EX3 spreadsheet.
Step 4: Open the file for groundwater level data (Station-data-8309.csv). Copy and paste the water level data from Jan 1, 2021 onwards into the Groundwater Level Data portion of your EX3 spreadsheet.
Answer the following questions, and submit all graphs as directed by your instructor:
- Examine the data that you just copied into the spreadsheet. Are there any problems with this raw data set in either precipitation, stream discharge or groundwater level? What do you think may have happened?
- The two graphs show Oct 2019 to Sept 2020 as default. If needed, adjust the date range displayed on these graphs to the date range specified by your instructor. Copy/screenshot/snip these two graphs and save to a known location.
- What time lag typically occurs between larger rainfall events in the winter, and changes in discharge in the Nicomekl River? You may wish to note some larger rainfall events on an annual graph, and adjust the x-axis so that you can zoom in on those dates only. Choose one such event that supports your answer and describe.
- Examine the graph plotting precipitation and groundwater level data. Does the groundwater level respond to precipitation on a daily basis? Discuss the relationship between precipitation and groundwater level change and the associated lag times. Choose a range of data on the graph of precipitation and groundwater level that supports your conclusion.
- Groundwater levels rise and fall on a seasonal basis. What happens to the water stored in groundwater between September and February?
EX4: Water Users in the Watershed
In this exercise, you will examine some of the water users within this watershed, and consider what affect their usage has on the stream discharge, and upon the overall nature of the water balance in the watershed. In other words, you will be introduced to the complexity of water management in BC.
The hydrograph and groundwater levels within the Nicomekl River watershed are affected by the use of water by humans living within the watershed. Here, drinking water usage is consistent year-round, irrigation water usage peaks in summer time, and commercial use varies throughout the year.
Figure 20.7 indicates the approximate area of the Nicomekl River watershed (Figure 20.7a) and the locations of licensed surface water (Figure 20.7b) and groundwater (Figure 20.7c) water users within the watershed.
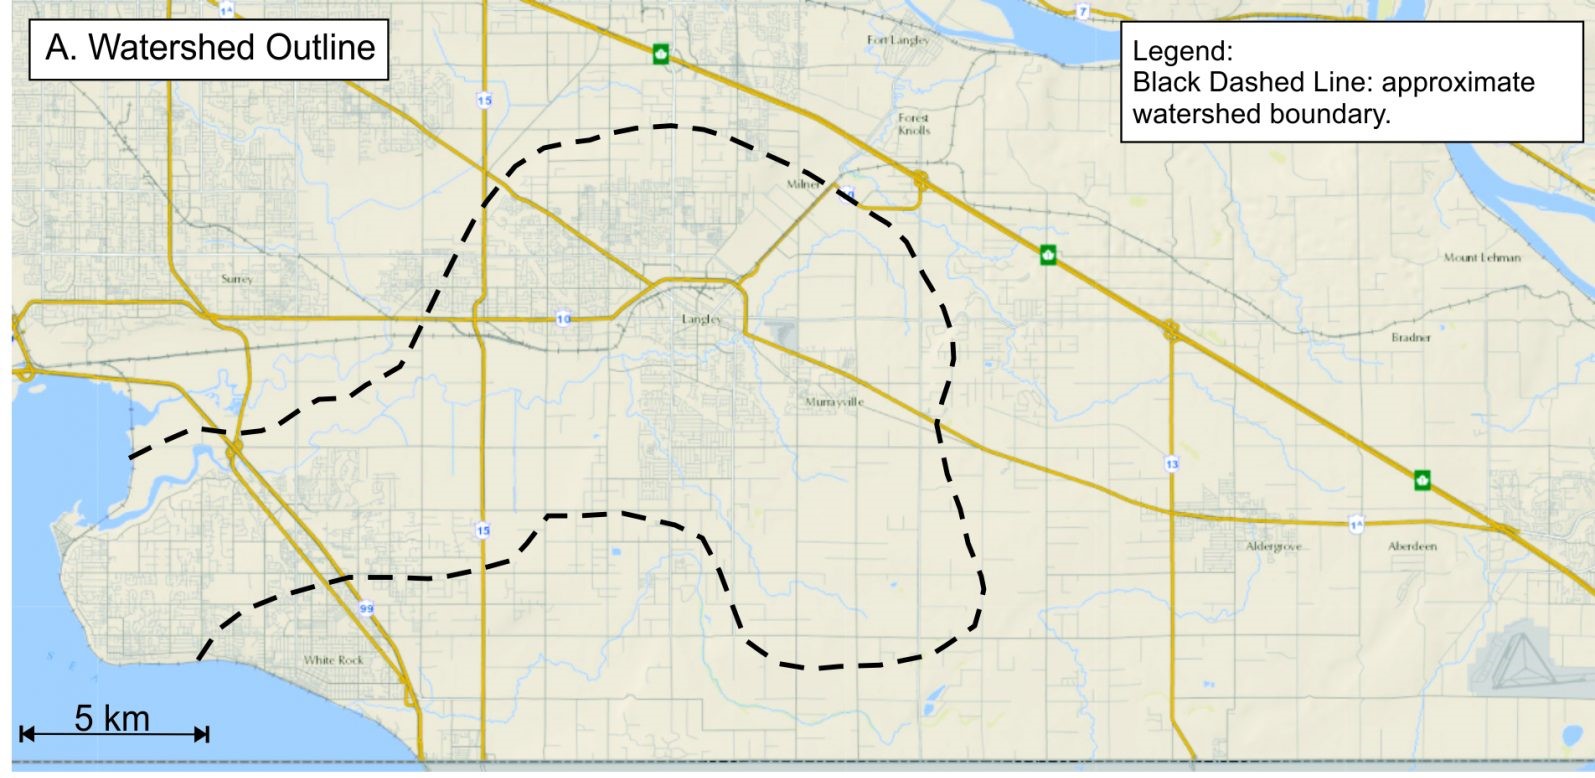

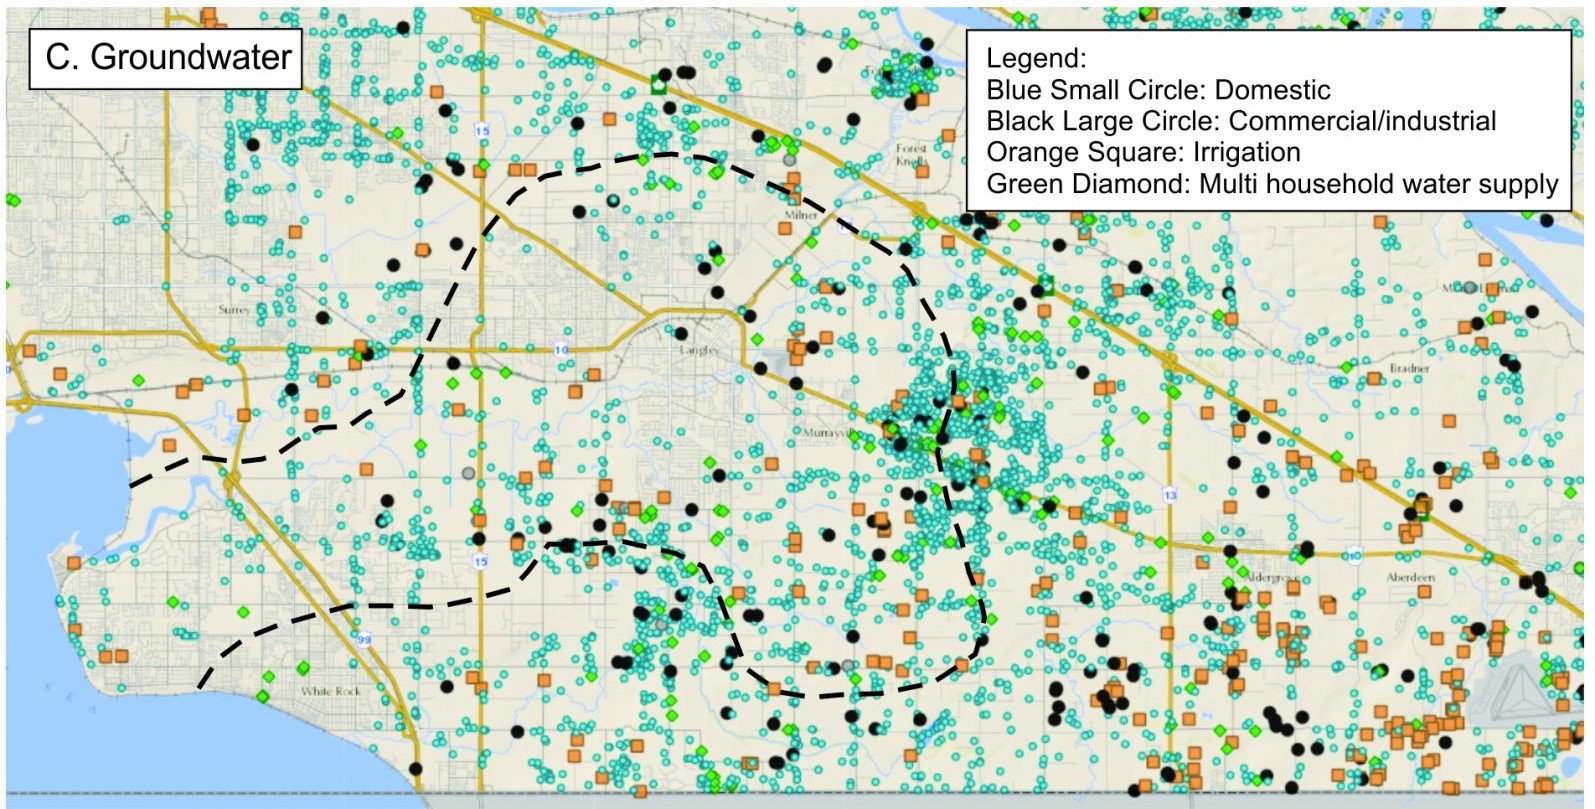
Using Figure 20.7, answer the following questions:
- Which areas of the watershed use the most surface water? What usage type do you think these water licenses are used for? Are they domestic, water supply, irrigation, commercial? Explain your answer.
- Which areas of the watershed have single households (domestic use) that rely upon groundwater for their water supply? Explain your answer.
- Based on the distribution of all of the surface licenses and groundwater wells, can you determine which areas of the watershed have their drinking water supplied from a large water supplier? Explain your answer.
- Which area of the watershed do you think is the most environmentally sensitive? Why did you pick this area?
Reflection Questions
In the lab exercises, you saw that the lag time between precipitation in a watershed and surface water and groundwater responses vary. Consider the following situation.
Three farmers have asked permission to pump water to irrigate their crops in July and August. One farmer has a pump that removes water directly from the river. The second farmer pumps from a groundwater well located 10 metres from the river. The third farmer pumps from a well located 2000 m from the river. The local fisheries officer is worried about low water flows in the river in late summer and fall because the river provides habitat for salmon and freshwater trout at this time of year.
- Describe if/how each pumping situation will impact the river and discuss timescale. You may include sketches of your wells indicating directions of water movement if they would help with your explanation.
- You are tasked with deciding which, if any, farmer should get a water license to extract water. Discuss three types of information you need to consider in making your decision and why.
Worksheets
EX3: Student Spreadsheet Template:
References
Water Science Group. (2018). How streamflow is measured. United States Geological Survey. https://www.usgs.gov/special-topic/water-science-school/science/how-streamflow-measured?qt-science_center_objects=0#qt-science_center_objects
Media Attributions
- Water Cycle | How the Hydrologic Cycle Works by National Science Foundation is licensed under a Standard YouTube License.
- What Is Groundwater? by KQED QUEST is licensed under a Standard YouTube License.
- Have you drunk DINOSAUR PEE? by Cisco Torres and Harrison Dreves, posted by CuriousMinds is licensed under a Standard YouTube License.
Image Descriptions
Figure 20.2. Example of Precipitation data from the White Rock climate station.
Figure 20.2 provides an example graph of precipitation data from the White Rock climate station that was obtained from the BC Water Tool. Data displayed on this graph are the: (a) cumulative amount of precipitation for each month in the current year, (b) historic median, (c) historical 75th percentile, (d) historical 25th percentile, (e) historical 90th percentile, and (f) the historical 10th percentile.
Your instructor will provide you with the time period to use for the relevant lab exercises, so the data will be different than what is provided in this figure.
