Chapter 7: Sampling Techniques
7.3 Probabilistic and Non-Probabilistic Sampling Techniques
What constitutes an appropriate sample depends upon the research question(s), the research objectives, the researcher’s understanding of the phenomenon under study (developed through the literature review), and practical constraints (Palys & Atchison, 2014). These considerations will influence whether the researcher chooses to employ probabilistic or non-probabilistic sampling techniques. Probabilistic sampling techniques are employed to generate a formal or statistically representative sample. This technique is utilized when the researcher has a well-defined population to draw a sample from, as is often the case in quantitative research. This fact enables the researcher to generalize back to the broader population (Palys & Atchison, 2014). On the other hand, a non-probabilistic sampling technique is the method of choice when the population is not created equal and some participants are more desirable in advancing the research project´s objectives. Non-probability sampling techniques are the best approach for qualitative research. Because the researcher seeks a strategically chosen sample, generalizability is more of a theoretical or conceptual issue, and it is not possible to generalize back to the population (Palys & Atchison, 2014).
Probabilistic Sampling Techniques
As previously mentioned, probability sampling refers to sampling techniques for which a person’s (or event’s) likelihood of being selected for membership in the sample is known. You might ask yourself why we should care about a study element’s likelihood of being selected for membership in a researcher’s sample. The reason is that, in most cases, researchers who use probability sampling techniques are aiming to identify a representative sample from which to collect data. A representative sample is one that resembles the population from which it was drawn in all the ways that are important for the research being conducted. If, for example, you wish to be able to say something about differences between men and women at the end of your study, you must make sure that your sample doesn’t contain only women. That is a bit of an oversimplification, but the point with representativeness is that if your population varies in some way that is important to your study, your sample should contain the same sort of variation. While there is a formula to help you determine the sample size you will need to ensure representativeness, one of the easiest ways to do this is through an online sample size calculator. The calculator will do the work for you and tell you the minimum number of samples you will need in order to meet the desired statistical limitations.
Obtaining a representative sample is important in probability sampling because a key goal of studies that rely on probability samples is generalizability. In fact, generalizability is perhaps the key feature that distinguishes probability samples from nonprobability samples. Generalizability refers to the idea that a study’s results will tell us something about a group larger than the sample from which the findings were generated. In order to achieve generalizability, a core principle of probability sampling is that all elements in the researcher’s target population have an equal chance of being selected for inclusion in the study. In research, this is the principle of random selection. Random selection is a mathematical process that must meet two criteria. The first criterion is that chance governs the selection process. The second is that every sampling element has an equal probability of being selected (Palys & Atchison, 2014).
The core principal of probability sampling is random selection. If a researcher uses random selection techniques to draw a sample, he or she will be able to estimate how closely the sample represents the larger population from which it was drawn by estimating the sampling error.
Sampling error is the degree to which your sample deviates from the population’s characteristics. It is a statistical calculation of the difference between results from a sample and the actual parameters of a population. It is important to ensure that there is a minimum of sampling error (your sample needs to match the diversity of the population as closely as possible.) Sampling error comes from two main sources – systemic error and random error. Random error is due to chance, while systemic error means that there is some bias in the selection of the sample that makes particular individuals more likely to be selected than others. Here is an example to more fully explain the difference between a random and systemic error.
Example: Random and systemic errors
Consider the study of playground conditions for elementary school children. You would need a sampling frame (or list from which you sample) and select from that. Random sampling error would occur by chance and could not be controlled, but systemic error would be possible. Let us say that the list is designed in such a way that every 5th school is a private school. If you were to randomly sample every 5th school on the list, you would end up with a sample exclusively from private schools! Sampling error just means that an element of the population is more likely to be selected for the sample than another (in this case, the private schools are more likely to be sampled than the public schools).
Why is this discussion of error important? The use of the right techniques for sampling gives researchers the best chances at minimizing sampling error, and thus the strongest ability to say their results are reflective of the population. Research is done to benefit society in some way, so it is important that research results reflect what we might expect to see in society. Sample size also impacts sampling error. Generally, the bigger the sample, the smaller the error. However, there is a point of diminishing returns where only small reductions in error occur for increases in size. Cost and resources usually also prohibit very large samples, so ultimately the sample size is dependent upon a variety of factors, of which sampling error is only one Probability sampling techniques.
There are a variety of probability samples that researchers may use. For our purposes, we will focus on four: simple random samples, systematic samples, stratified samples, and cluster samples (Table 7.1 has a summary of these four techniques). Simple random samples are the most basic type of probability sample, but their use is not particularly common. Part of the reason for this may be the work involved in generating a simple random sample. To draw a simple random sample, a researcher starts with a list of every single member, or element, of his or her population of interest. This list is sometimes referred to as a sampling frame. Once that list has been created, the researcher numbers each element sequentially and then randomly selects the elements from which he or she will collect data. To randomly select elements, researchers use a table of numbers that have been generated randomly. There are several possible sources for obtaining a random number table. Some statistics and research methods textbooks offer such tables as appendices to the text. Perhaps a more accessible source is one of the many free random number generators available on the Internet. A good online source is the website Stat Trek, which contains a random number generator that you can use to create a random number table of whatever size you might need.
As you might have guessed, drawing a simple random sample can be quite tedious. Systematic sampling techniques are somewhat less tedious but offer the benefits of a random sample. As with simple random samples, you must be able to produce a list of every one of your population elements. Once you have done that, to draw a systematic sample you would simply select every kth element on your list. But what is “k”, and where on the list of population elements does one begin the selection process? The symbol “k” is your selection interval or the distance between the elements you select for inclusion in your study. To begin the selection process, you would need to figure out how many elements you wish to include in your sample.
Let us say you want to interview 25 students from the Law program at your college or university. You do some research and discover that there are 150 students currently registered in the program. In this case, your selection interval, or k, is 6. To arrive at 6, simply divide the total number of population elements by your desired sample size. To determine where on your list of population elements to begin selecting the names of the 25 students you will interview, select a random number between 1 and k, and begin there. If we randomly select 3 as our starting point, we would begin by selecting the third student on the list and then select every sixth student from there.
There is one clear instance in which systematic sampling should not be employed. If your sampling frame has any pattern to it, you could inadvertently introduce bias into your sample by using a systemic sampling strategy. This is sometimes referred to as the problem of periodicity. Periodicity refers to the tendency for a pattern to occur at regular intervals. For example, suppose you want to observe how people use the outdoor public spaces in your city or town and you need to complete your observations within 28 days. During this time, you wish to conduct four observations on randomly chosen days. To determine which days you will conduct your observations, you will need to determine a selection interval. As you will recall from the preceding paragraphs, to do so you must divide your population size – in this case 28 days – by your desired sample size, in this case 4 days. This formula leads you to a selection interval of 7. If you randomly select 2 as your starting point and select every seventh day after that, you will wind up with a total of 4 days on which to conduct your observations. But what happens is that you are now observing on the second day of the week, being Tuesdays. As you have probably figured out, that is not such a good plan if you really wish to understand how public spaces in your city or town are used. Weekend use probably differs from weekday use, and that use may even vary during the week.
In cases such as this, where the sampling frame is cyclical, it would be better to use a stratified sampling technique. In stratified sampling, a researcher will divide the study population into relevant subgroups and then draw a sample from each subgroup. In this example, you might wish to first divide your sampling frame into two lists: weekend days and weekdays. Once you have your two lists, you can then apply either simple random or systematic sampling techniques to each subgroup.
Stratified sampling is a good technique to use when, as in the example, a subgroup of interest makes up a relatively small proportion of the overall sample. In the example of a study of use of public space in your city or town, you want to be sure to include weekdays and weekends in your sample. However, because weekends make up less than a third of an entire week, there is a chance that a simple random or systematic strategy would not yield sufficient weekend observation days. As you might imagine, stratified sampling is even more useful in cases where a subgroup makes up an even smaller proportion of the study population, say, for example, if you want to be sure to include both male and female perspectives in a study, but males make up only a small percentage of the population. There is a chance that simple random or systematic sampling strategy might not yield any male participants, but by using stratified sampling, you could ensure that your sample contained the proportion of males that is reflective of the larger population. Let us look at another example to help clarify things.
Example #1 Choosing a sampling technique
Suppose a researcher wanted to talk to police officers in Canada about their views on illegal drug use in the general population. A researcher could find a list of all Canadian police officers (a sampling frame) and do a simple random sample or a systematic sample with random start from that list. But what if the researcher wanted to ensure that female and male officers were included in the same proportions they are in the population of officers? Or if they wanted to ensure that urban and rural officers are represented as they are in the population of police? In these cases, stratified random sampling might be more appropriate. If the goal is to have the subgroups reflect the proportions in the population then proportional stratification should be used if the population is homogenous (Scribbr, n.d.). We use stratified random sampling if the population is homogenous. For example, you want to undertake your research with people who live in British Columbia and how exercise a minimum of three times per week. Or you want to undertake your research with retired police officers in Ontario who have been diagnosed with post-traumatic stress disorder. With proportional stratification, the sample size of each subgroup is proportionate to the population size of the group. In other words, each subgroup has the same sampling fraction. The sampling fraction is the proportion of the population that the researcher wants included in the sample. It is equal to the sample size, divided by the population size (n/N) (see Palys & Atchison, 2014).
However, if the researcher wants to be able to compare male and female officers or rural and urban officers (or a more complicated concept: male and female officers within the rural and urban areas), a disproportional stratification may be used instead to ensure that the researcher has enough members of the subgroups to allow between group comparisons. With a disproportional sample, the size of the each sample subgroup does not need to be proportionate to the population size of the group. In other words, two or more strata will have different sampling fractions (see Palys & Atchison, 2014).
Up to this point in our discussion of probability samples, we have assumed that researchers will be able to access a list of population elements in order to create a sampling frame. This, as you might imagine, is not always the case. Let us say, for example, that you wish to conduct a study of bullying in high schools across Canada. Just imagine trying to create a list of every single high school student in the country. Even if you could find a way to generate such a list, attempting to do so might not be the most practical use of your time or resources. When this is the case, researchers turn to cluster sampling. Cluster sampling occurs when a researcher begins by sampling groups (or clusters) of population elements and then selects elements from within those groups. It is important that the clusters are heterogenous, meaning that they are as diverse as possible; however, each cluster should have a similar distribution of the same characteristics reflected in the population of study, as a whole. Often, this is challenging to achieve, and this is why simple random sampling is often the better choice, because simple random sampling has more statistical certainty than cluster sampling.
Scribbr. (n.d.) has more detail on how to undertake a cluster sample.
Here is an example of when a cluster sampling technique would be suitable:
Example #2 – Cluster sampling
Perhaps you are interested in the workplace experiences of college instructors. Chances are good that obtaining a list of all instructors that work for Canadian colleges would be rather difficult. You would be more likely, without too much hassle, to come up with a list of all colleges in Canada. Consequently, you could draw a random sample of Canadian colleges (your cluster) and then draw another random sample of elements (in this case, instructors) from within the colleges you initially selected. Cluster sampling works in stages. In this example we sampled in two stages. As you might have guessed, sampling in multiple stages does introduce the possibility of greater error (each stage is subjected to its own sampling error), but it is nevertheless a highly efficient method.
Now suppose colleges across the country were not willing to share their instructor lists? How might you sample then? Is it important that the instructors in your study are representative of all instructors? What happens if you need a representative sample, but you do not have a sampling frame? In these cases, multi-stage cluster sampling may be appropriate. This complex form of cluster sampling involves dividing the population into groups (or clusters). The researcher chooses one or more clusters at random and samples everyone within the chosen cluster (see Palys & Atchison, 2014).
| Samples type | Description |
| Simple Frame | Researcher randomly selects elements from sampling. |
| Systematic Frame | Researcher Selects every Kth element from sampling. |
| Stratified Frame | Researcher creates sub-groups then randomly selects from each. |
| Cluster | Researcher randomly selects clusters then randomly selects elements from clusters. |
Nonprobability Sampling Techniques.
Nonprobability sampling refers to sampling techniques for which a person’s (or event’s or researcher’s focus) likelihood of being selected for membership in the sample is unknown. Because we do not know the likelihood of selection, we do not know whether or not a nonprobability sample represents a larger population. Representing the population is not the goal with nonprobability samples, however the fact that nonprobability samples do not represent a larger population does not mean that they are drawn arbitrarily or without any specific purpose in mind. The following subsection, “Types of Nonprobability Samples,” examines more closely the process of selecting research elements when drawing a nonprobability sample. But first, let us consider why a researcher might choose to use a nonprobability sample.
One instance might be at the design stage of a research project. For example, if you are conducting survey research, you may want to administer the survey to a few people who seem to resemble the people you are interested in studying in order to help work out kinks in the survey. You might also use a nonprobability sample at the early stages of a research project if you are conducting a pilot study or exploratory research. Researchers also use nonprobability samples in full-blown research projects. These projects are usually qualitative in nature, where the researcher’s goal is in-depth, idiographic understanding rather than more general, nomothetic1 understanding. Evaluation researchers whose aim is to describe some very specific small group might use nonprobability sampling techniques. Researchers interested in contributing to our theoretical understanding of a phenomenon might also collect data from nonprobability samples. Researchers interested in contributing to social theories, by either expanding on them, modifying them, or poking holes in their propositions, might use nonprobability sampling techniques to seek out cases that seem anomalous in order to understand how theories can be improved.
In sum, there are many instances in which the use of nonprobability samples makes sense. The next subsection will examine several specific types of nonprobability samples.
Nonprobability sampling techniques
Researchers use several types of nonprobability samples, including: purposive samples, snowball samples, quota samples, and convenience samples. While the latter two strategies may be used by quantitative researchers from time to time, they are more typically employed in qualitative research; because they are both nonprobability methods, we include them in this section of the chapter.
To draw a purposive sample, researchers begin with specific perspectives that they wish to examine in mind, and then seek out research participants who cover that full range of perspectives. For example, if you are studying students’ level of satisfaction with their college or university program of study, you must include students from all programs, males and females, students of different ages, students who are working and those who are not, students who are studying online and those who are taking classes face-to-face, as well as past and present. While purposive sampling is often used when one’s goal is to include participants who represent a broad range of perspectives, purposive sampling may also be used when a researcher wishes to include only people who meet very narrow or specific criteria.
Qualitative researchers sometimes rely on snowball sampling techniques to identify study participants. In this case, a researcher might know of one or two people he or she would like to include in the study, but then relies on those initial participants to help identify additional study participants. Thus, the researcher’s sample builds and becomes larger as the study continues, much as a snowball builds and becomes larger as it rolls through the snow. Snowball sampling is an especially useful strategy when a researcher wishes to study some stigmatized group or behaviour. Having a previous participant vouch for the trustworthiness of the researcher may help new potential participants feel more comfortable about being included in the study. Snowball sampling is sometimes referred to as chain referral sampling. One research participant refers another, and that person refers another, and that person refers another—thus a chain of potential participants is identified. In addition to using this sampling strategy for potentially stigmatized populations, it is also a useful strategy to use when the researcher’s group of interest is likely to be difficult to find, not only because of some stigma associated with the group, but also because the group may be relatively rare.
When conducting quota sampling, a researcher identifies categories that are important to the study and for which there is likely to be some variation. Subgroups are created based on each category and the researcher decides how many people (or documents or whatever element happens to be the focus of the research) to include from each subgroup and collects data from that number for each subgroup. While quota sampling offers the strength of helping the researcher account for potentially relevant variation across study elements, we must remember that such a strategy does not yield statistically representative findings. And while this is important to note, it is also often the case that we do not really care about a statistically representative sample, because we are only interested in a specific case.
Let us go back to a previous example of student satisfaction with their college or university course of study, to look at an example of how a quota sampling approach would work in such a study.
Example
Imagine you want to understand how student satisfaction varies across two types programs: the Emergency Services Management (ESM) degree program and the ESM diploma program. Perhaps you have the time and resources to interview 40 ESM students. Since you are interested in comparing the degree and the diploma program, you decide to interview 20 students from each program. In your review of literature on the topic before you began the study, you learned that degree and diploma experiences can vary by age of the students. Consequently, you decide on four important subgroup: males who are 29 years of age or younger, females who are 29 years of age or younger, males who are 30 years of age or older, and females who are thirty years of age or older. Your findings would not be representative of all students who enroll in degree or diploma programs at the college, or at other institutions; however, this is irrelevant to your purposes since you are solely interested in finding out about the satisfaction level of ESM students who are enrolled in either the ESM degree or diploma program.
Finally, convenience sampling is another nonprobability sampling strategy that is employed by both qualitative and quantitative researchers. To draw a convenience sample, a researcher simply collects data from those people or other relevant elements to which he or she has most convenient access. This method, also sometimes referred to as haphazard sampling, is most useful in exploratory research. It is also often used by journalists who need quick and easy access to people from their population of interest. If you have ever seen brief interviews of people on the street on the news, you have probably seen a haphazard sample being interviewed. While convenience samples offer one major benefit—convenience—we should be cautious about generalizing from research that relies on convenience sampling.
Table 7.2 provides a summary of the main differences between probability and non-probability sampling.
| Basis of comparison | Probability sampling | Non-probability sampling |
| Definition | A sampling technique that is used with subjects of the population have an equal chance of being selected as part of a representative sample. Referred to as random sampling. | A sampling technique that is used with subjects of the population when it is not known which individual will be selected as part of the sample. Referred to as non-random sampling. |
| How participants are selected | Random sampling | Arbitrarily or logically |
| Opportunity for participants to be selected | Fixed and known | Not known |
| Research | Conclusive findings | Exploratory findings |
| Inference or interpretation | Statistical | Analytical |
| Hypothesis | Tested | Developed |
| Sampling methods | Simple random sampling; systematic sampling; stratified sampling; cluster sampling | Purposive sampling; snowball sampling; quota sampling; convenience sampling |
| Type of research | Quantitative | Quantitative and qualitative |
| Adapted from Surbhi (2016). Differences between probability and non-probability sampling. Retrieved from https://keydifferences.com/difference-between-probability-and-non-probability-sampling.html | ||
You will recall in Section 6.2 we discussed random assignment, which is different than random sampling. The following matrix will help differentiate the two.
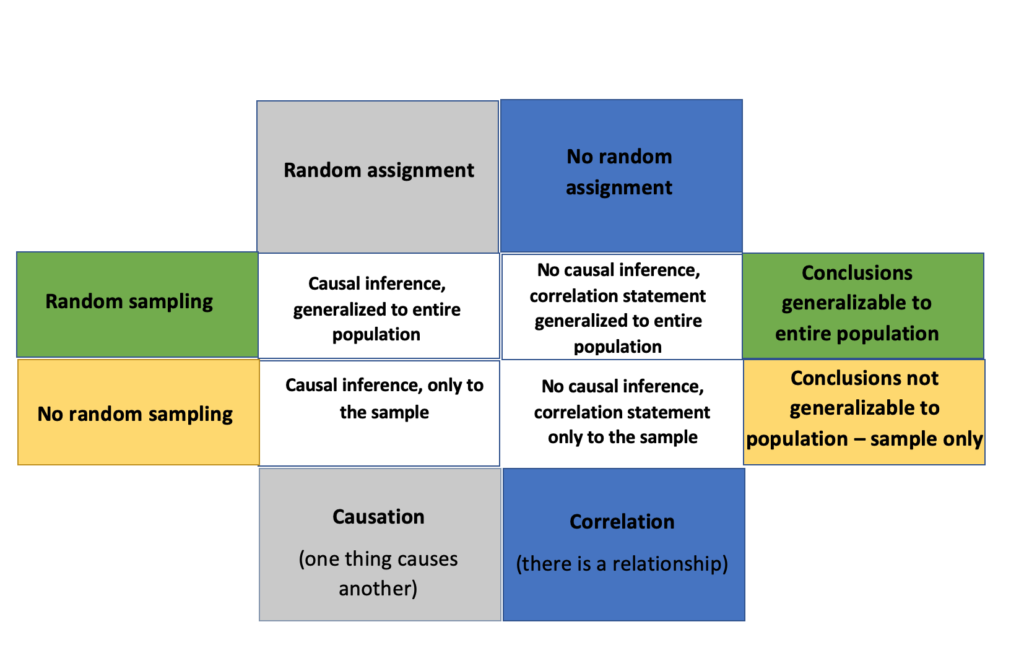
Adapted from Cetinkaya-Rundel, M. (n.d.). Random sampling vs. assignment. Retrieved from https://www2.stat.duke.edu/courses/Fall12/sta101.001/resources/lecturettes/random_sample_assignment.pdf
A Word of Caution about Sampling: Questions to Ask about Samples
We read and hear about research results so often that we might overlook the need to ask important questions about where research participants come from and how they are identified for inclusion in a research project. It is easy to focus only on findings when we are busy and when the really interesting stuff is in a study’s conclusion, not its procedures. Now that you have some familiarity with the variety of procedures for selecting study participants, you are equipped to ask some very important questions about the findings you read, and to be a more responsible consumer of research.
