Lab 10: BC Soils and Relationships to Vegetation and Climate
Nina Hewitt
Soils are fundamental to life on land. Soils supply water, nitrogen, and all of the mineral nutrients (potassium, calcium, etc.) to photosynthetic plants, which are the base of food webs in terrestrial ecosystems. Soils are the medium in which plants root and gain support, and they host the micro- and macro-biota that break down and cycle organic nutrients in ecosystems. Viewed in profile, one can see distinctive horizontal layers through a soil column that reflect the age of the soil and the particular environments in which the soil formed. These layers are called horizons. With some knowledge and a good eye, it is possible to read or interpret soil processes based on their visible characteristics.
In this lab we will explore some important soil types in BC, their properties visible in a vertical profile, and the related formational processes. At the end of the lab, you should be able to begin describing and interpreting soils in the field.
Learning Objectives
After completion of this lab, you will be able to
- Name and describe most major soil types (orders) present in BC.
- Identify the soil profile characteristics that define these soil orders.
- Name and describe the major mineral horizons and some sub-horizons in soils.
- Visualize a variety of soil profiles and how their properties change with depth.
- Relate soils to climate, biogeoclimatic zones, and parent materials.
- Relate soil profile characteristics such as colour, texture and horizon depth to soil processes such as eluviation and organic matter deposition.
- Work with resources for visualizing and studying soils and ecosystems including Google Earth (Web), UBC’s SoilWeb, ClimateBC, BC’s Biogeoclimatic Ecosystem Classification (BEC zone) System, and the Canadian System of Soil Classification (CSSC).
Pre-Readings
Soil Formation and Parent Materials
Soils form in place over periods of time under the influence of other soil forming factors: climate (heat and moisture), organisms, topography, and parent materials.
Parent materials determine the mineral building blocks of most soils, and vary considerably from place to place. They are classified according their mineral characteristics, whether they are bedrock or deposits, and if the latter, the mode of deposition. For further details consult Soil Formation and Parent Material; paying special attention to colluvial, glacial, lacustrine. Glacial till is important in BC, and is comprised of varying grain sizes from fine silt and clay to coarser sand, gravel and boulders of mixed lithology (mineral composition). Till often occurs in a sequence of a layer of ablation till overlying more compacted basal or lodgement till. Watch the videos Ablation till and Basal Till if you would like a more detailed description of the formation of each till type.
Modern soil science recognizes that soils are a product of processes acting upon soils, their biota, and parent materials. At the most general level, these include additions, losses, transformations, and translocations. More specific key processes include:
- organic matter decomposition that releases and cycles nutrients, and adds humus (colloidal, decay-resistant organic particles);
- chemical weathering of minerals to produce fine colloidal silicate clay particles;
- vertical translocations such as eluviation and illuviation that contribute to horizon formation in rainy climates. Watch this video of Examples of Eluviation and Illuviation Soil Formation Processes for further details.
Soil Profiles and Properties
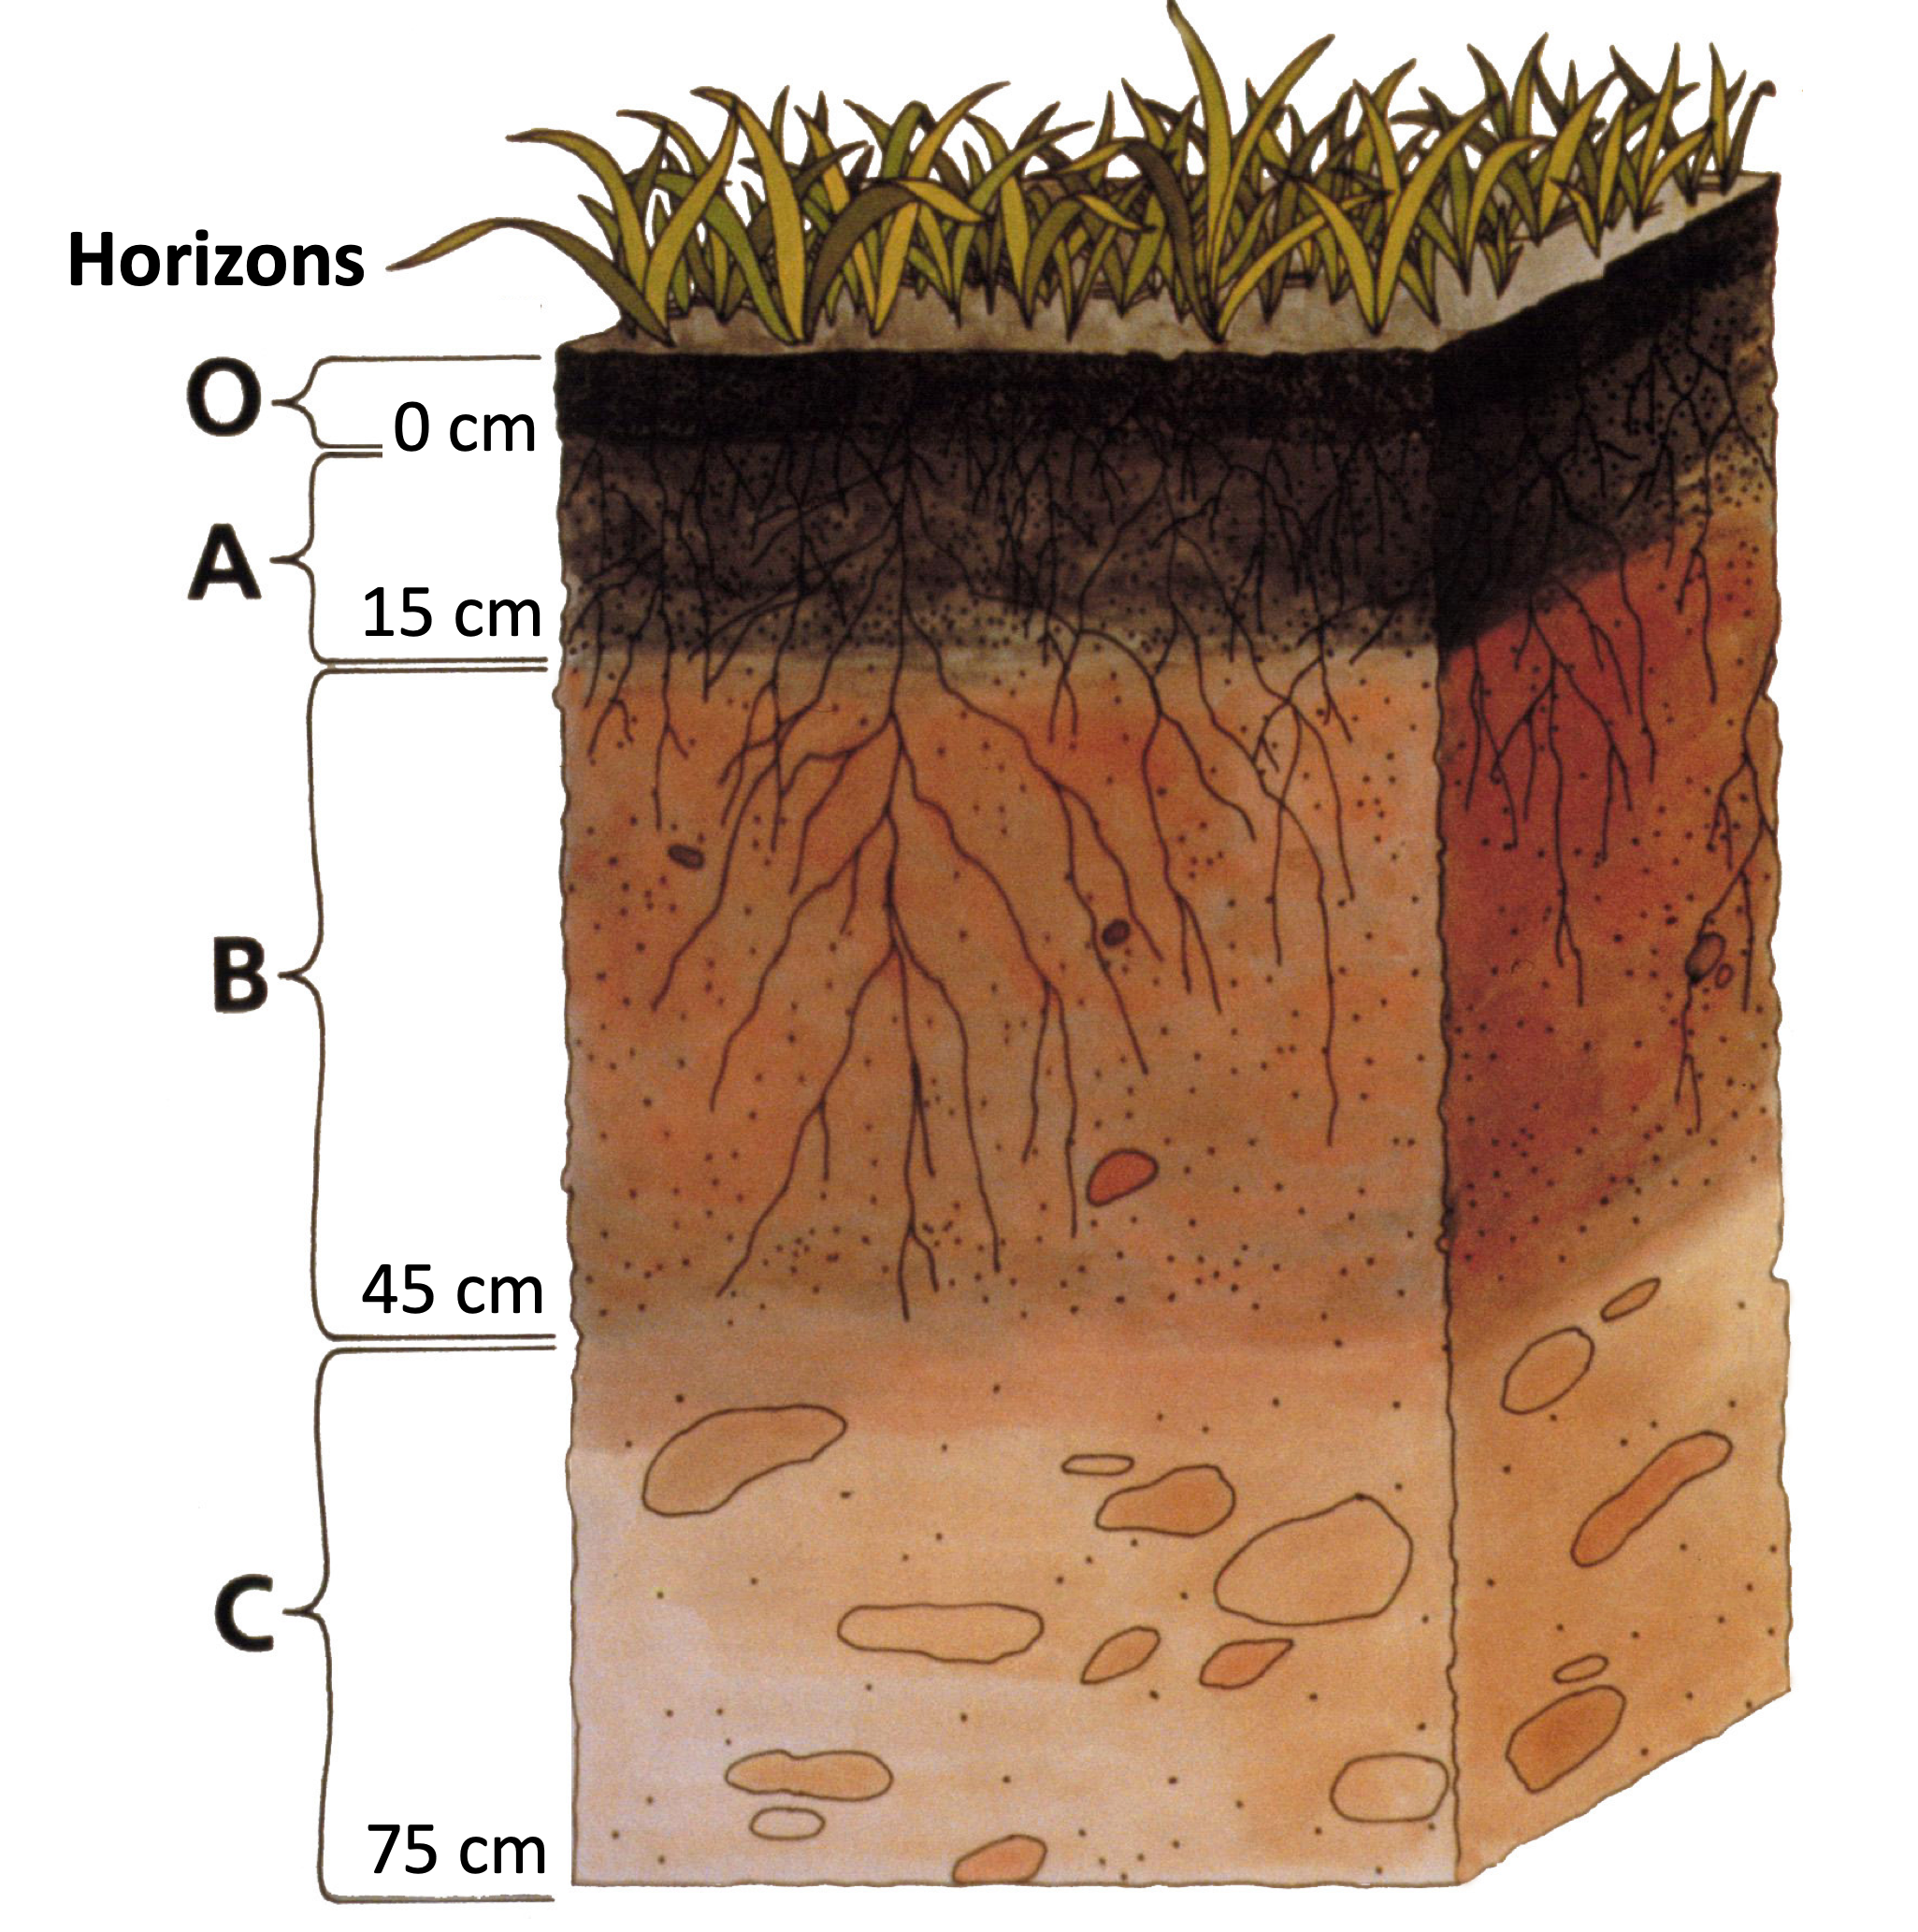
To study soils we use the soil profile: a vertical cross-section, or side-on view, of about 1 metre depth (Figure 10.1).
Soil profiles are normally described at two levels:
- in the field, different horizons are identified and described using simple observable properties such as colour and texture (feel method) and
- samples taken from each horizon identified are later subjected to detailed physical and chemical analysis in the laboratory.
The soil characteristics that can be assessed in the field, and which you may see evidence of in this lab, include:
- Colour, using standardized colour charts.
- Texture, typically classified using the feel of the soil.
- Structure, i.e., the aggregation of soil particles into units or peds.
- Miscellaneous special features, such as mottles, roots and pores.
Using these properties, one can identify relatively homogeneous horizontal layers or horizons within each soil profile.
Departments of agriculture in different countries have developed slightly different conventional horizon designations. In Canada, major horizons are designated by capital letters. Non-mineral horizons are designated by the letters O, L, F and H; mineral horizons by A, B, C and R). Each major horizon can be given one or more lowercase suffixes (such as e for eluviated, t for clay accumulation, g for gleyed and f for ferric iron in mineral horizons). These suffixes denote sub-horizons of the soil. We will encounter only a subset of these, which you will find described in your textbook. For a complete description of horizons and lowercase suffixes, see CSSC (1998) Chapter 2: Soil, Pedon, Control Section, and Soil Horizons.
Details of Observable Features Used in the Field Description of Soils
In addition to labelling the major horizons and their lowercase suffixes, soil properties typically noted during field descriptions of soils are detailed in Table 10.1.
| Soil Property | Description |
|---|---|
| Colour | Defined using a series of standardized Munsell soil colour charts:
To use the colour charts, a moist (or both a dry and a moist) sample of the soil on the fingertip is compared with chips through the holes in the chart until a match is found. Note that when using the charts, it is necessary to be careful not to dirty the chips – the books cost over $ 100 each! Watch this demonstration of Soil Colour determination in the field for more information. |
| Texture | Conventionally refers to soil particles smaller than 2mm in diameter, which are separated into three textural classes:
Clay tends to feel greasy and untextured, silt slightly textured, whereas with sand you can feel the individual grains between your fingers. By expressing the proportions (by weight) of each textural class as a percentage, the textural mix of any soil can be placed on a triangular diagram, and the diagram zoned into types that are given a name. This soil texture triangle may be found in your text or lecture notes. With practice, it is usually possible to place a soil into one of these types with reasonable accuracy using only feel. |
| Structure | Refers to the aggregation of individual soil particles into units called peds. The five structural types that have been distinguished by soil scientists include granular or crumb, platy, angular blocky, subangular blocky and prism-like. Consult your text or other instructional materials for diagrams. In addition, a structureless class is recognized when soil particles show no aggregation, such as a recent sand deposit. Each structural type is also separated into three size classes, fine, medium, coarse, as defined by the diameter of the peds.
A description of the ped uses both the shape and size designations, e.g., coarse granular or medium subangular blocky structure. |
| Miscellaneous Features | Include any other obvious features that can be seen in the soil horizon. Some of the most common features that are commented upon are:
Note the size and abundance for each feature. |
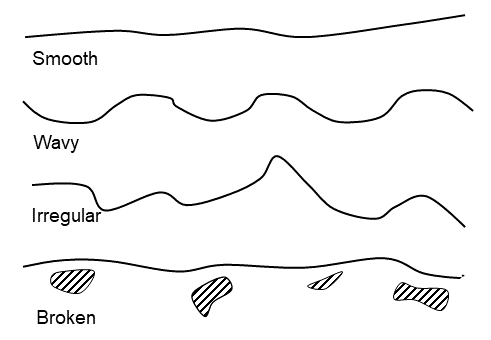
| Horizon Boundaries | At the lower horizon boundary, the transition to the next horizon is described by
|
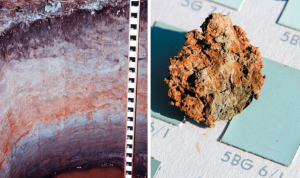
Gleying is a process in which metals in the soil such as iron (and sometimes manganese) are reduced, producing blue-grey colours in soils, often with mottling (Figure 10.3). When oxygen is present, iron is oxidized and has a reddish colour. Under situations of periodic water-logging, such as from a seasonally raised water table, oxygen is depleted, the iron is reduced and takes on a blue-grey hue.
Soil Classification in Canada
The type and combination of horizons present in the soil is used to classify the entire profile into a class of soils such as podzols or gleysols. In Canada, we use the Canadian System of Soil Classification (CSSC). The CSSC identifies 10 major soil orders which are further subdivided. Refer to Chapter 3: Outline of the System and a Key to the Classification of a Pedon for a thorough description. Table 10.2 summarizes the 10 soil orders and associated vegetation communities. Click on the name of each soil order to access a detailed description at UBC’s SoilWeb’s Classification pages.
| Canadian Soil Order | Associated Vegetation |
|---|---|
| Brunisolic | Boreal forest; mixed forest, shrubs and grass; heath and tundra |
| Chernozemic | Grasslands |
| Cryosolic | Subarctic to boreal forests, alpine forests |
| Gleysolic | Wetland, swamp |
| Luvisolic | Deciduous, mixed and coniferous forests |
| Organic | Peat, bogs and fens |
| Podzolic | Coniferous forest or heath |
| Regosolic | Mixed |
| Solonetzic | Grasses and forbs |
| Vertisolic | Grasslands |
We will be examining Organic, Podzolic, Brunisolic, Chernozemic and Regosolic soil types in this lab. Be sure you watch the videos and read the summaries on each order at the links provided in Table 10.2.
It is also recommended that you watch the following videos on UBC’s SoilWeb:
- The Podzolic Order (first 6 minutes or so, describing soils in the UBC Malcolm Knapp Research Forest.
- The Organic Order (first 9 minutes or so, describing a profile along the Coquihalla Highway).
BEC Zones
Vegetation is not only dependent on climate and topography, but also on the soil that forms in that environment. BC’s Biogeoclimatic Ecosystem Classification (BEC) system classifies ecosystems according to their major climate types, vegetation associations, and soil types. On this basis, land cover in BC has been classified into a series of different ecosystem types (BEC zones) including
- Coastal Western Hemlock and Douglas Fir Forests near the southern coast,
- Englemann Spruce-Subalpine Forest and Alpine Tundra in mid- to high-elevation locations of the Coast Mountains, and
- Ponderosa Pine, Interior Douglas Fir and Bunchgrass BEC zones in the interior.
Peruse the Biogeoclimatic Zones of British Columbia. Click on the zone name to view the map.
Lab Exercises
In this lab you will examine landscapes, climate and ecosystem characteristics, and soil profiles for 5 contrasting locations that represent the common soil types in BC. Specifically, you will
- Locate the sites using Google Earth imagery and examine the landscapes in terms of topography, elevation and other geographic factors.
- Determine climatic conditions for the locations using online climate maps and identify ecosystem characteristics, including dominant vegetation, using standard biogeoclimatic classifications (BEC zones).
- Examine the soil profiles of comparable soils using online information and imagery.
The lab consists of three exercises and should take 3 to 4 hours to complete. Please consult your instructor for submission requirements.
EX1: Understand the Field Locations Where Soils Will Be Examined
In this exercise you will explore the sites at which you will examine soils and identify and record the BEC zones, climate variables, and elevations of the sites. It should take you around one hour to complete. As you go, you will complete the missing values in Table 10.3.
Virtual Tour and Obtaining Elevation Data
- Soils reflect the regional geography. The five soils you will examine are located in and around Vancouver in southern coastal BC (two sites), inland and up the Coast Mountains (two sites), and in BC’s southern interior (one site). A Google Earth (Web) tour has been created to allow you to explore the local landscapes for each of five sites in BC and record the elevations. It should take you around 20 minutes to complete (3-5 minutes per site). Complete the tour and record the missing elevation data in Table 10.3.
Step 1: Download the Table 10.3 file to your computer from Worksheets and open it in a spreadsheet application.
Step 2: Using your browser, download this Soils of BC Instructional Tour [KML] file, upload and open it in Google Earth (Web). Alternatively, go to the online link, Soils of BC Instructional Tour. This may run slowly, so the KML file is recommended for faster load/run times.
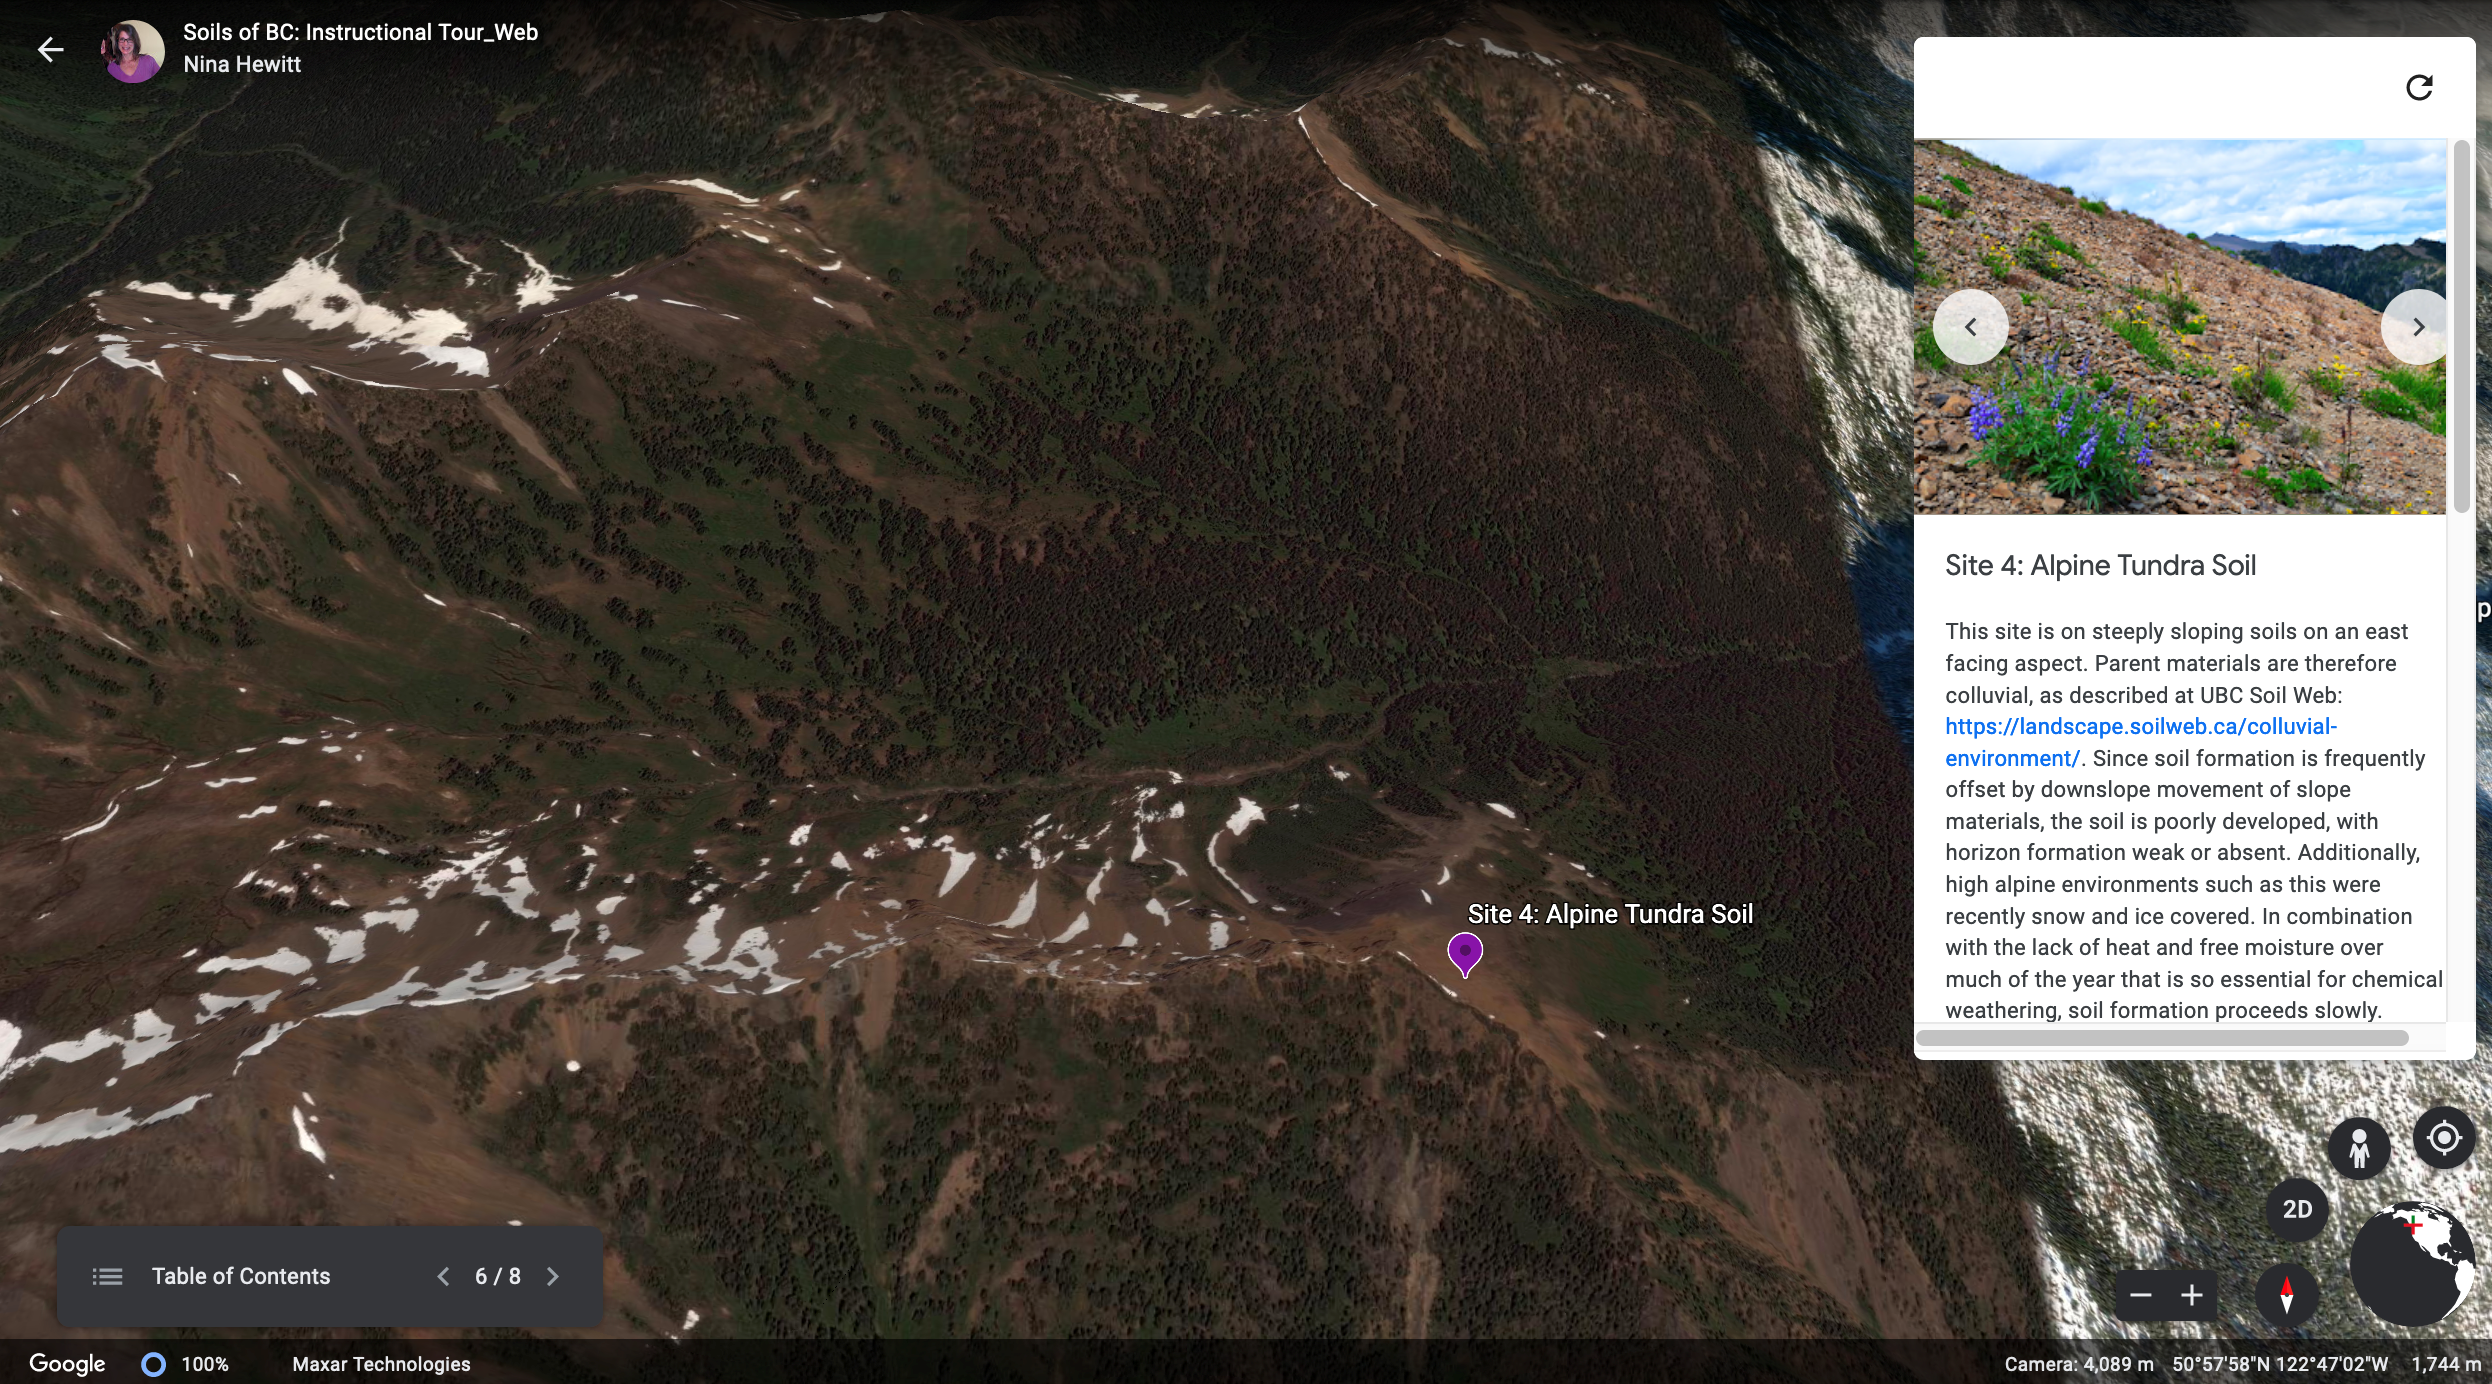
Step 3: Click Present to start the tour (Figure 10.4a). Visit each stop by clicking on the right arrow beside the Table of Contents button (Figure 10.4b).
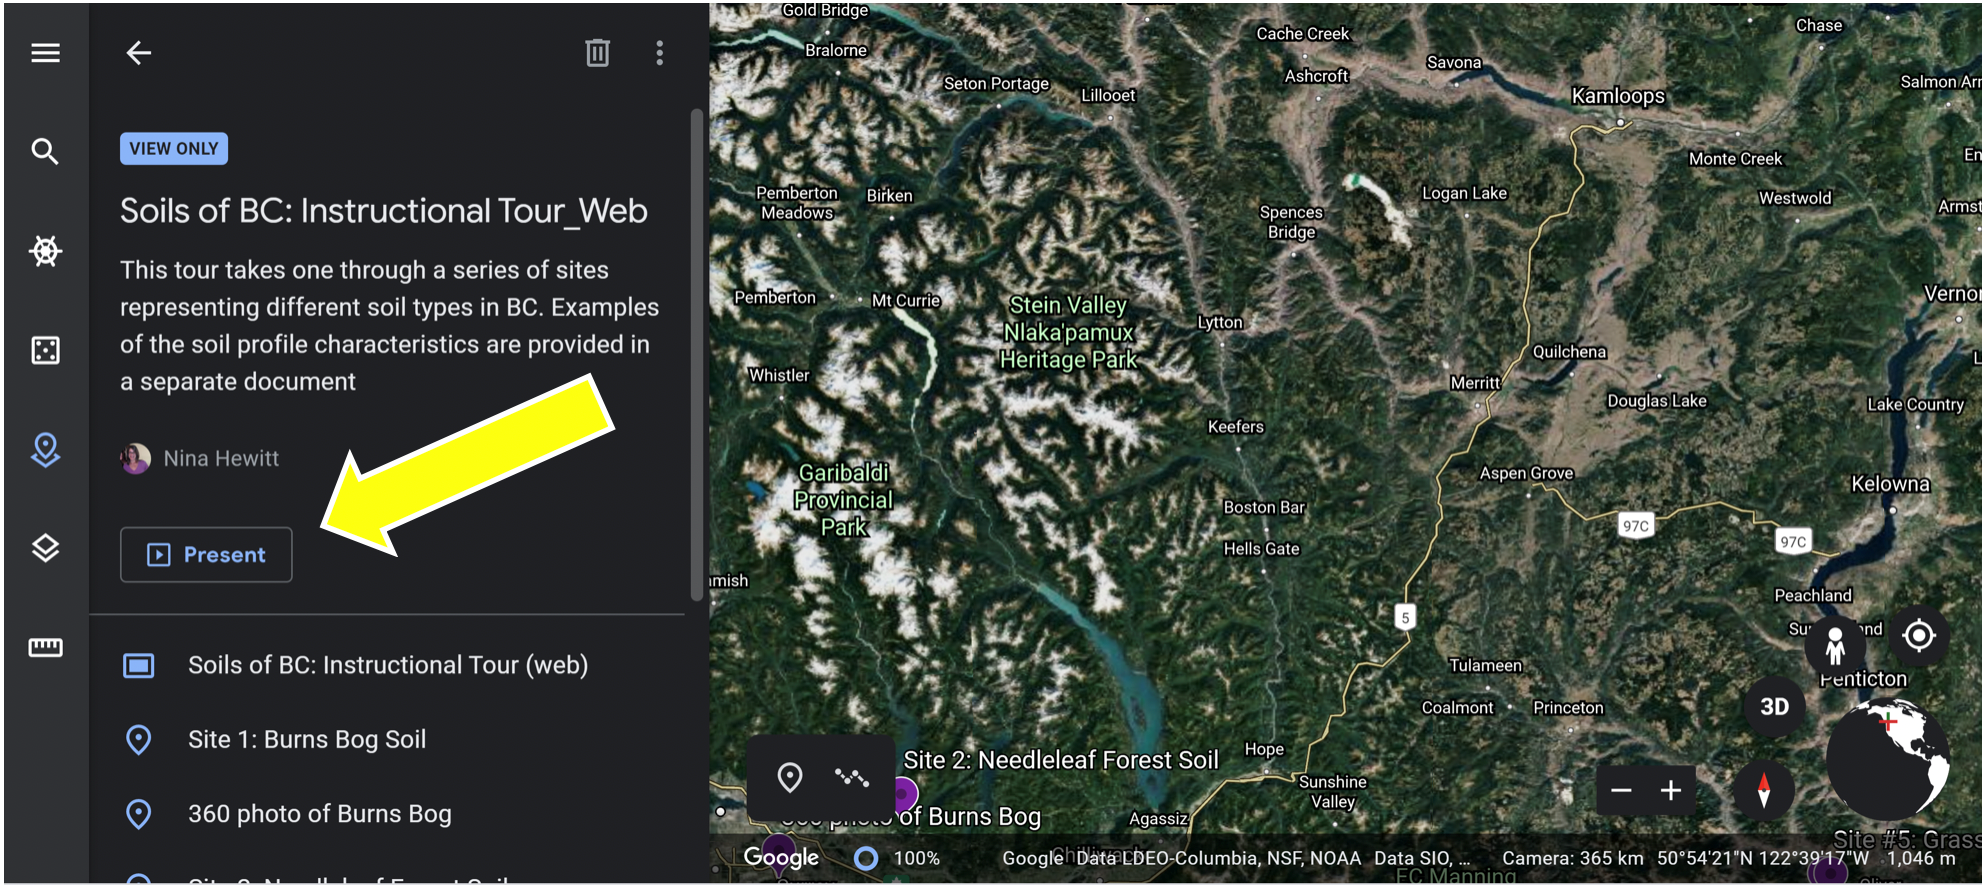
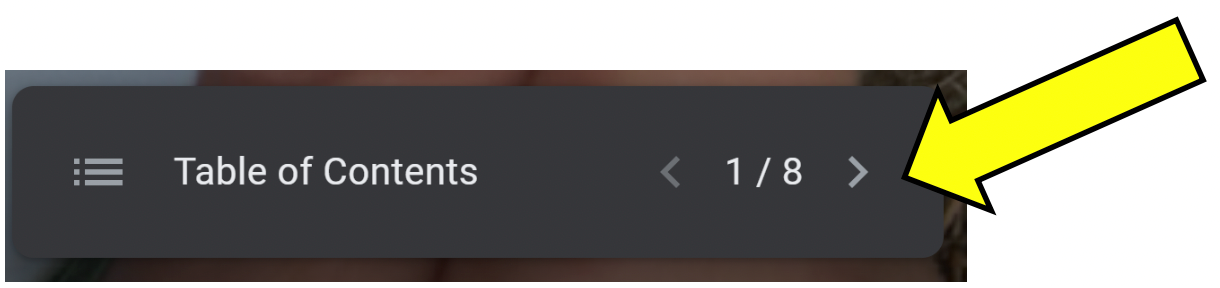
At each stop, explore the main window. View the images, read the text and watch any embedded videos in the information panel on the right. You can double-click the images to enlarge them. You can return to any stops using the Table of Contents.
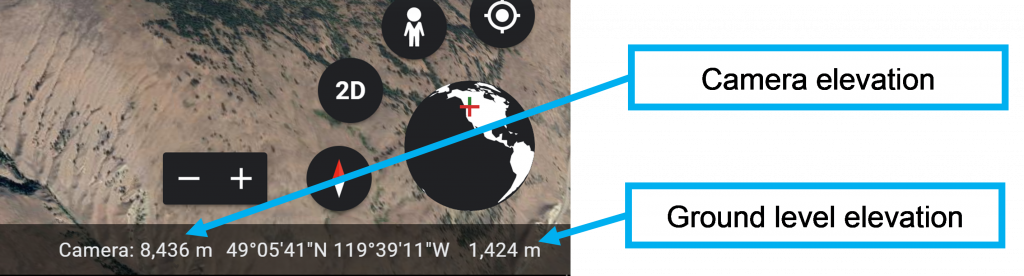
Step 4: Find the elevation for each site (Figure 10.5). Place your cursor immediately below the place marker for the site in question (e.g., Site #5: Grasslands and sagebrush soil). Record the ground level elevation indicated at the bottom right corner of the screen in Table 10.3. Do not confuse the ground level elevation with the camera elevation.
Climate and Biogeoclimatic Ecosystem Classifications (BEC)
- Climate is fundamental to the formation of soils and vegetation communities. Using the following instructions, identify the BEC zones and climate variables for each of the five sites, and record them in your Table 10.3. It should take you around 40 minutes to complete
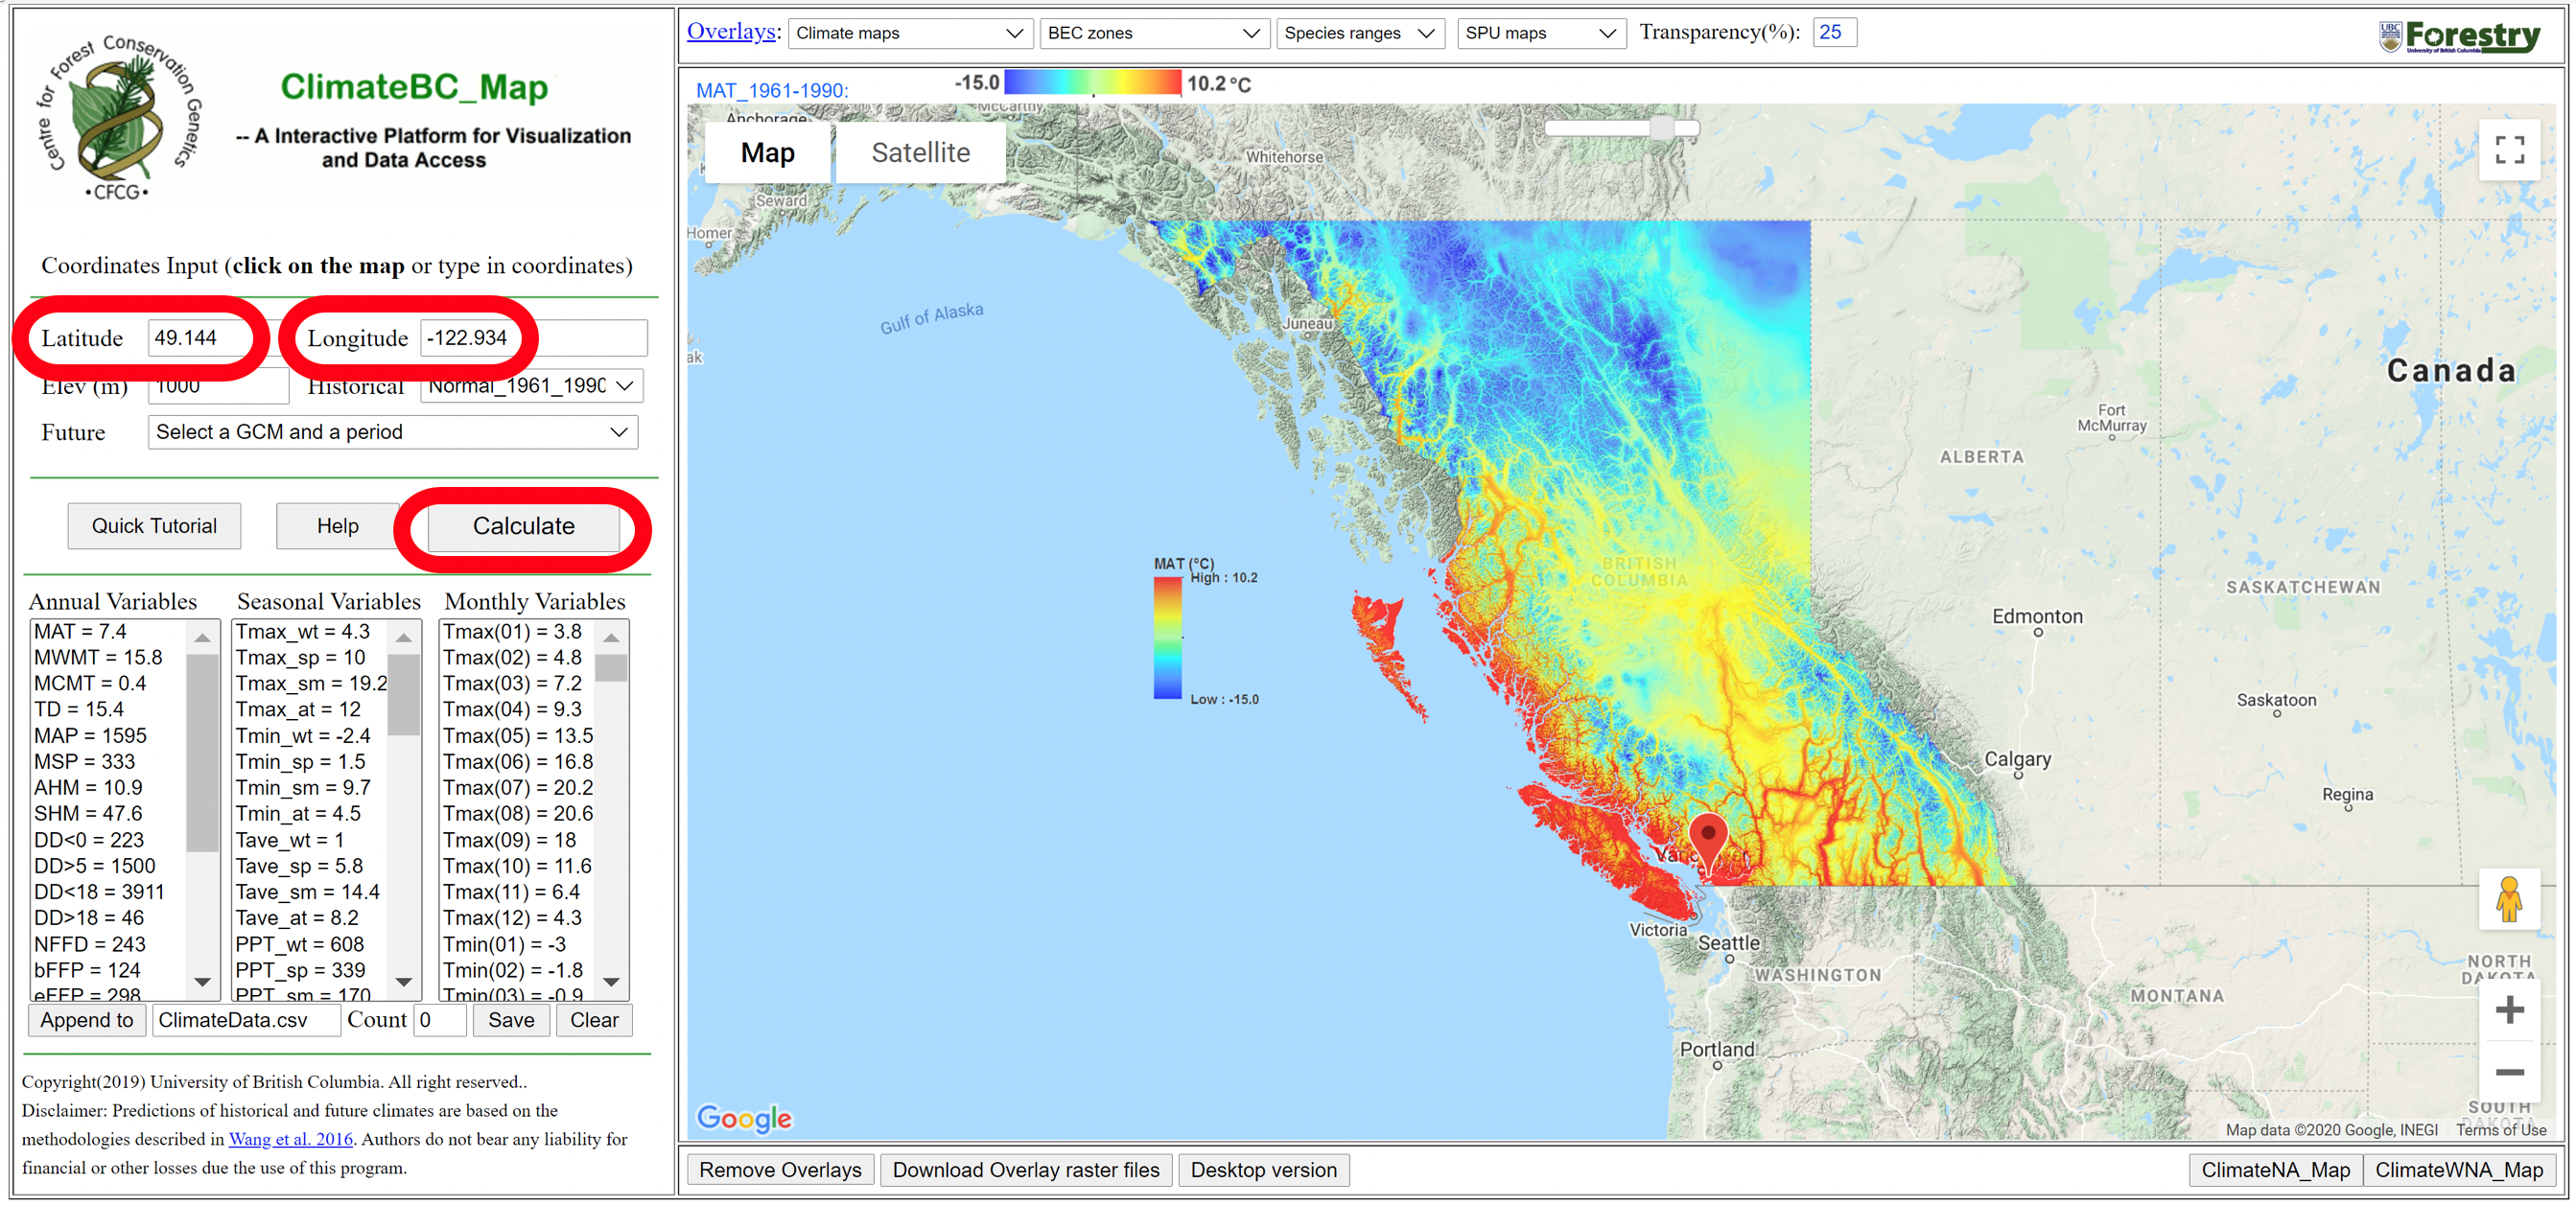
Step 1: Open the Climate BC Map on the Climate BC website. For each site of interest, enter the latitude and longitude in decimal degrees from Table 10.3 and hit Calculate (Figure 10.6). A red marker will appear on the map at the specified location. Zoom in using the +/- symbols. Double-check the location by using landmarks such as roads, rivers or lakes, based on the site’s location in the Google Earth Tour. Once you are in the right place you must manually move the cursor slightly by clicking on an adjacent location to your marker. This action will recalculate elevation correctly (otherwise climate data will be modelled at the elevation in the previous frame, above or below your site!). Click Calculate again. To see the base map better, use the slider at the top of the map to increase transparency of the coloured layers.
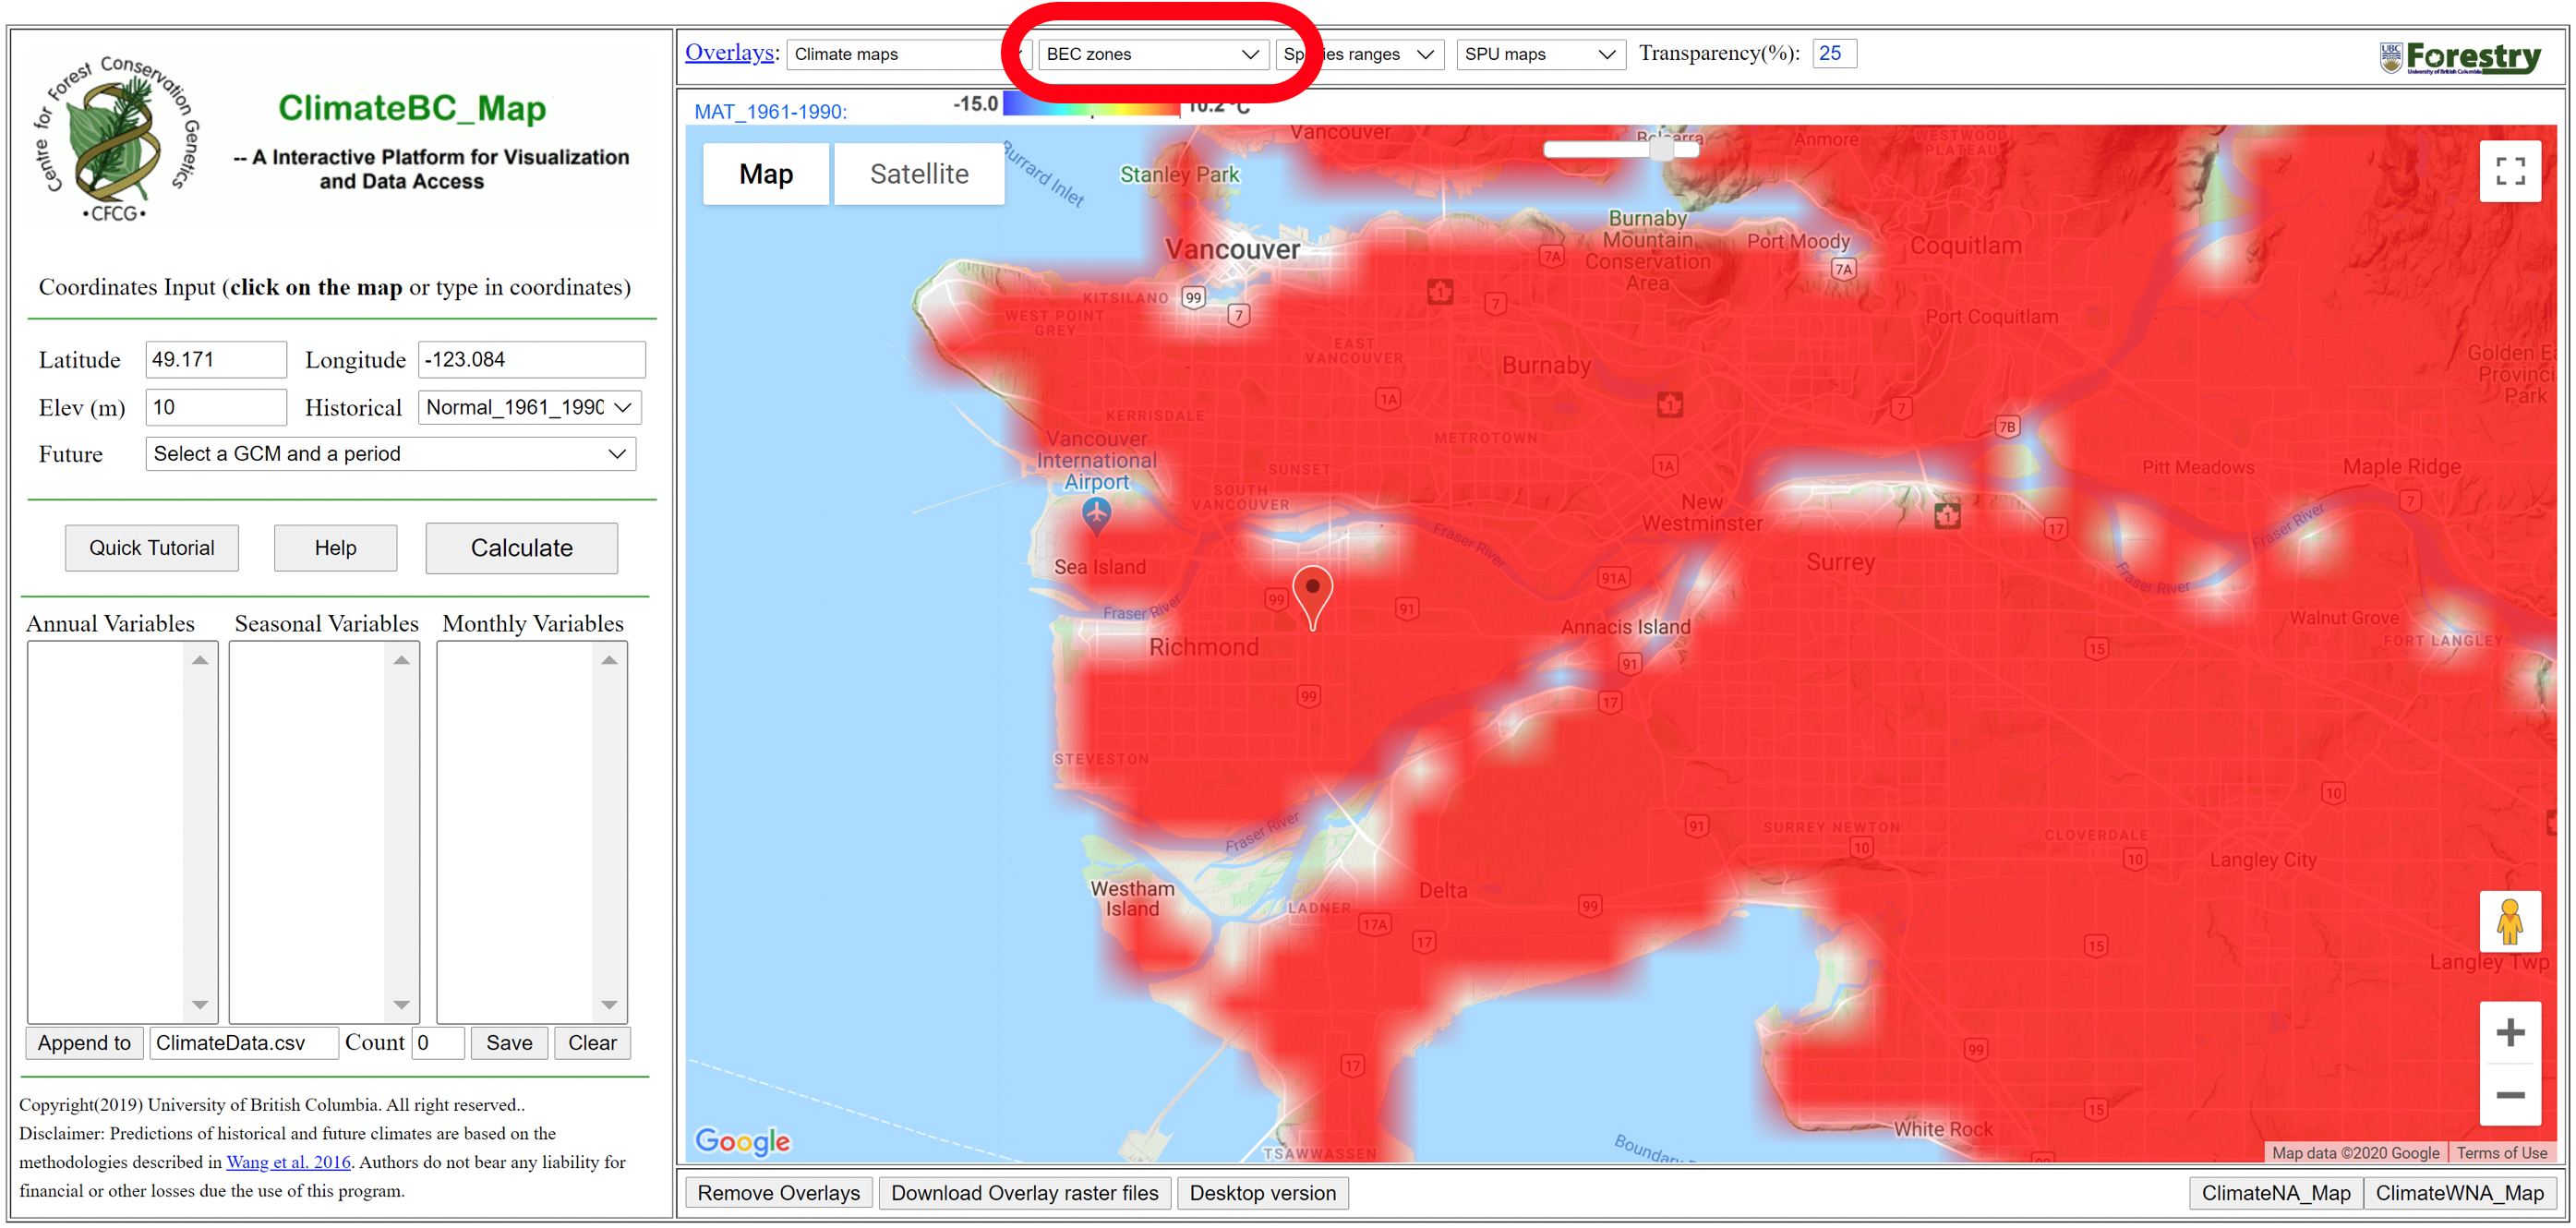
Step 2: At the top of the map, click on the BEC zones overlay button (2nd button from left) and select BEC zones – currently mapped from the drop-down menu (Figure 10.7).
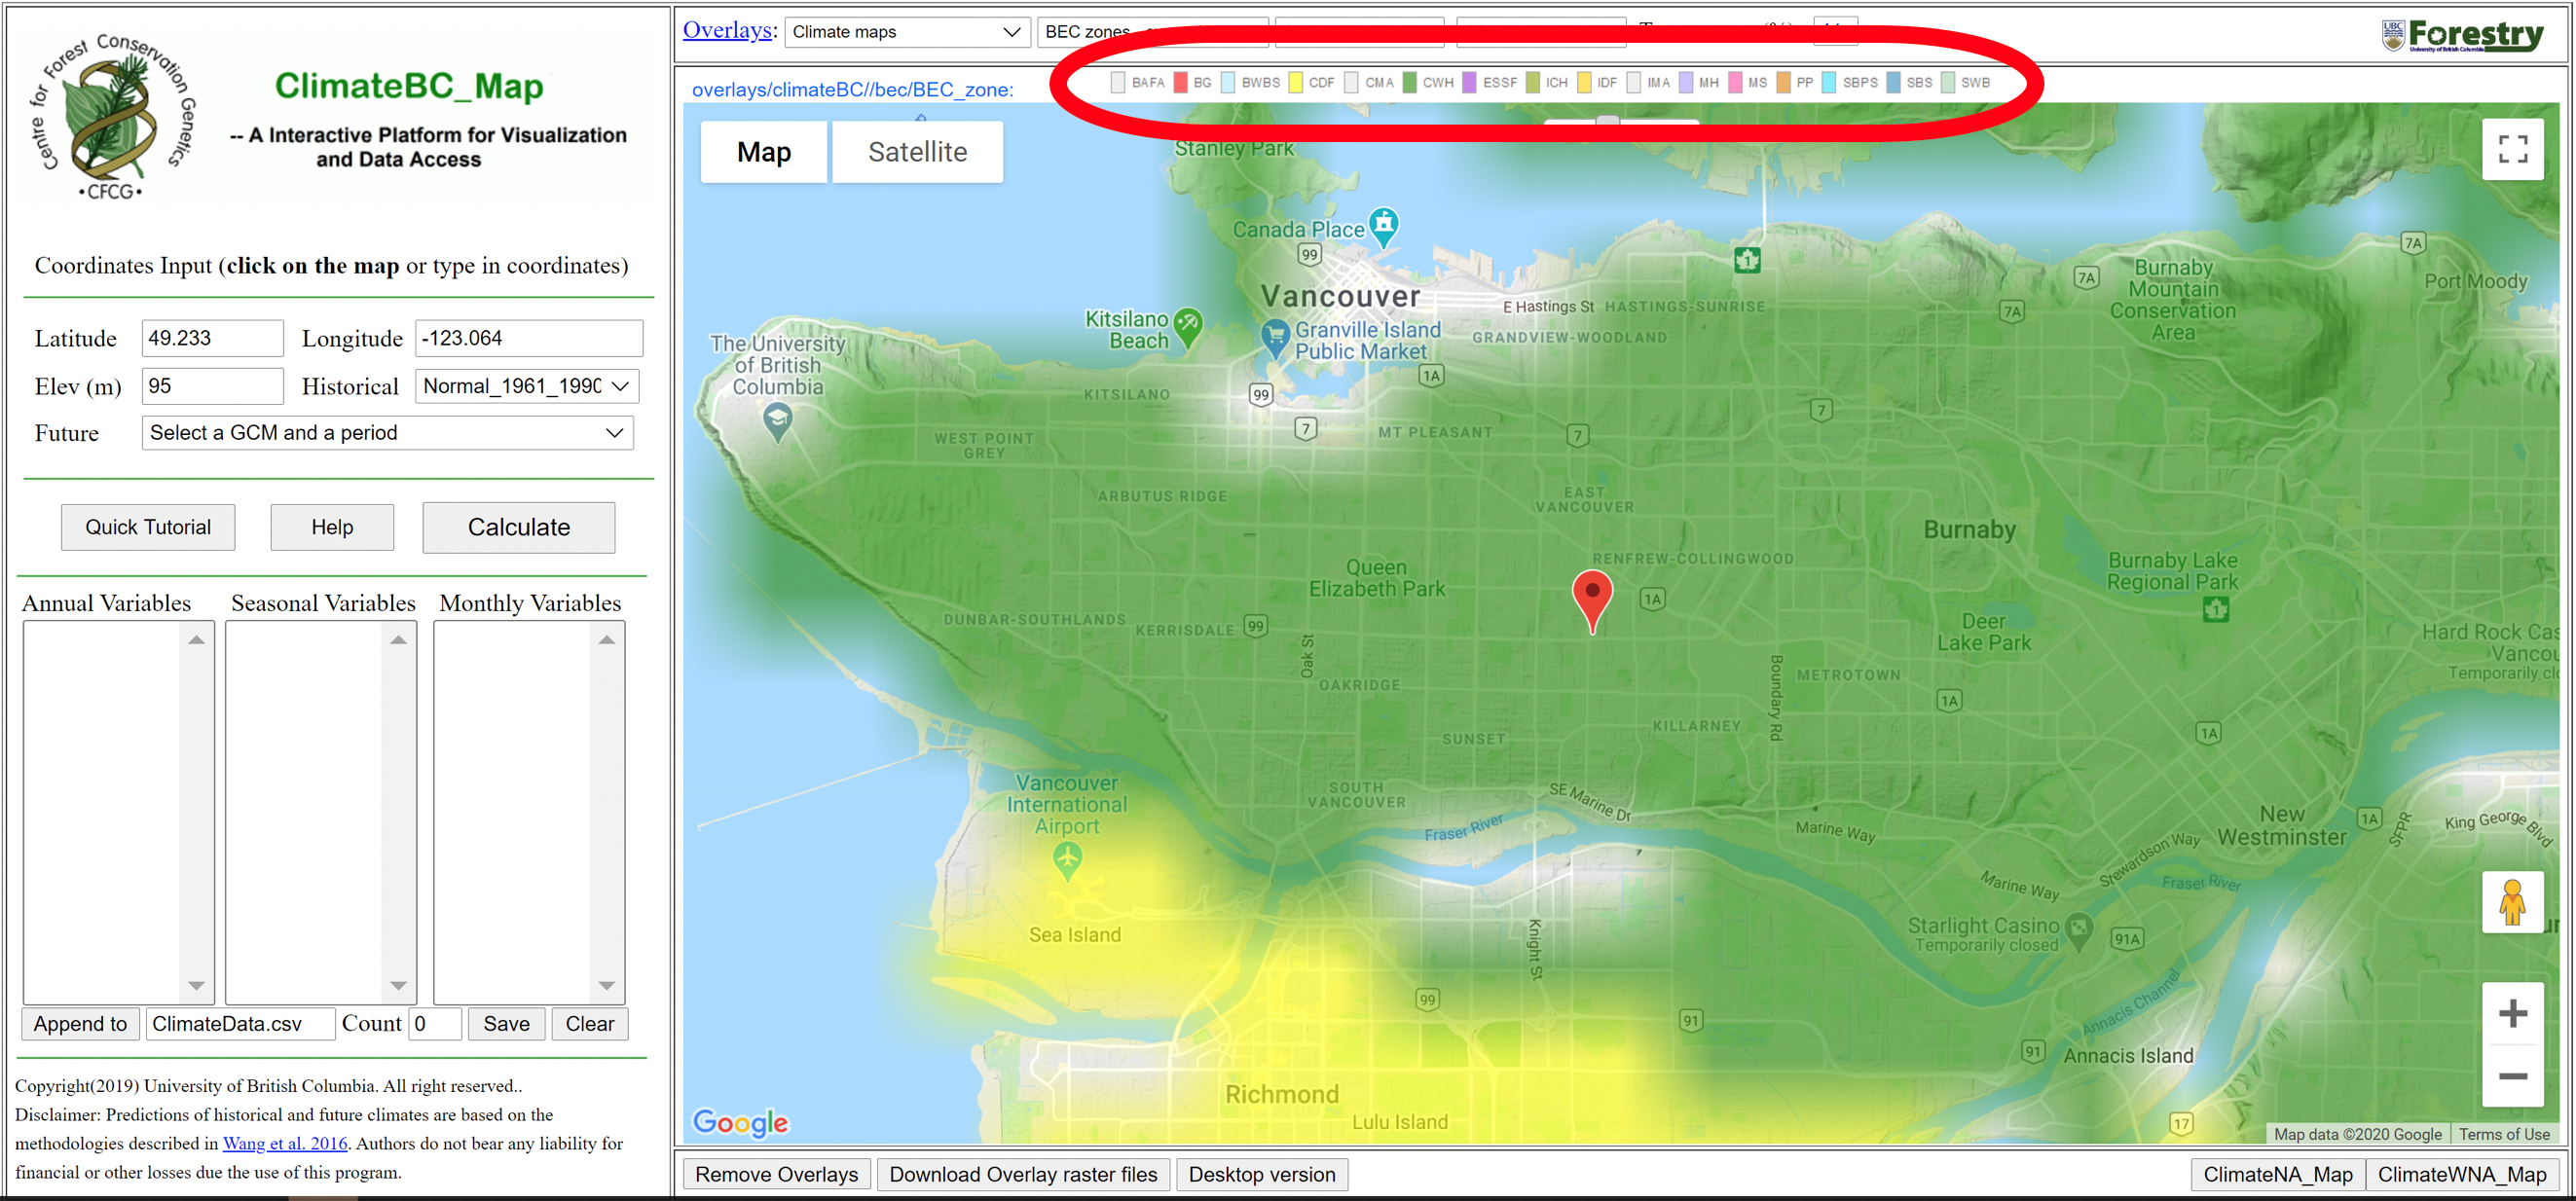
Step 3: Determine each site’s BEC zone using the legend along the top of the map (Figure 10.8) Record the BEC zone abbreviation and full name (you may ignore variant/subzone) in Table 10.3. You can move the transparency slider at the top of the map to intensify the colour of the BEC zone.
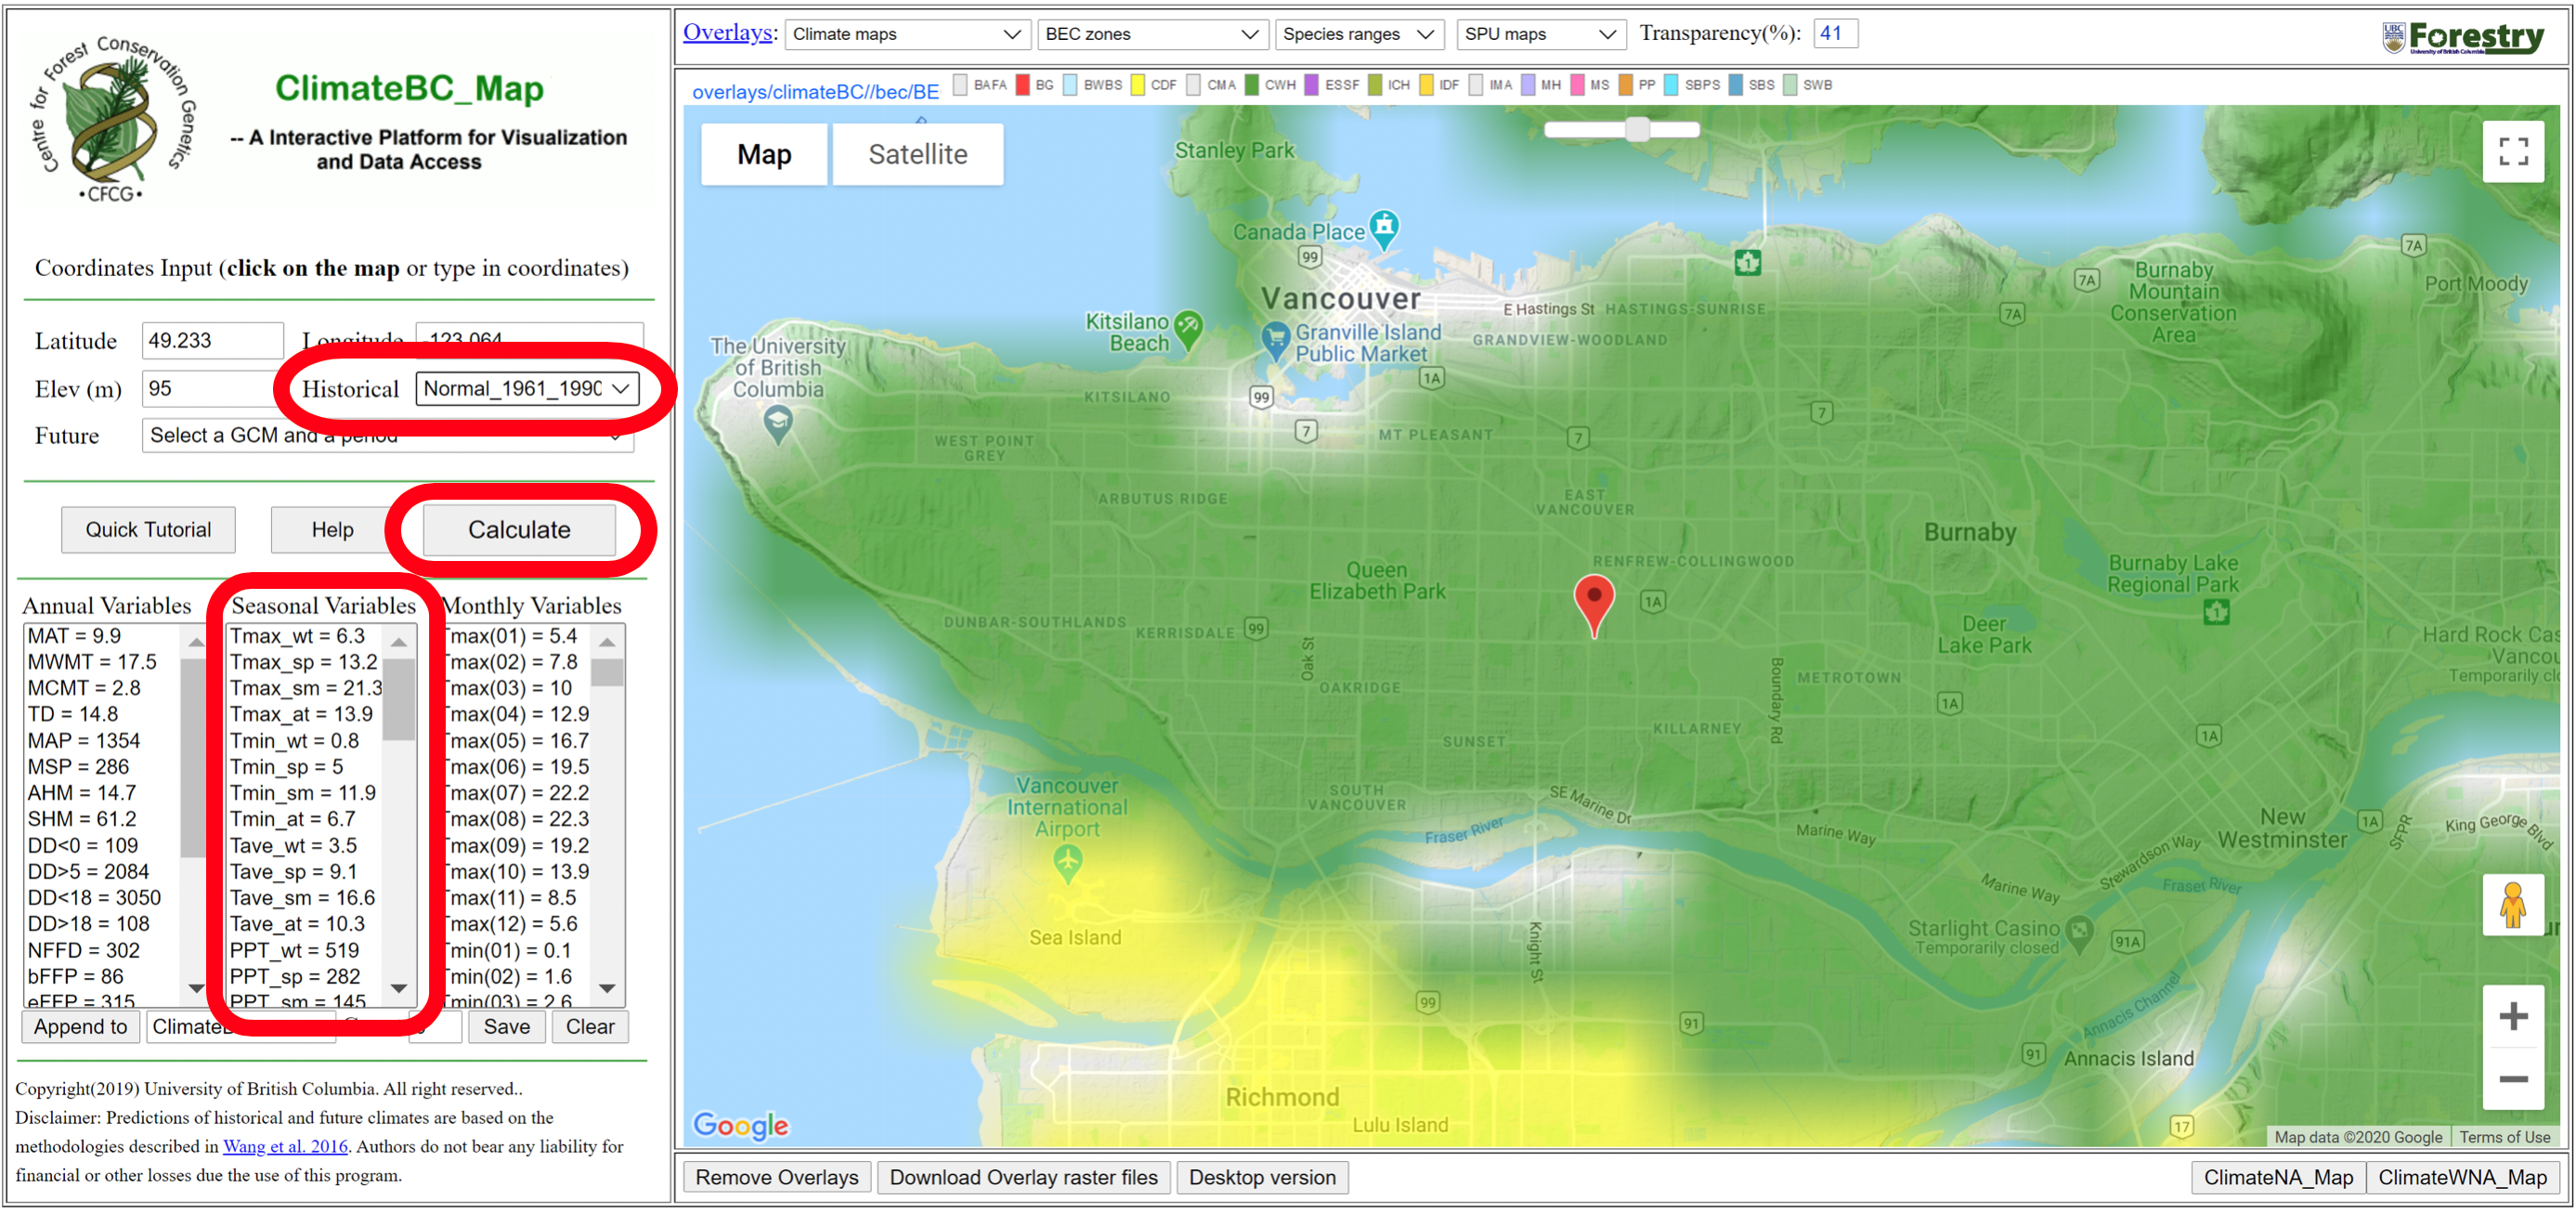
Step 4: Determine the climate variables for each site of interest. Having entered the correct coordinates, manually repositioned the cursor, and re-calculated, check the time period displayed in the Historical box (Figure 10.9). The default is Normal_1961_1990, which is adequate for our purposes. If you choose a more recent period (e.g., Normal 1981-2010; Decade 2001-2010), temperatures will have increased marginally due to anthropogenic climate change. However, soil formation reflects long term averages occurring over hundreds to thousands of years, so we can safely use the default period.
Click Calculate. Important note: you must click Calculate every time you change any settings in the left sidebar or on the map!
Under Seasonal Variables (Figure 10.9), find the following data for your site:
-
- Mean Winter Temperature (Tave_wt=) (shown in degrees Celsius)
- Mean Summer Temperature (Tave_sm=)
- Winter Precipitation (PPT_wt=) (shown in millimetres)
- Summer Precipitation (PPT_sm=).
Enter these data in the blank cells in your Table 10.3.
- In one to two sentences per site, address the following issues for each of the five sites examined:
- The seasonal temperature and precipitation conditions. Rather than repeating the data in Table 10.3, simply indicate which sites are seasonally wettest and driest, warmest and coldest, etc.
- How the local climate relates to the site’s geographic location in terms of distance inland from the coast (i.e., is it coastal or interior) and elevation.
- The types of vegetation (according to BEC zone or information from the Google Earth Tour) at the sites.
- The relationships between BEC zone/vegetation and climatic conditions.
Note: You can determine approximate distance inland from the coast with the measurement tool in the Google Earth (Web) tour. Click the ruler icon on the left sidebar below the Projects button, position your cursor over your starting point (i.e., the coast) and click; then move the cursor inland, due east, to the site of interest and click again to find the straight-line distance between the points.
- Select another location of your own choice in extreme northern BC, above 58 degrees north latitude, by placing your cursor at your chosen spot and clicking to place a marker. Note whether this is a coastal or inland location. Click Calculate to update the climate data. Create a new row in your Table 10.3 and enter the site’s geographic coordinates, BEC zone, and climate data as you did for the other sites. You will come back to this site, so you may want to keep this page open with your marker showing.
Now that we have examined the geography, climate variables, and BEC zones for the sites, we will examine representative soil profiles for each. Because we do not have available soil pits for our five sites, we will substitute equivalent profiles from UBC’s Virtual Soil Monoliths website (Krzic et al., 2010). A representative soil profile for each site has been selected for you from this collection. This exercise should take 45 minutes to complete.
- Table 10.4 records soil profile characteristics of representative soil monoliths for our five sites. Some values have been pre-filled. Supply the missing values following the instructions below.
| Information | Bog soil | Coastal needleleaf forest soil | Subalpine forest soil | Alpine tundra soil | Interior grassland, scrubland soil |
|---|---|---|---|---|---|
| Soil Monolith (label and link) | UBC # 6-01 | UBC # 7-05 | UBC # 1-20 | UBC # 8-02 | UBC # 2-06 |
| Organic/litter layer (depth) | Om (0-13 cm) Oh (13-42 cm) |
– not present | – not indicated | ||
| A horizon (depth) | – not present |
|
Ah (0-5 cm) | ||
| B horizon (depth) | – not present | – not present | |||
| C horizon (depth) | IIC (42-78 cm) | IIC (27-57 cm) IIIC (57-100 cm) |
C (5-59 cm) | ||
| Parent Material | Lacustrine | Colluvium | |||
| Descriptive Notes | Dark A layer from with visibly undecayed litter; Large pore, roots at 40 cm in Bm layer; Sub-rounded stones frequent below 70 cm; Transitions from A to B; B to C clear; A layers are separated by broken transition | ||||
| Soil Order | Organic | Brunisol | Regosol | ||
| Soil Great Group | Humisol | Dystric Brunisol | Regosol |
Step 1: Download the Table 10.4 file to your computer from Worksheets and open it in a word-processing application.
Step 2: Follow the links in Table 10.4 to view the soil monoliths representative of soils at each site. For each monolith, you will find information about the soil including the order, great group, and horizon labels and associated depths for different layers of the soil that were identified by UBC soil scientists. To view 3D models of each monolith, follow the prompt beneath the title To explore a 3D model of this monolith, please click here and explore!
Step 3: Supply the missing information in Table 10.4 for each soil including organic layer label and depth; A, B and C horizon labels and depth, if applicable; parent material type; soil order and great group name. Some information has been pre-filled for you.
Step 4: On the soil monolith pages, click the bottom of the soil and then click again on the figure (+ symbol) to enlarge. Examine the image to expand upon the information about each soil. Look for characteristics such as:
- Obvious visible features such as strong colours (e.g., black indicates presence of organic matter; reddish/orange indicate presence of iron oxides).
- Mottles (visible blotches on the face of the profile – though these are not particularly evident in these dry monoliths).
- Large fragments, stones or boulders, and their frequency and shape.
- Distinctness and form of the lower boundary of each mineral horizon (A, B, if present). Use the terminology and diagrams in the Field Description of Soils that best correspond with what you see in the image (e.g., gradual/abrupt; smooth/wavy).
- Other properties to which you may wish to refer later, such as the thickness of the A or B horizon; lowercase suffix labels indicative of important properties, etc.
Enter your observations in point form in the Descriptive Notes row of Table 10.4 (see the pre-filled cell for an example). Your notes need not be exhaustive, but should simply highlight notable visible features, e.g., general colours, texture, presence of stones/rocks, mottles (choose 2-4 features for each soil).
Note: It is recommended that you take screenshots, or save the monolith photos to your desktop (right click on the enlarged image/press your computer trackpad with two fingers, click Save Image As, and save it to your computer as a .jpg file) to use in EX3.
EX3: Explore Soil Profile Characteristics and Underlying Processes
In this exercise you will apply and extend the knowledge acquired in the preceding exercises to explore soil profile characteristics and underlying processes in different contexts. It should take you 20 minutes to answer these questions.
- Figure 10.10 shows an Organic soil from British Columbia. Possible horizon labels have been indicated, but these are tentative, based on the information provided in the image. Compare this soil with the one listed for Site #1 (horizon layers and its monolith at 6-01 TerricHumisol) and answer the following in 2-3 sentences:
- Comment briefly on similarities (or differences, if present) between the profiles.
- Explain why both these soils have no A or B horizons.
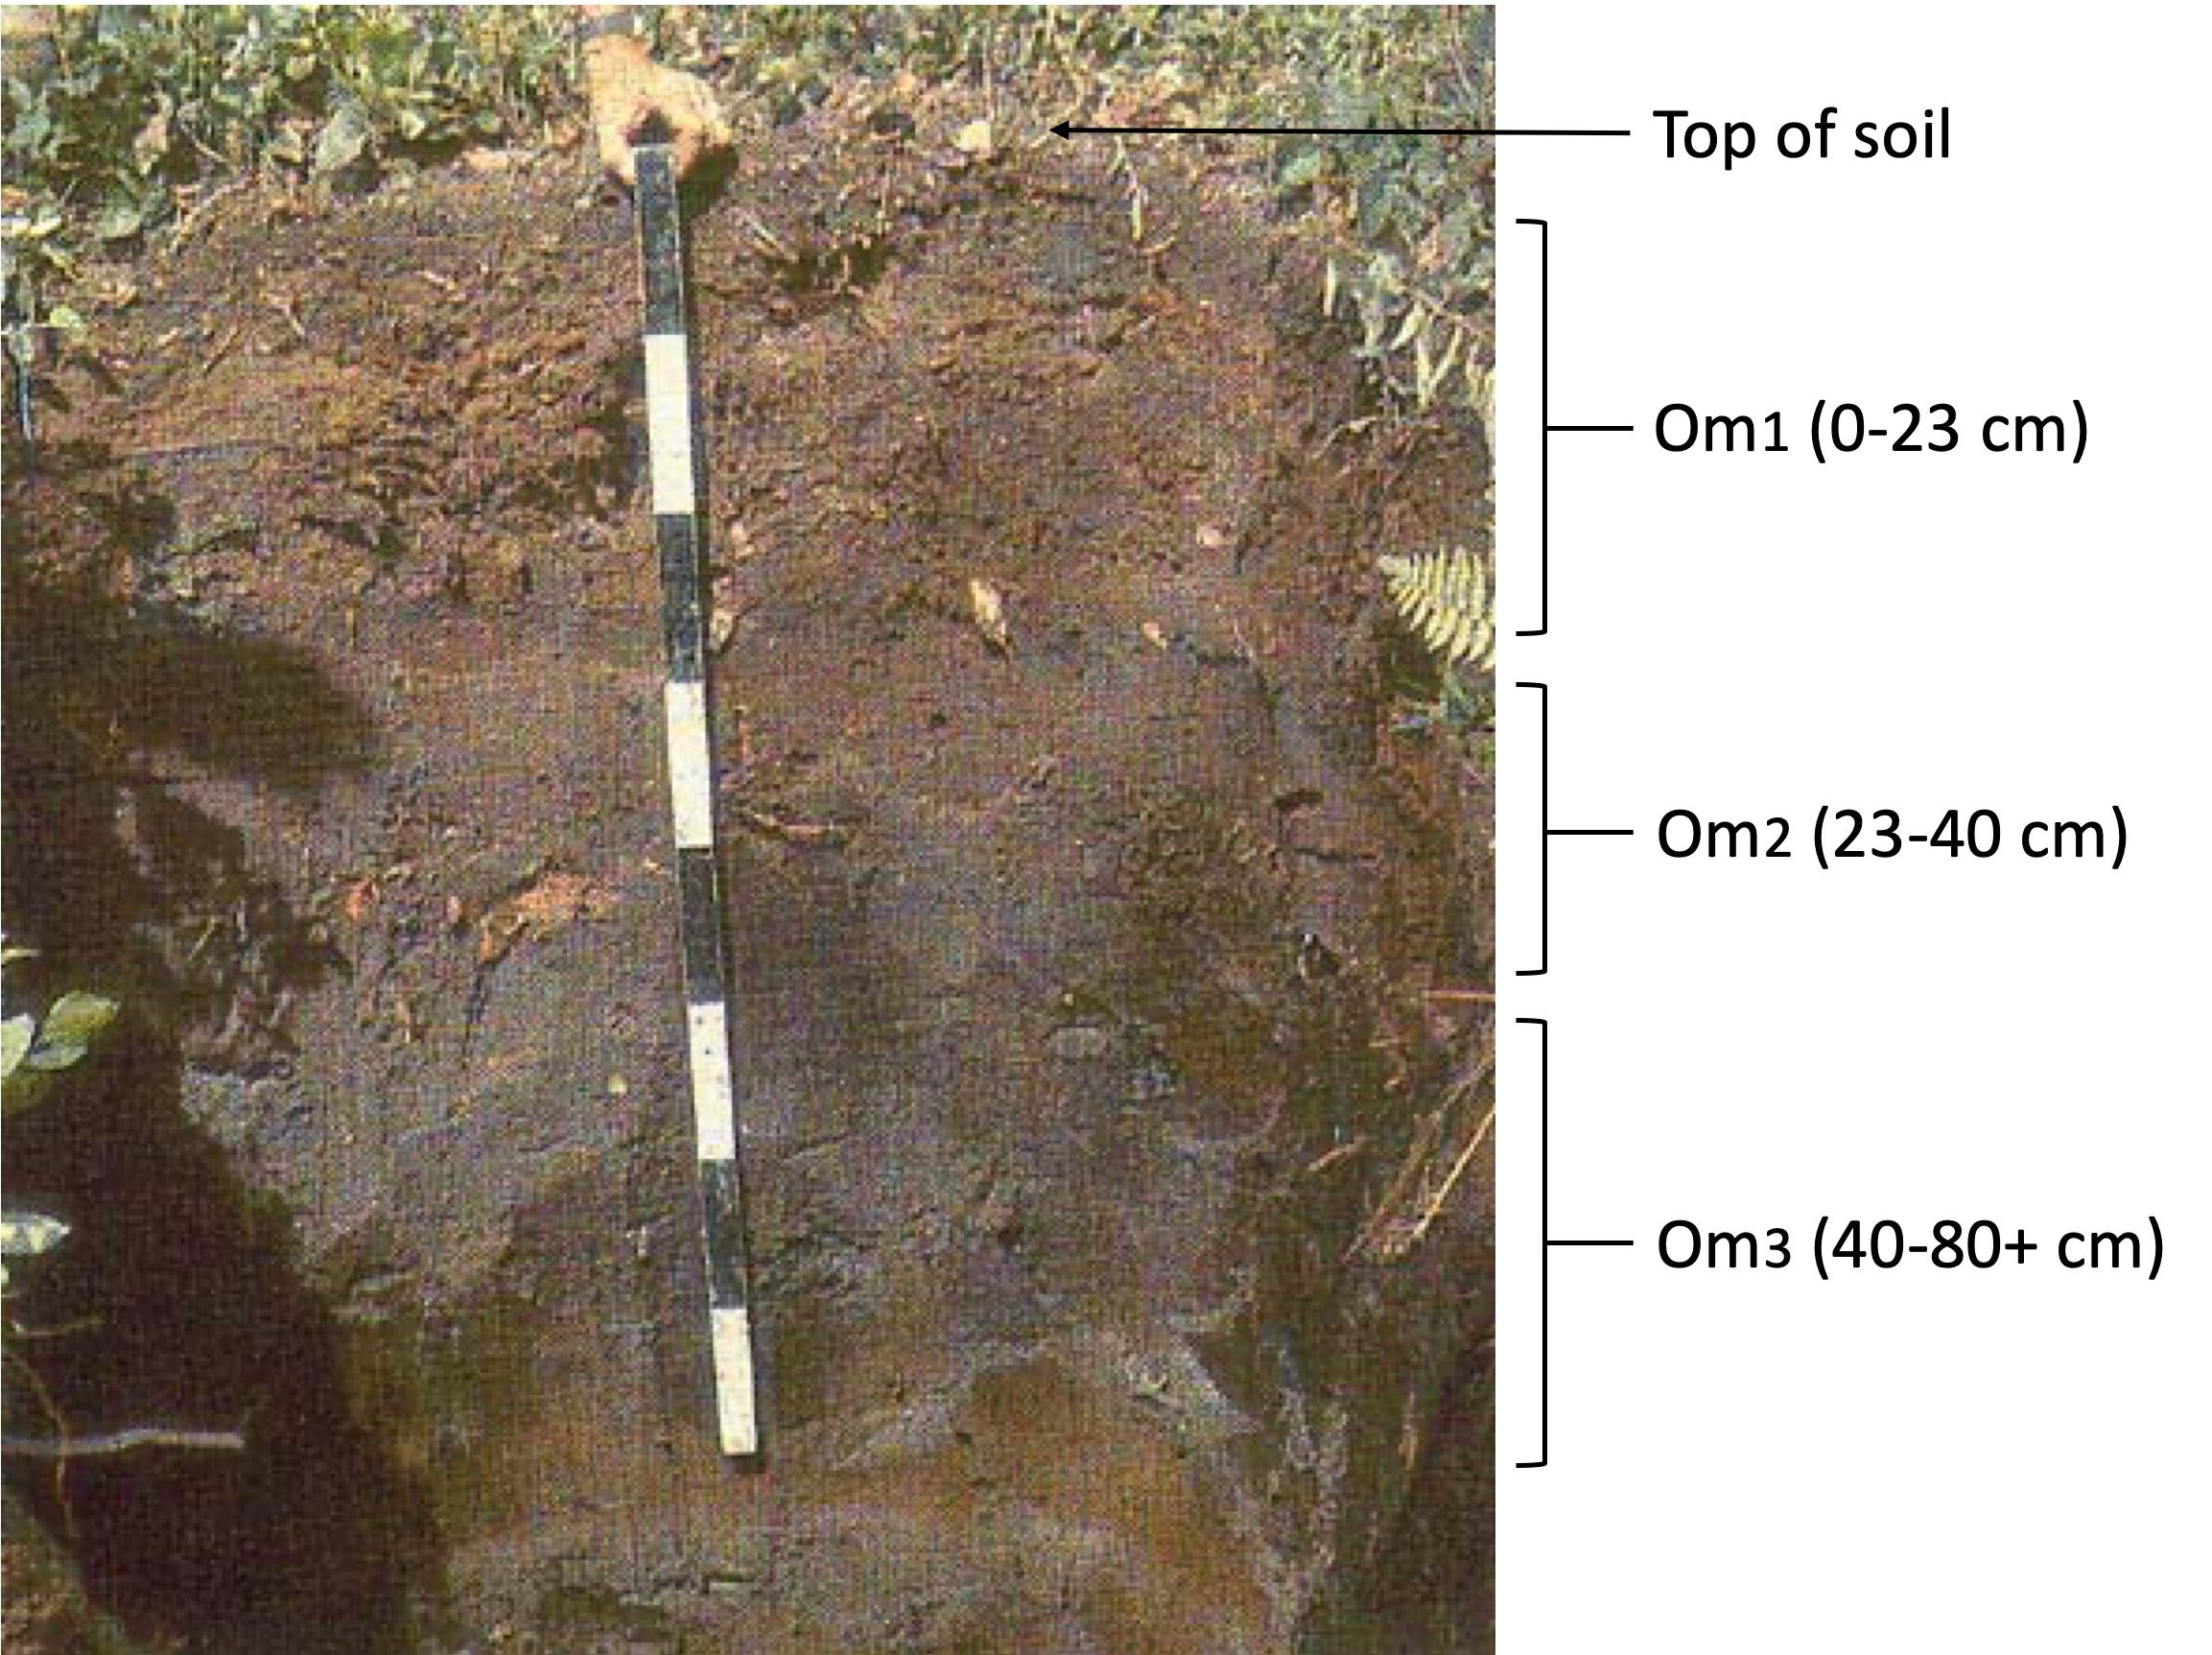
Figure 10.10. Soil pit in an Organic soil from BC (great group: Mesisol). The measuring stick is divided into 10 cm units. Note that the sub-horizon label m has a different meaning when used in combination with the Organic layer than with mineral (A, B or C) horizons, and is short for mesic material. See CSSC, Chap 2, Organic Horizons, Om. Source: Soil Working Group (Government of Canada). Used under Government of Canada terms and conditions. [Image description]
- Figure 10.11 is an image of a podzol from Quebec. Drawing on information learned in lecture, this lab and your text, suggest appropriate names for the following layers, including major horizon and lowercase suffixes, and describe the processes responsible.
- The light-coloured layer at 4-7 cm: . Specific process(es) responsible (1-2 sentences).
- The reddish/orange layer at 10-20 cm: . Specific process(es) responsible (1-2 sentences).
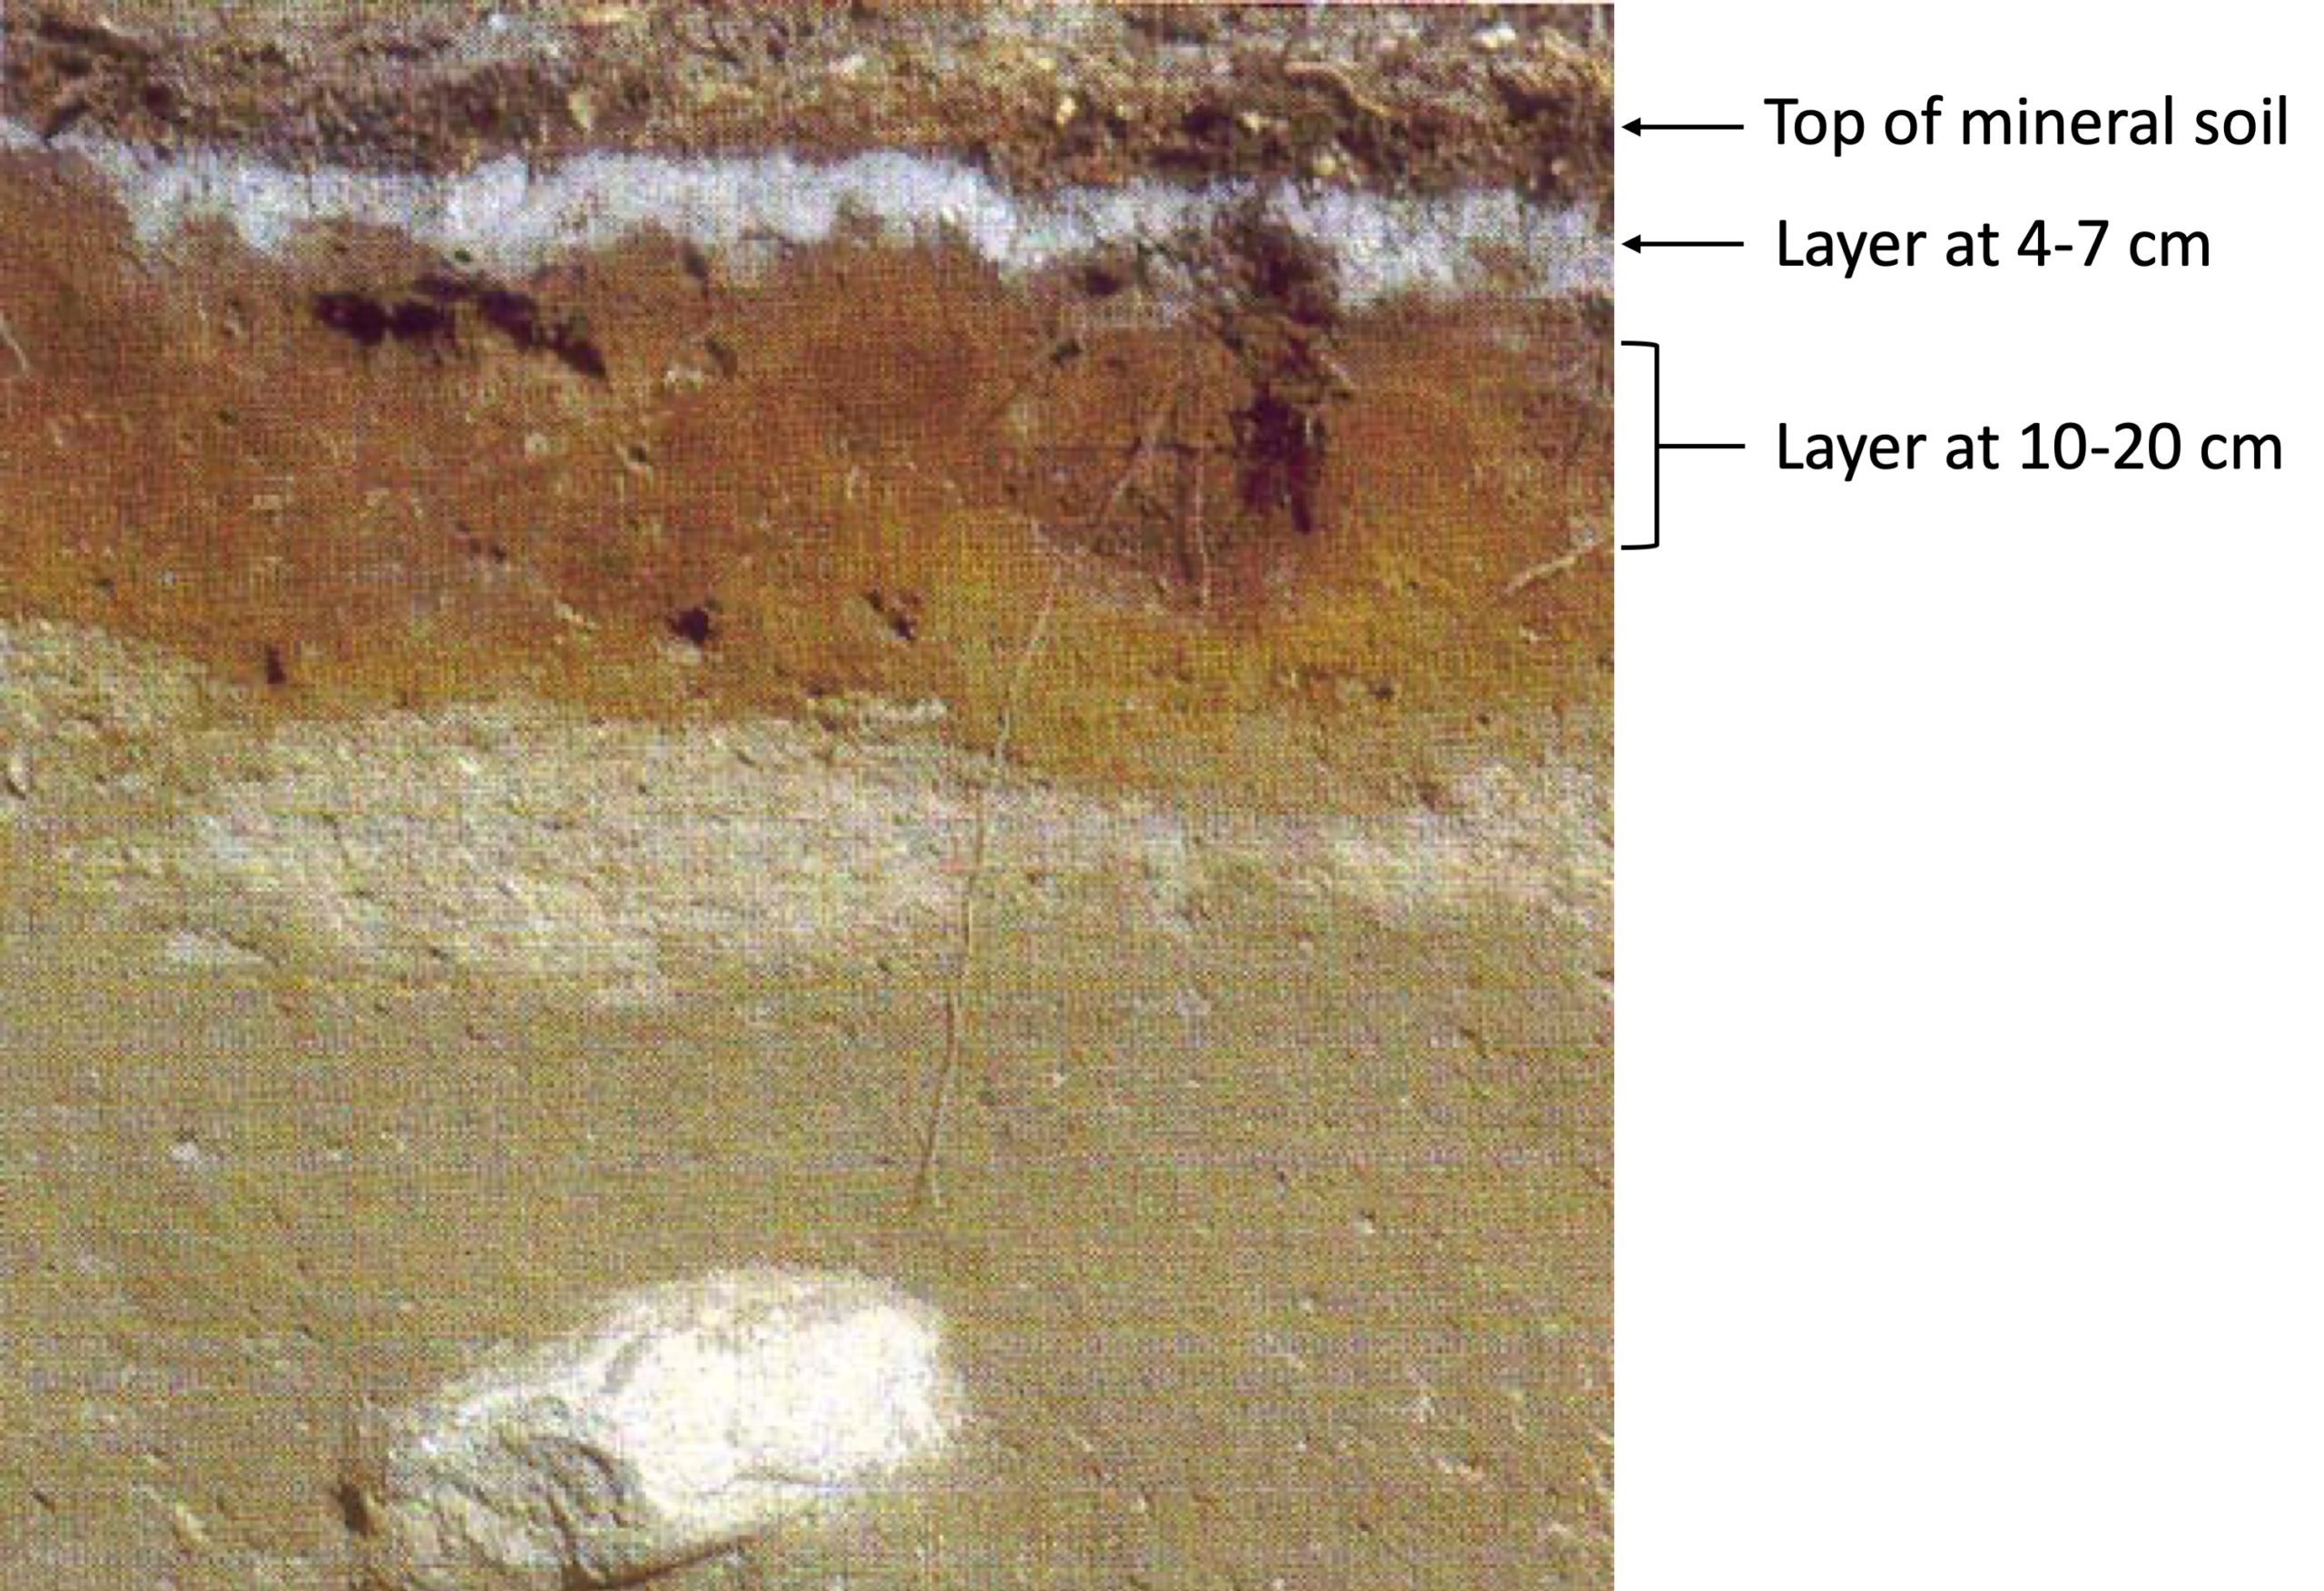
Figure 10.11. Podzolic soil from Quebec on sandy parent materials. Source: Soil Working Group (Government of Canada). Used under Government of Canada terms and conditions. [Image description]
- Explain why you might expect to see evidence of gleying (mottles, blue-grey colours) about 2 feet below the soil surface at Site #2 in Malcolm Knapp UBC Research Forest (1-2 sentences). Hint: Consider the parent materials at this site, as discussed in these videos filmed on site at the Malcolm Knapp Research Forest:
- Podzol on Glacial Till and Outwash Sediments – Youtube video from the Google Earth tour (Video transcript: [Word] [ODT] [PDF]); and
- The Podzolic Order – Youtube video (also in the pre-reading Soli Classification).
- Using their monoliths and your descriptions in Table 10.4, compare the soil profiles at Site #2, Malcolm Knapp forest and Site #3, Subalpine forest in 2-4 sentences. Specifically,
- Note any differences in the A and B horizon properties (thickness, colour, features evident from the sub-horizon labels). You may wish to define the Bm horizon, a diagnostic (distinguishing) horizon in Brunisols such as the Site #3 soil.
- Given that both sites have coniferous vegetation, account for the differences between them.
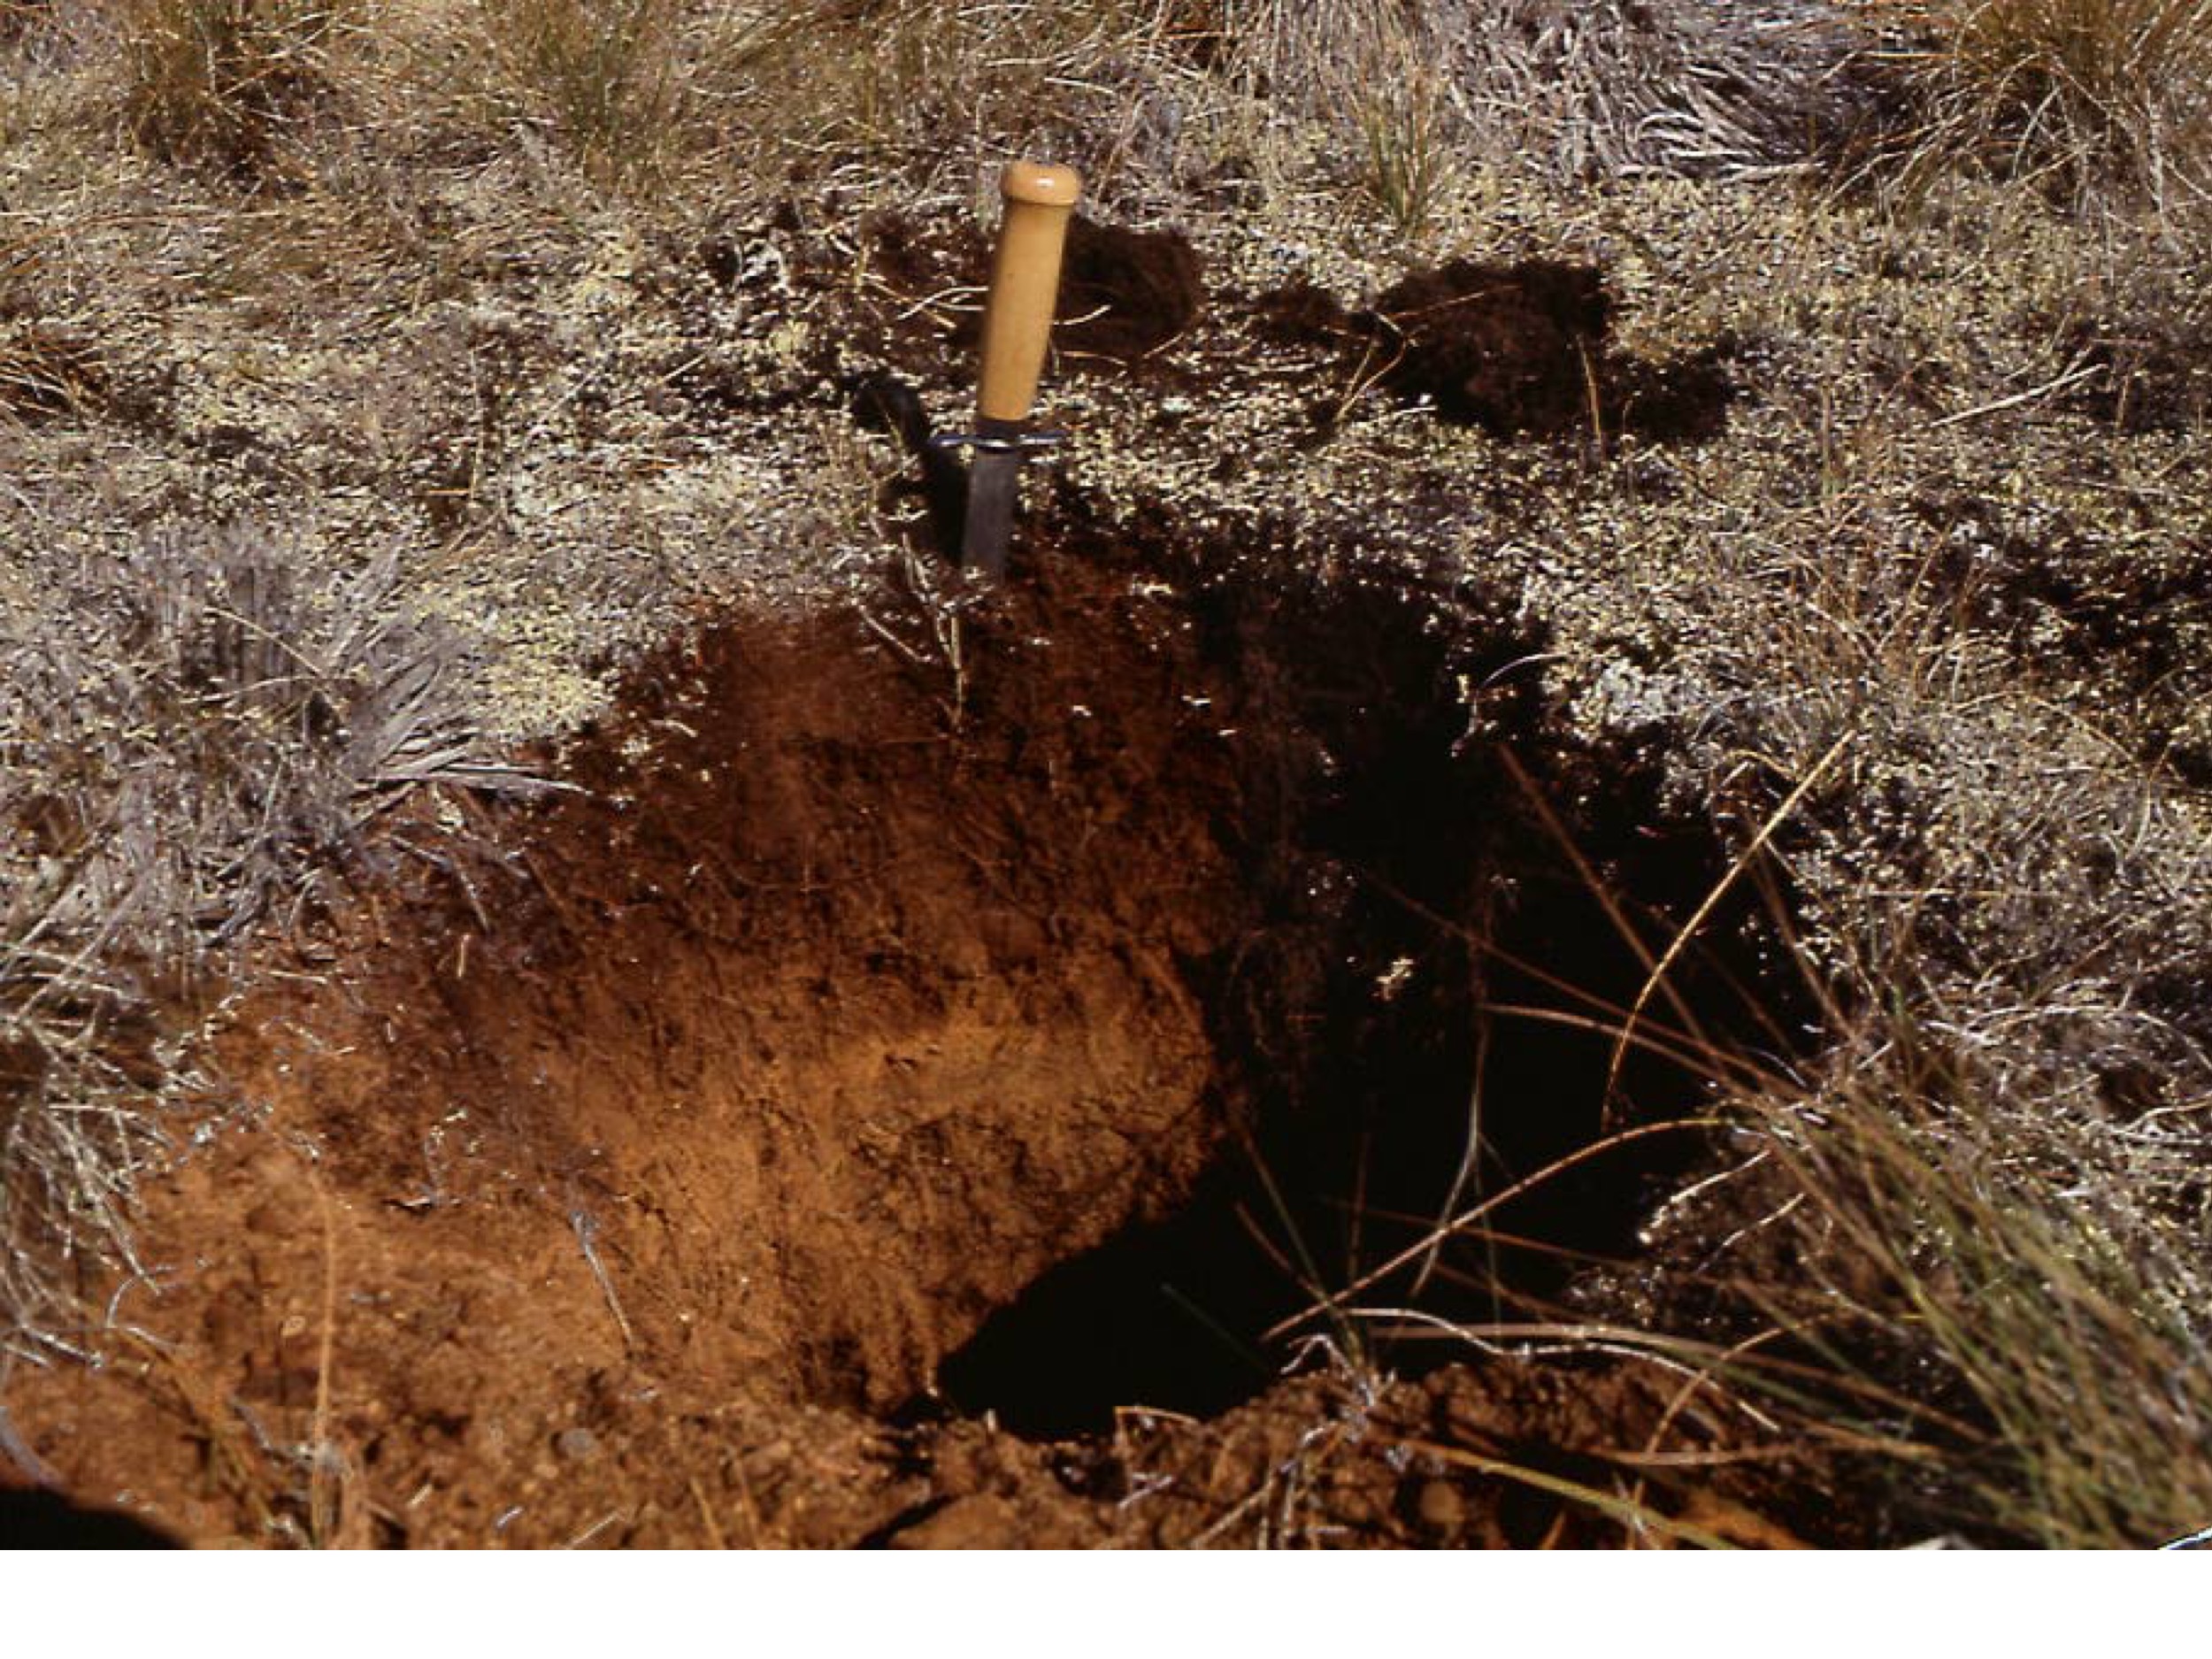
- The Regosol at Site #4 (Alpine tundra) is hardly a soil. Just below, in the valley to the northwest, is a lush meadow (Figure 10.12; and you may wish to view Alpine Meadow ChilMts – Youtube video). This meadow is also located in the alpine zone. A possible alpine meadow soil profile for an alpine meadow is shown in Figure 10.13.
How would you expect the soil in Figure 10.8 to differ from the Regosol at Site #4? Specifically, describe two characteristics that might differ and briefly explain what about the meadow site might account for these differences relative to the scree slope soil (2-3 sentences).
Hint: The information panel in Site #4 of the Google Earth Instructional Tour suggested that you Read more about the soils associated with this BEC zone unit at Selkirk College – BEC System in BC – Alpine Tundra. See the 4th paragraph in the Introduction.
- For the northern BC location you chose in Q4, predict the sort of soil you might expect to find. Pay attention to climate, BEC zone, and soil formation processes. Suggest an appropriate order and indicate why you chose it. Note: It may be a soil order you have not yet described, so use your text or other resources to help you name and describe it.
Describe your findings in one paragraph stating the soil order, the soil’s major characteristics and why you would expect the soil here to fall into this order.
Reflection Questions
- In EX1 we examined the vegetation types at each site and explored how climate parameters were associated with BEC Zone. However, the vegetation at Site #1 (Burns Bog) did not relate clearly to its climate or BEC zone. Briefly explain why this would be, and the implications for the soils found there. (1-2 sentences).
BONUS: At Site #1 (the bog soil) imagine that you dug down to layers deposited 7,000-8,000 years ago and found a mysterious layer of fine mineral material. How might you account for that?
Hint: This layer was deposited on top of the soil; watch the first nine minutes of this video of Kent Watson (Thompson Rivers U) and Dr. Art Bomke (UBC Land and Food Systems) interpreting an organic soil along the Coquihalla Highway just north of Merritt, BC. (1-2 sentences).
- The Podzolic soil order has over 50 different soil monoliths in the UBC Soilweb, more than any other soil order. View this distribution map of the Podzols [JPG] in Canada to appreciate why. Provide two reasons to explain why Podzols are so common in BC (2-3 sentences).
- The BEC zone identified for Site #5 (Similkameen River environs) occurs in close proximity to two contrasting BEC zones. Find these zones by returning to our Site #5 location on the BEC zone map on the ClimateBC_Map website, and do the following:
- Choose and name one of them (just major zone label).
- Suggest the type of soil (by order name) you might expect it to be associated with.
- Indicate how it might differ from the soil at Site #5 (identify one main difference that refers to the characteristics of the soil profile itself, e.g., depth, color of A horizon, presence of particular sub-horizon layers, etc.).
Refer to information in Selkirk College – BEC System in BC – Alpine Tundra and perhaps view sample monoliths of your chosen soil order atUBC Soilweb to assist you.
Worksheets
Lab 10 Table 10.3
Lab 10 Table 10.4
References
Canadian Society of Soil Science. (2020). Soils of Canada. https://soilsofcanada.ca/
Krzic M., R. Strivelli, E. Holmes, and S. Dyanatkar. (2010). Virtual soil monolith collection at UBC. The University of British Columbia, Vancouver. https://monoliths.soilweb.ca/
Selkirk College. (2004). Biogeoclimatic ecosystem classification system in British Columbia. https://selkirk.ca/discover/bec/zones/zones.html
Soil Classification Working Group. (1998). The Canadian system of soil classification, 3rd edition. Government of Canada. http://sis.agr.gc.ca/cansis/taxa/cssc3/index.html
University of British Columbia. (2019). ClimateBC Map. http://www.climatewna.com/ClimateBC_Map.aspx
Image Description
Figure 10.1. Diagram of a soil profile
Figure 10.1 is a schematic diagram showing the approximate positions of the major soil horizons within an example soil. From the ground surface (0 cm) downwards, the soil horizons are:
The O horizon is the very top of the soil and is made up of organic material. The size of the O horizon varies depending on the amount of organic matter present, and is sometimes absent.
The A horizon is the top mineral layer of soil. This layer is often the darkest mineral layer and typically has more plant roots and biological activity. In this example, the A horizon if found directly below the O horizon, to a depth of approximately 15 cm.
The B horizon is the middle mineral layer of soil, and although there are some plant roots and biological activity, there are less minerals present to support this activity. In this example the B horizon is found between the approximate depths of 15 cm and 45 cm.
The C horizon is the bottom mineral layer of soil, and is the parent material which the soil developed from. In this example, the C horizon is found between the approximate depths of 45 cm and 75 cm.
Figure 10.10 Soil pit in an Organic soil from BC
A photograph of an organic mesisol soil pit from BC. It has three organic layers, Om1, Om2, and Om3. The lowercase m denotes “mesic material”, meaning that these are organic layers with mesic materials. In this photograph… Om1 is from 0 to 23 cm in depth, and is a lighter brown colour. Om2 is from 23 to 40 cm in depth, and is a darker brown colour. Om3 is from 40 to 80+ cm in depth, is a darker brown colour, and appears to be more saturated with water.
Figure 10.11 Podzolic soil from Quebec on sandy parent materials
A photograph of a podzol soil pit from Quebec. It has three layers on top of a sandy parent material. The top of the mineral soil has an approximate depth of 4 cm, is brown in colour, and has visible plant roots. The second layer is from the approximate depth of 4 to 7 cm and is white. The third layer is from 10 to 20 cm in depth and is a pale brown colour. Below the third layer, is the sandy parent material.

![distribution map of the Podzols [JPG]](https://soilsofcanada.ca/images/podzolic_map.jpg#View%20map)