Worksheet 2a.
These guided exercises will give you the opportunity to practice the techniques and apply the concepts you learned in Chapter 2a. You will need some paper, spreadsheet, or a tablet to work on the analyses.
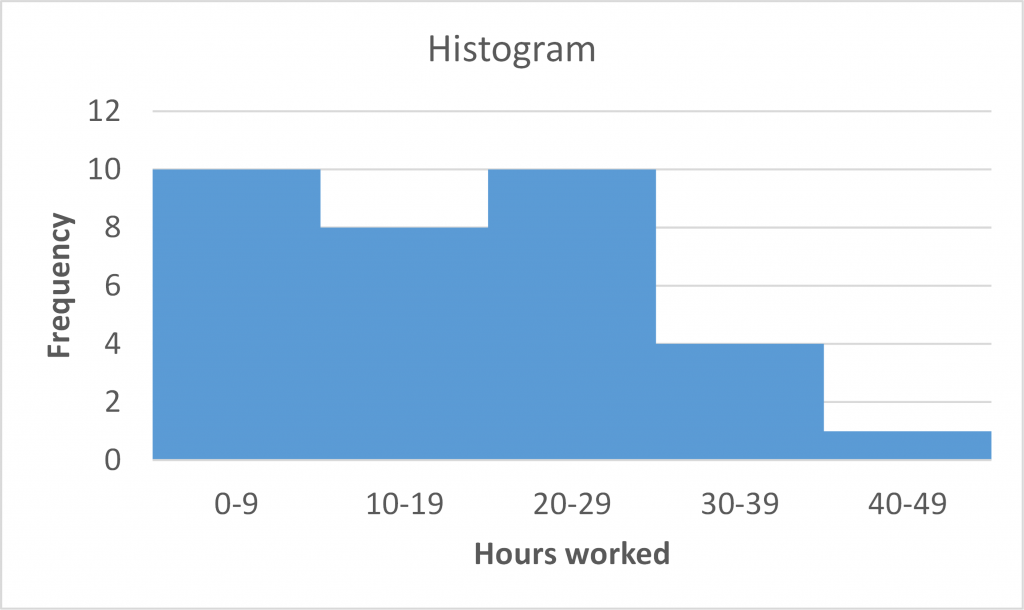
- If we surveyed students in the class regarding the number of hours they typically work in a week to generate a dataset, let’s say we found that students reported the following number of work hours:
0, 0, 0, 0, 0, 0, 6, 8, 8, 8, 10, 12, 12, 14, 15, 15, 18, 20, 20, 20, 20, 22, 24, 24, 24, 25, 25, 30, 35, 36, 38, 40

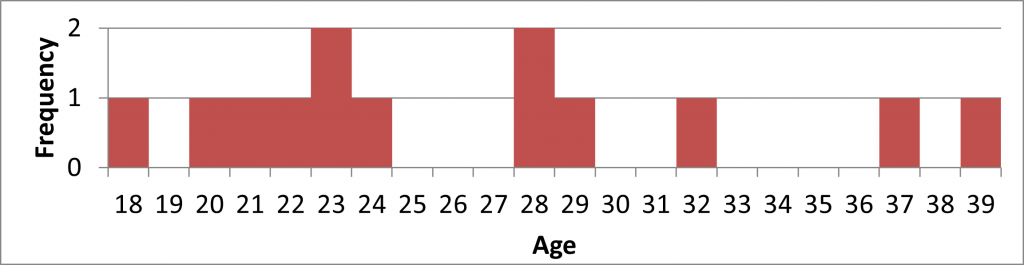
- Data collected from hospital records reveal that the age of first hospitalization for psychosis for a sample of patients are:
18, 20, 21, 22, 23, 23, 24, 28, 28, 29, 32, 37, 39
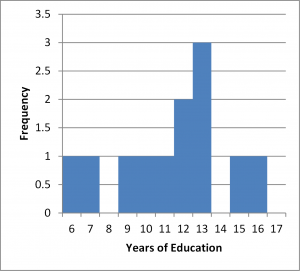
- The number of years of education for most members of the sample in the study psychosis onset were:
6, 7, 9, 10, 11, 12, 12, 13, 13, 13, 15, 16
a. Find the mean and median for this dataset.
b. Why do the mean and median differ?
(HINT: Use a histogram to help you discern the shape of the distribution and how it might influence these measures).