Example of a Complex Correlation
When you encounter a correlation problem you typically start at the bottom of the columns and move upwards, following the changes over time. In Figure 4.8 notice the nonconformity between metamorphosed rocks at the bottom of both logs and the distinctive burrowed sandstone above. Both the metamorphic rocks and the sandstone have distinctive lithologies and a similar contact so a solid correlation line could be drawn between them as we are quite certain about their match. However, a change from metamorphic rocks to sedimentary rocks indicates a significant period of uplift and erosion. This represents a nonconformity, and a heavy dash-dot line has been used to indicate this.
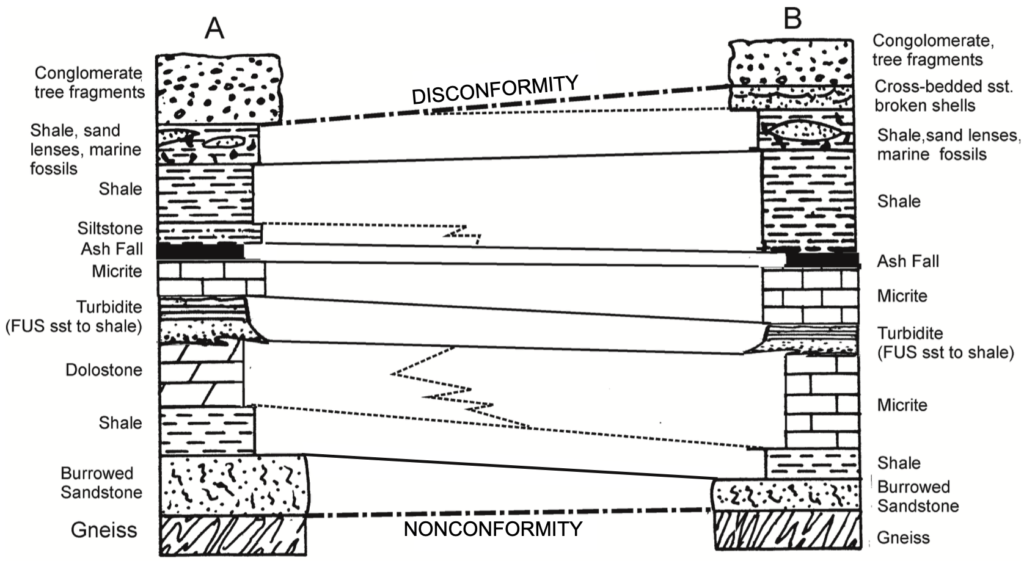
The first shale unit above the burrowed sandstone is not lithologically distinctive so this correlation line is marked as tentative using a dashed line. Above the shale is dolostone in column A, and micrite (a fine grained limestone) in column B. At first, it is not clear what to do with these two beds, and so we will carry on looking further up in the columns for further clues.
Above both is a distinctive graded bed from a turbidite deposit. This unit has a coarse sandstone base that eroded into the underlying carbonate. It then fines upwards to silts and is overlain by micrite. The turbidite layer is a marker bed because it is quite lithologically distinct, and solid lines connect column A and column B at both its lower and upper contacts. The dolostone at A and limestone at B are thus correlated, despite being lithologically distinct. The change from dolostone at A to micrite (limestone) at B may represent a lateral facies change, and so a dashed line is used to indicate that the dolostone extends to somewhere in between the two boreholes. We are not sure exactly where, so it has been drawn approximately half way between the two observed locations. The dolostone is an example of a bed that has graded laterally into another bed (micrite) and thus a different depositional environment.
On top of the turbidite is more micrite and atop this is an ash fall deposit, which acts as another marker bed. This is followed by slightly different stratigraphy in columns A and B. The siltstone on top of the ash in A is not observed in B, which implies that it likely pinches out laterally. This is shown as a dashed, jagged vertical line about halfway between the stratigraphic logs. The next shale bed is again perhaps hard to correlate between A and B, but the shale unit above is distinct by its sand lenses and fossil content and hence another solid line is used at the contact between the shale and the shale with fossils.
Location B contains one more unit of sand before there is a contact with a conglomerate. This contact appears to be erosional. This could be just local erosion, like the erosion that occurs within the channel of a meandering river that wanders back and forth, or it could be more regional in scale and indicative of a disconformity. A disconformity indicates a significant period of time is missing from the sedimentary record due to erosion.
Several things give us clues as to what occurred. The micrite indicates a marine environment, and the transition from micrite, to shale, to sandstone seems to be following a regressive sequence where water depth is decreasing. There is a dramatic change in facies between a shale with marine fossils and a conglomerate with terrestrial fossils; several facies that we might expect in a long transport system are missing between these deposits (delta or tidal zone, meandering river, braided river etc).
This could be a disconformity, but another possible explanation is that this might be a short transport system, where a conglomerate deposited by an alluvial fan could come right down on the beach (think about the BC coast). In order to figure this out, the shells in the sandstone were examined and determined to be from the Paleocene epoch. The tree fragments in the conglomerate were examined and determined to be from the Oligocene epoch. The Eocene epoch (34 my to 23 my) is therefore missing from the stratigraphic record, confirming that this is a disconformity. An unknown thickness of sediments that used to be above the shale with fossils at A and above the fossiliferous sandstone at B, has been eroded away. A heavy dash dot correlation line is used to match the disconformities in A and B.
Below the disconformity the fossiliferous sandstone in B is not found in A. There are two possible explanations for this. It may be that the degree of erosion at A was greater and the the sandstone layer was removed. It could also be that the sand was never present at A, and it pinched out between the two. Regardless of the cause, the fossiliferous sandstone unit is shown to pinch out in our cross section.
Overall Interpretation
This would be considered a good correlation between locations because our confidence in matching the unconformities. In the lower portion of the cross-section, location A has a higher overall percentage of clastic sediment with thicker units than location B, indicating that the sourceland is likely to the west (left) of unit A.
Above the nonconformity is a fining upward sequence from sandstone to shale to dolostone, indicating a trend toward deepening water over time. The turbidites represent collapsing density flows on the edges of a continental shelf.
Above the turbidites the sequence reverses, transitioning from micrite to shale to sandstone, implying that the water depth decreased. There was then a period of erosion in which the upper deposits of the regression were eroded. Finally the conglomerate was deposited.