Exercise 3.3. Interpreting Stratigraphic Logs
What To Do
Find Exercises 3.3 in the worksheets and collect your work from Lab 2 for reference. You can access Tables 2.4 – 2.6 by clicking here.
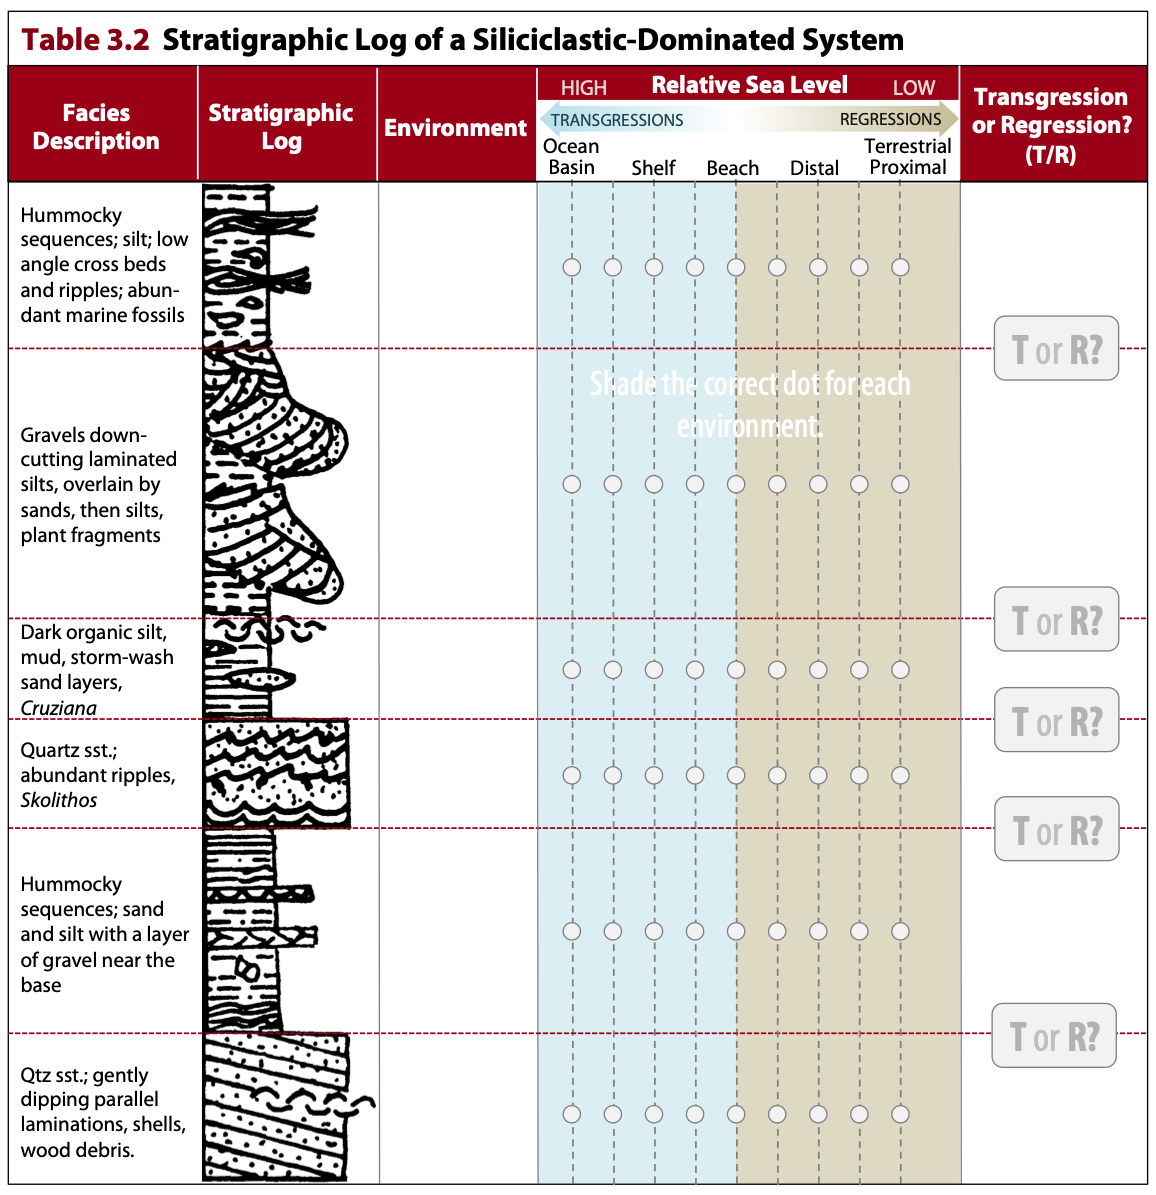
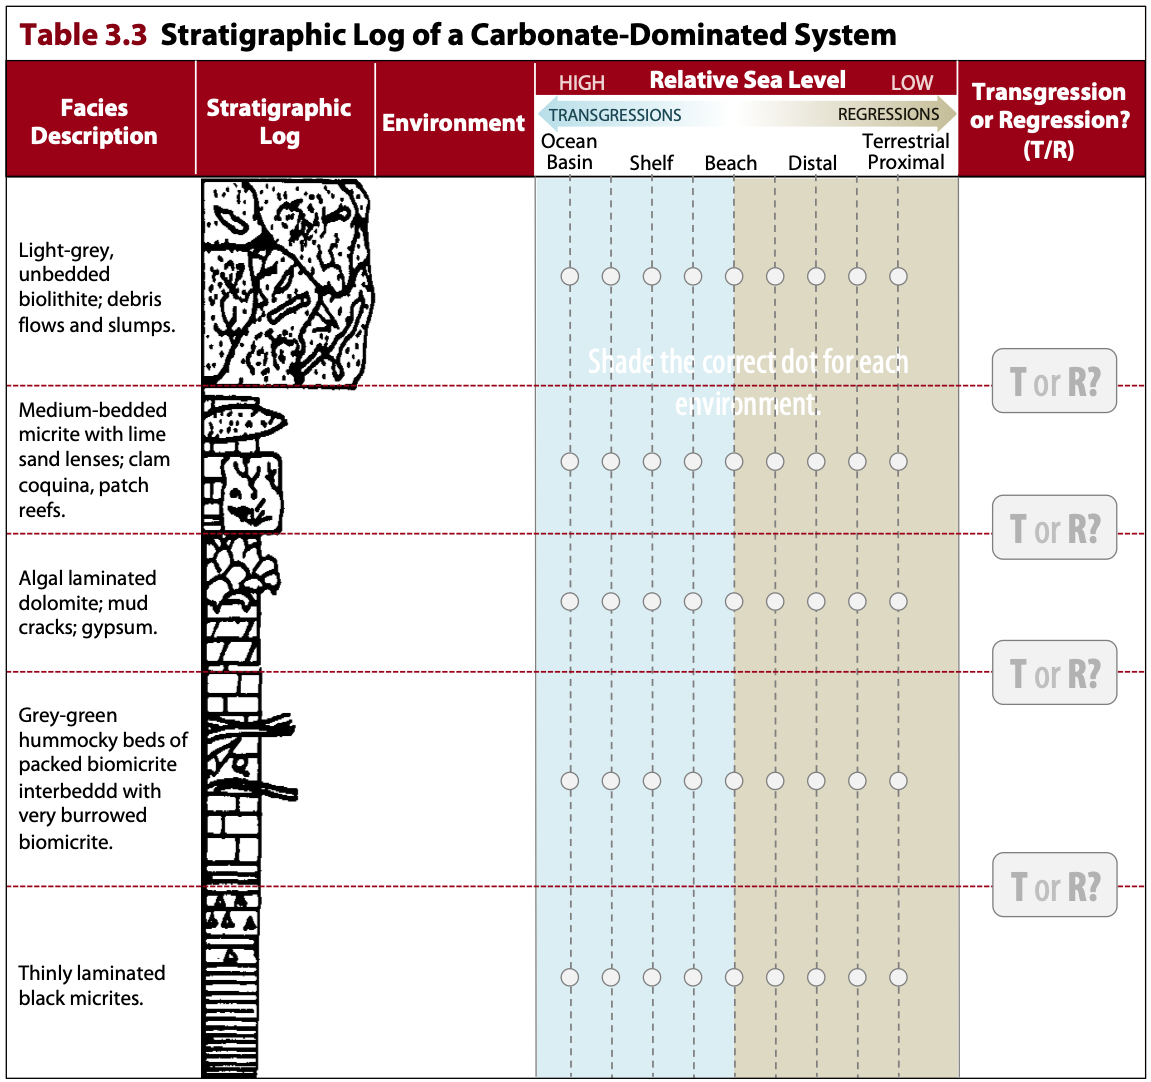
Tables 3.2 and 3.3 summarize stratigraphic logs from two different locations. Use the following instructions to interpret and complete each log. Note: simplified versions of Tables 3.2 and 3.3 are available in the Lab 3 worksheets.
1. Identify the depositional environment by interpreting the written facies description and drawn stratigraphic column using the information from Lab 2. Write the name of the environment next to the log sketch.
2. Starting at the bottom of the log, decide whether the transition from one facies to the facies above it represents a change to a deeper water facies (transgression) or a shallower water facies (regression). Write the corresponding change (T or R) in the box on the horizontal line separating the two facies.
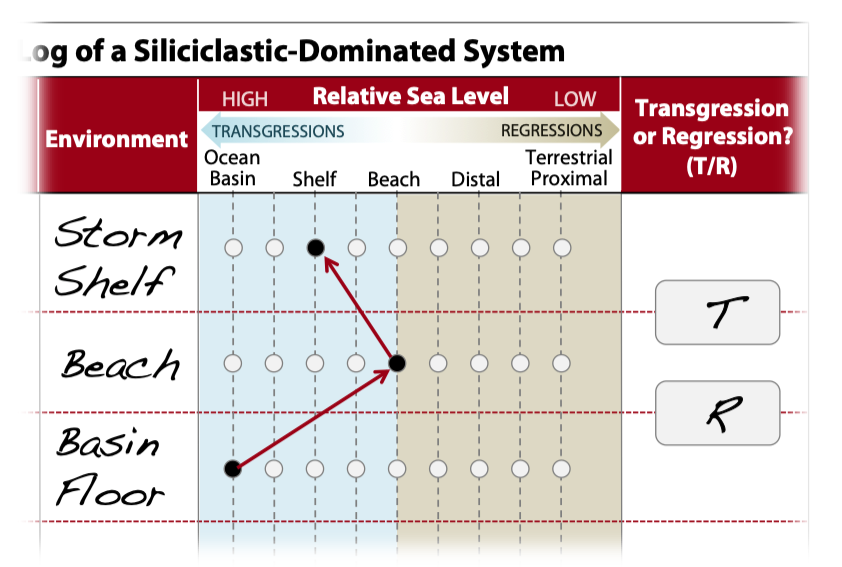
3. In the right-hand column, plot the facies according its location by shading the correct dot. For example, if an environment is a beach, shade the dot under “Beach.” There are also dots for intermediate environments. If an environment has deeper water than “Beach,” but shallower than “Shelf,” you would shade the dot between those two environments. Remember that the progression from fine far-offshore sediments to coarse coastal sediments may not be smooth. Once you’ve shaded the correct dots, connect the dots using straight lines to create a sea level curve like the one shown in Figure 3.9.
4. Indicate periods of transgression or regression by placing arrows on the straight lines pointing left (transgression) or right (regression). Figure 3.10 shows part of a made-up example to illustrate the procedure for steps 3 and 4.