Exercise 4.3. Advanced Correlation Exercise
What To Do
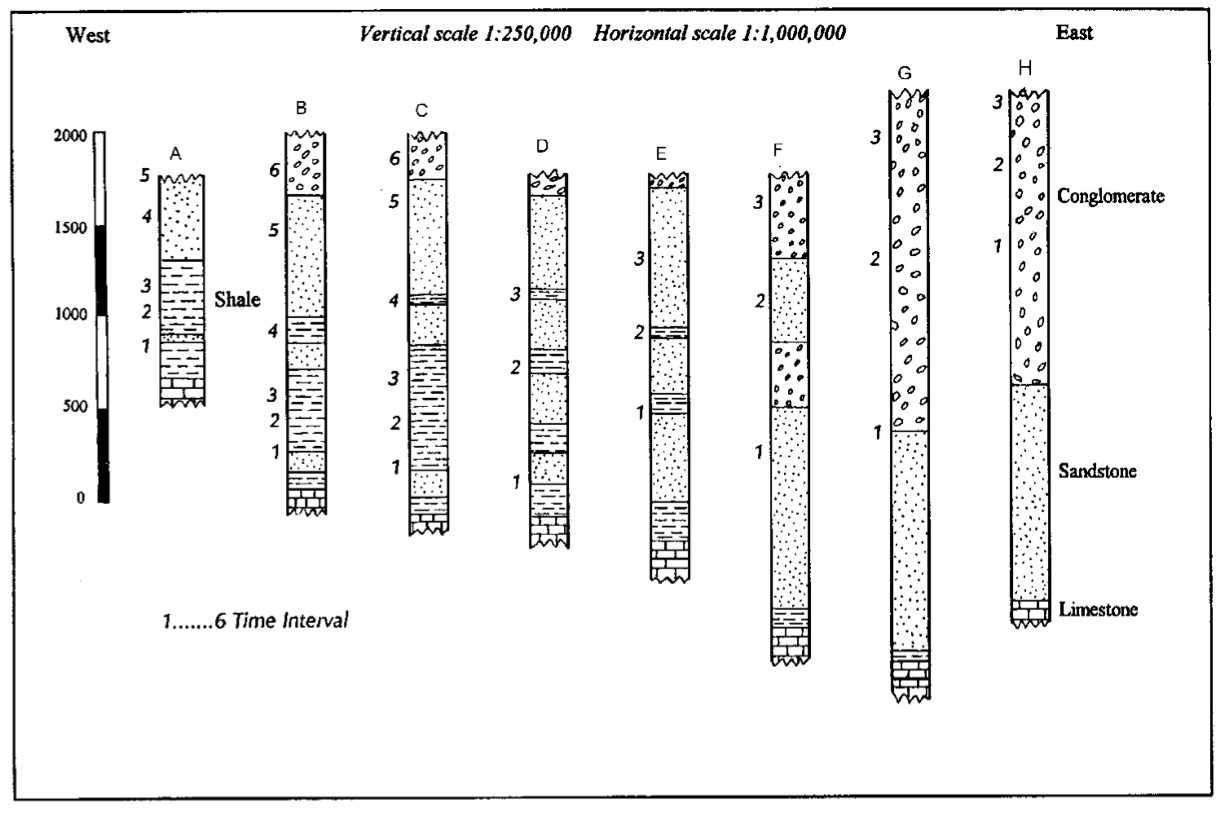
1. Refer to the printer-friendly worksheets you downloaded (available at the beginning of Lab 4). You can also click here to download Figure 4.11 as a PNG file for editing with drawing software.
2. Draw lithologic correlation lines to connect equivalent rock units (shown using Roman numerals) in Figure 4.11.
3. Using a different colour, draw lines connecting equivalent time-stratigraphic units. The numbers beside the rock units correspond to time intervals.
4. Answer the questions that follow Figure 4.11.
Questions
a. Not all the conglomerates are the same age. How could this occur?
b. In what direction is the sourceland for the lower sandstone layer?
c. What happens to the thickness of the shale layer from east to west? Considering your answer from (b) above, how do you explain this?
d. Why is stratigraphic log A thinner than log G even though it represents a longer stratigraphic time interval?
e. In log A, between which two time periods was the rate of sedimentation the greatest?
f. In which log (A-H) was the rate of sedimentation the greatest?
g. What is happening to water depth from time interval 1 to 6?
h. What geologic processes or events do you think may have created the sedimentary patterns seen in this cross section?