4 Input-Output Diagrams
Learning Objectives
By the end of this section, you should be able to:
Create input-output diagrams
Input-Output Diagrams
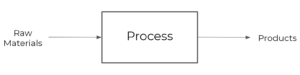
These diagrams are considered to be the simplest of process flow sheets. In input-output diagrams, the entire process is represented by 1 block only. They usually only reference the main process streams in and out of a process.
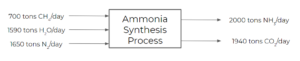
Example: Ammonia Production Input-output Diagram
Consider an ammonia production process where 3 main streams of raw materials enter the process:
- 700 tons/day of methane
- 1590 tons/day of water
- 1650 tons/day of nitrogen
The process produces 2 main product streams:
- 2000 tons/day of ammonia
- 1940 tons/day of carbon dioxide
We can put together the following input-output diagram for this process:
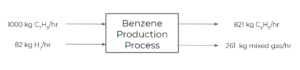
Exercise: Benzene Production Input-output Diagram
Consider a process where toluene is fed into a process at 1000 kg/hr and hydrogen is fed at 82 kg/hr. The following reaction takes place in the process:
[latex]C_{7}H_{8} + H_{2} ➡ C_{6}H_{6} + CH_{4}[/latex]
The reaction achieves 75% conversion and the products of the process are separated into 2 streams. The first product stream is benzene, exiting at 821 kg/hr. The second product stream is a mixed gas stream (including the unreacted reactants and by-products) exiting at 261 kg/hr. Draw an input-output diagram for this process.
Solution
Exercise: Production of Vinyl Chloride
Our client wants to produce 360,000 tonnes/yr (800 million lbs/yr) of vinyl chloride monomer. We decide to use the following reaction pathway, which contains two reaction steps as follows:
[latex]C_{2}H_{4} + Cl_{2} → C_{2}H_{4}Cl_{2} (1)[/latex]
[latex]C_{2}H_{4}Cl_{2} → C_{2}H_{3}Cl + HCl (2)[/latex]
We gather the following information on the process:
| Name | Formula | Molecular Weight (g/mol) | Price (USD/tonne) |
|---|---|---|---|
| Ethene | [latex]C_{2}H_{4}[/latex] | 28.05 | 733 |
| Chlorine | [latex]Cl_{2}[/latex] | 70.91 | 240 |
| Dichloroethane | [latex]C_{2}H_{4}Cl_{2}[/latex] | 98.96 | 300 |
| Hydrogen Chloride | [latex]HCl[/latex] | 36.46 | 140 |
| Vinyl Chloride | [latex]C_{2}H_{3}Cl[/latex] | 62.50 | 750 |
Assume as well that our production costs are [latex]200\frac{USD}{tonne}[/latex] of VC produced, and assume our VC production plant costs [latex]50,000,000 USD[/latex] to build. Note these values usually depend on the size of the plant, location, and other factors.
Create an input-output diagram of the process.
Solution
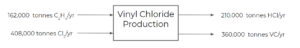
We know that one of the product streams will be 360,000 tonnes/yr of vinyl chloride. Hydrogen chloride is produced in a 1:1 molar ratio with vinyl chloride:
[latex]VC = 360,000 tonnes/yr*\frac{tonne-mol}{62.50 tonnes} = 5,760\frac{tonne-mol}{yr}[/latex]
[latex]HCl = 5,760\frac{tonne-mol}{yr}*36.46\frac{tonnes}{tonne-mol}=210,000\frac{tonnes}{yr}[/latex]
Similarly for ethane and chlorine, we get:
[latex]C_{2}H_{4} = 5,760\frac{tonne-mol}{yr}*28.05\frac{tonnes}{tonne-mol}=162,000\frac{tonnes}{yr}[/latex]
[latex]Cl_{2} = 5,760\frac{tonne-mol}{yr}*70.91\frac{tonnes}{tonne-mol}=408,000\frac{tonnes}{yr}[/latex]
From this and the information in the table, we get the following input-output diagram:

Feedback/Errata