25 Phase Diagram
Learning Objectives
By the end of this section, you should be able to:
Interpret phase diagram for relevant thermodynamic information (e.g. composition, temperature, pressure...)
Phase Transitions
The phase of a substance and separation between molecules are related to the intermolecular forces in a substance. Therefore, a source of energy needs to be supplied when the substance transitions to a higher energy state to separate the molecules in the substance.
Something similar you may recall from a previous chemistry course (say CHEM 154): Bond-breaking requires energy; Bond making releases energy. Similarly, a transition to a lower energy state releases energy.
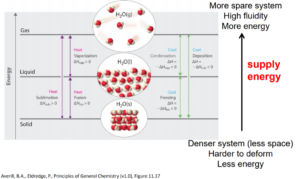
image obtained from General Chemistry: Principles, Patterns, and Applications/CC BY-NC-SA
Critical Point and Reduced Properties
The phase of a given substance depends on pressure and temperature. Thus, plots of pressure versus temperature showing the phase in each region provide considerable insight into the thermal properties of substances. Such a P-T graph is called a phase diagram. [latex]^{[1]}[/latex]
In the phase diagram, we can observe that the boiling point curve (the line that distinguishes liquid and vapour phases) ends at a point, which is called critical point. Above the critical point, liquid and gas can no longer be distinguished and are classified as a supercritical fluid.
Vapour phase is a gaseous species below its critical temperature. On the other hand, a gaseous phase describes a gaseous species above its critical temperature but below its critical pressure.
Triple point is defined to be the set of pressure and temperature that solid, liquid and vapour are in equilibrium together.
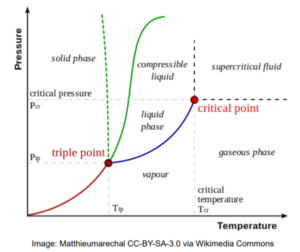
Reduced properties are defined as variables (pressure, temperature) scaled by their values at the critical point. Reduced properties can be useful in coming up with general equations describing different substances.
[latex]T_{c}[/latex] = critical temperature
[latex]P_{c}[/latex] = critical pressure
|
[latex]reduced\;temperature:\;\;T_{r}=\frac{T}{T_{c}}[/latex] [latex]reduced\;pressure:\;\;P_{r}=\frac{P}{P_{c}}[/latex] |
Phase Diagram of Water
Critical Pressure = [latex]P_{c} = 22.06 M\!Pa[/latex]
Critical Temperature = [latex]T_{c} = 647 K[/latex]
Triple point [latex]P[/latex] with ice [latex]I_{h}[/latex]= 611 Pa
Triple point [latex]T[/latex] with ice [latex]I_{h}[/latex] = 273.16 K
Ice [latex]I_{h}[/latex] is the most common crystal structure of ice, but ice has a total of 17 known crystal forms. The latest form was discovered in 2014.
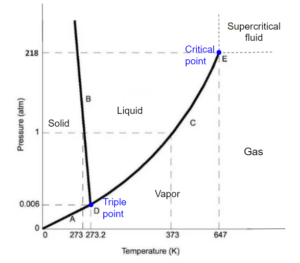
Image obtained from Chemistry libretexts / CC BY-NC-SA 3.0
At low temperatures, solid is the stable phase. At moderate temperatures and high pressure, liquid is the stable phase, and at high temperature and low pressure, gas/vapor is the stable phase. Lines separate these phases, representing sets of pressure/temperature for phase changes.
The melting curve or fusion curve of ice/water is very special. It has a negative slope due to the fact that when ice melts, the molar volume decreases. At higher pressure, ice actually melts at a lower temperature. When we skate, skate applies a very high pressure to the ice, so the ice below the skate melts without increasing temperature. The liquid formed between the skate and ice acts as a lubricant so that the skater moves gracefully across the ice. [latex]^{[2]}[/latex]
Thermodynamic Piston System
A thermodynamic system includes anything whose thermodynamic properties are of interest. It is embedded in its surroundings or environment; it can exchange heat with, and do work on, its environment through a boundary, which is the imagined wall that separates the system and the environment.
In reality, the immediate surroundings of the system are interacting with it directly and therefore have a much stronger influence on its behavior and properties. For our thermodynamic piston system, the gas inside the cylinder is the thermodynamic system; the cylinder, piston, and air outside form the surroundings of the system. The boundary then consists of the inner surfaces of the cylinder and piston. [latex]^{[3]}[/latex]
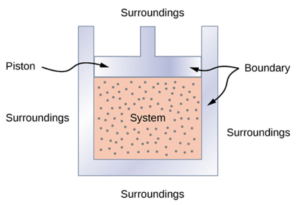
Image obtained from OpenStax University Physics Volume 2 / CC BY 4.0
Phase Transitions
The path from A to E below shows a process in a thermodynamic piston system containing pure water. The water vapor (point A) in the system is first compressed under the same temperature till a certain point at liquid state (point C). Then, the water is heated under the same pressure till a certain point at vapour state (point E).
During the process, we can see that the state of water passes through the boiling curve twice (points B and D). The curve indicates a transition of state between liquid and vapor. During a boiling (point D) or condensation (point B) process, the substance does not change in temperature or pressure. Since this phase diagram does not contain information on molar volume, points B and D could be a mixture of liquid and vapor at any ratio, including pure liquid or vapor at the boiling temperature and pressure.
![]()
Types of Phase Diagram
We have seen phase diagrams with pressure and temperature on the axes from the previous chapters; this was one projection of a phase diagram. Instead, we could also have other intensive variables on the axes. As a result, a 3-dimensional phase diagram can be produced with pressure, temperature, and molar volume on separate axises. Note that we could also use other intensive variables such as enthalpy or internal energy per mole, etc.
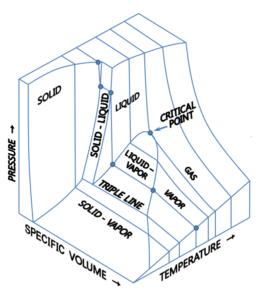
Image obtained from Wikimedia Commons/ CC BY-SA 3.0
A link to a 3-D model of phase diagram to help to visualize: http://biomodel.uah.es/Jmol/plots/phase-diagrams/
A phase diagram can be produced with the projection on any of the planes spanned by two of the axises in the 3-dimensional phase diagram above. For example, if we project it onto the Pressure-Volume (P-V) plane we get the image below. Note that volume here appears to be written as an extrinsic variable, but should rather be a specific volume (say in [latex]\frac{m^3}{kg}[/latex]).
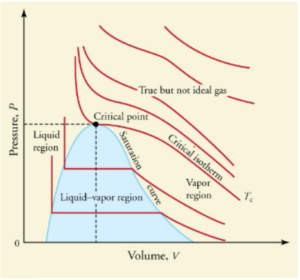
Image obtained from College Physics / CC BY 4.0
The red lines represent the substance at constant temperatures (isotherms). The isotherms have steeper slopes in the liquid region and gentler slopes in the vapour region. This agrees with what we observed before that the volume of gases experiences more significant changes due to pressure changes, but the volume of liquids is hardly affected by pressure.
The segments of isotherms in the vapour-liquid equilibrium region are horizontal, which agrees with our previous observation that the pressure is constant during the boiling process for a pure substance at a given temperauture. This diagram provides information that allows us to calculate the ratio of vapour to liquid under vapour-liquid equilibrium conditions based on molar volume, which is not represented on the P-T diagram because it collapses to a point. The vapour pressure is represented by the y-coordinate of the horizontal segment. Note each vapour pressure will thus correspond to specific to a temperature (given by the isotherm).
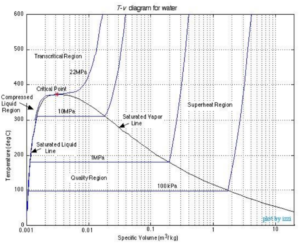
Image obtained from Chapter 2: Pure substances /CC BY-NC-SA 3.0 US
If we project the 3-dimensional phase diagram onto the temperature-volume (T-V) plane, the phase diagram will be similar to the one shown above. Each curve on the diagram represents processes with constant pressure (isobars). Similar to the P-V diagram, the pressure curve is horizontal in the region of vapour-liquid equilibrium. The vapour pressure is constant for each curve while the boiling temperature can be found as the y-coordinates on the horizontal segments. These correspond directly to the temperature and vapour pressure lines we would see on the P-V diagram.
References
[1] OpenStax University Physics Volume 2. 2016. 1.5 Phase Changes. [online] <https://openstax.org/books/university-physics-volume-2/pages/1-5-phase-changes> [Accessed 14 May 2020].
[2] Chemistry Libretext. 2020. Phase Diagrams. [online] <https://chem.libretexts.org/Bookshelves/Physical_and_Theoretical_Chemistry_Textbook_Maps/Supplemental_Modules_(Physical_and_Theoretical_Chemistry)/Physical_Properties_of_Matter/States_of_Matter/Phase_Transitions/Phase_Diagrams> [Accessed 14 May 2020].
[3] OpenStax University Physics Volume 2. 2016. 3.1 Thermodynamic Systems. [online] <https://openstax.org/books/university-physics-volume-2/pages/3-1-thermodynamic-systems> [Accessed 15 May 2020].

Feedback/Errata