54 Life Cycle Assessment
Learning Objectives
By the end of this section, you should be able to:
Understand the steps involved in life cycle assessment (LCA)
Interpret LCA results critically
Life Cycle Assessment
Terminology
- Cradle-to-grave: this scope includes all aspects of a product, starting from raw material extraction to the product's end of life (use and disposal)
- Cradle-to-gate: this scope includes all aspects of a product from raw material extraction to production, but does not include the product's use or disposal
- Gate-to-gate: this scope includes the manufacturing/production and processing aspects of a product only
Life Cycle Assessment (LCA) is a technique used to quantify the environmental impact of a product from raw material acquisition through end of life disposition (cradle-to-grave)
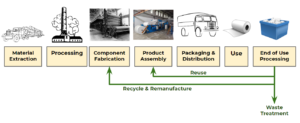
Product assembly image from Sammutawe / CC BY-SA
There are four stages of a life cycle assessment:
- Step 1: Goal Definition and Scoping: Identify the LCA's purpose, the products of the study, and determine the study boundaries. This can include things like what is included and what is not included in the study
- Step 2: Life-cycle Inventory: Quantify the energy and raw material inputs and environmental releases associated with each life cycle phase.
- Step 3: Impact Analysis: Assess the impacts on human health and the environment.
- Step 4: Interpret Results: Evaluate opportunities to reduce energy, material inputs, or environmental impacts at each stage of the product life-cycle.
Life Cycle Assessments are based on international standards set by the International Organization for Standardization (ISO 14040).
Each of the steps are set by different ISOs:
- Step 1: ISO 14041
- Step 2: ISO 14041
- Step 3: ISO 14042
- Step 4: ISO 14043
Exercise: Biofuels Product Scope
Consider the following system boundary diagram for the production of biofuels. Which scope does this representation cover (cradle-to-grave, cradle-to-gate, or gate-to-gate)?
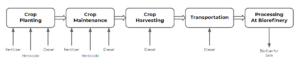
Solution
This diagram represents a cradle-to-gate scope because it shows the raw materials used for the production of biofuels, the transportation of raw materials, as well as initial processing.
Step 1: Goal Definition and Scoping
Define the goal:
- What is the intended application of the study?
- Who is the intended audience?
Define the scope:
- What is the product system to be studied?
- What is the functional unit?*
- What are the boundaries of the product system?
- What are the assumptions and limitations of the study?
- What impact categories need to be included in the study?
*Functional Units: a measure of the function of the studied system. It provides a reference to which the inputs and outputs can be related and enables a comparison of two essentially different systems.
Examples of functional units:
- For a paint system (the paint as well as layers of coating materials applied to a surface), the functional unit may be defined as the unit surface protected for 10 years
- For a printer, the funcional unit may be defined as the number of printed pages of an acceptable print quality
- For a power generation system, the functional unit may be defined as 1kWh of electricity
Example: Reusable Shopping Bags
Let's say you own a local grocery store in Kitsilano. Your customers start requesting that you sell reusable shopping bags to minimize waste. You think its a great idea, but want to make sure that the reusable shopping bags you sell have the lowest environmental impact. Since you are an engineer and learned about LCA in CHBE 220, you decide to perform a streamlined LCA.
What is your goal?
Determine which shopping bag has the lowest environmental impact
After doing a search of what is available on the market, you determine that your options for shopping bags are as follows:
- Single use paper
- Single use plasic
- Reusable plastic
- Reusable cotton
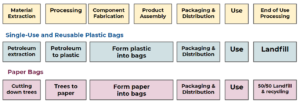
What are your system boundaries and process?
To simplify your LCA, you make the following assumptions:
- All bags are manufactured 100km from the customer
- All bags travel 10km from the customer to the end of life
- Half of paper bags are recycled at end of life and the other half go to a landfill
- Plastic and cotton bags go to landfill at the end of life
What is the functional unit for this system?
Let's take our functional unit to be the amount of shopping bags consumed by a household to carry 70 grocery items (~7 items per bag per trip) home from the supermarket each week for 52 weeks. Note you'll see that each bag type in the table below has relative capacities, and this is used to account for some bags having the ability to carry more or fewer items than others while comparing to single-use plastic bags as a basis.
| Bag Type | Single-Use Plastic | Single-Use Paper | Reusable Plastic | Reusable Cotton |
|---|---|---|---|---|
| Material | HDPE | Unbleached Kraft paper | Polypropylene | Cotton |
| Mass per bag | 7g | 42.6g | 95g | 85g |
| Relative Capacity | 1 | 0.9 | 1.1 | 1.1 |
| Bags per year | 520 | 578 | 4.55 | 4.55 |
| Mass bags per year | 3640g | 24622.8g | 432.25g | 386.75g |
Step 2: Life Cycle Inventory
The life cycle inventory step is a highly data-intensive step that is based on detailed material and energy balance analyses over the life cycle of a product. The aim of this step is to account quantitatively for the components which make up the life cycle for our products.
Advantages:
- Quantifiable data for each product to assess impacts (although these can be highly dependent on the assumptions we make in step 1)
Challenges:
- Assumptions made when data unavailable
- Can be very time-intensive to account for all materials, energy, and steps to create a product
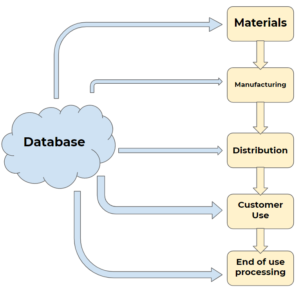
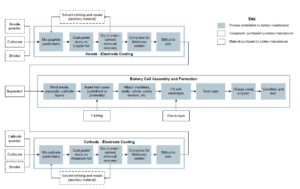
A life-cycle inventory can be summarized by block flow diagrams. The following diagram is one example for a typical manufacturing process for lithium-ion battery cells.[1]
Example: Reusable Shopping Bags Life-Cycle Inventory
Once again, you'd like to continue your LCA on the four options of shopping bags that you can offer in your grocery store. You gather the following information for quantities involved in each step of the lifecycle of these bags. Note most of these are measured in terms of a mass (eg grams, g) or mass per distance for travel (eg. tonne-kilometers, tkm).
| Single-Use Plastic Bag | |
|---|---|
| Polyethylene, HDPE, granulate | 3640g |
| Stretch blow moulding | 3640g |
| Transport, 100km manufacturing to customer | 0.364tkm |
| Transport, municipal waste collection, 10km customer to landfill | 0.0364tkm |
| Disposal, polyethylene, 0.4% water, to sanitary landfill | 3640g |
| Single-Use Paper Bag | |
|---|---|
| Kraft paper, unbleached, at plant | 24622.8g |
| Production of paper bags | 24622.8g |
| Transport, 100km manufacturing to customer | 2.4623tkm |
| Transport, municipal waste collection, 10km customer to landfill/recycling | 0.24623tkm |
| Disposal, packaging paper, to sanitary landfill | 12311g |
| Recycling paper | 12311g |
| Reusable Plastic Bag | |
|---|---|
| Polyethylene, granulate | 432.25g |
| Extrusion, plastic film | 432.25g |
| Transport, 100km manufacturing to customer | 0.043225tkm |
| Transport, municipal waste collection, 10km customer to landfill | 0.0043225tkm |
| Disposal, polyethylene, to sanitary landfill | 432.25g |
| Reusable Cotton Bag | |
|---|---|
| Textile, woven cotton, at plant | 386.75 |
| Transport, 100km manufacturing to customer | 0.03867tkm |
| Transport, municipal waste collection, 10km customer to landfill | 0.003867tkm |
| Disposal, inert material, to sanitary landfill | 386.75g |
Step 3: Impact Assessment
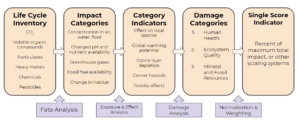
Impact Assessment Results: impact assessment converts the inventory into impact categories or endpoints, detailing human health and environmental impact.
- Converts the inventory into impact categories or mid/endpoints that characterize the environmental effects
- Impact categories may include: carcinogens, climate change, respiratory organics, and inorganics, radiation, ozone layer, ecotoxicity, acidification/eutrophication, land use, minerals, fossil fuels
- We can add weights to impact categories to indicate if we want to weight them more or less significantly in overall analysis (this is again where some assumptions may come in and so we have to be careful when setting up and interpreting LCAs)
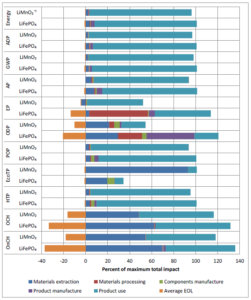
*ADP: abiotic depletion potential - depletion of non-living resources such as minerals, clay, fossil fuels, etc.
*AP: acidification potential - the potential of the battery releasing harmful acids into the environment
*EcoTP: ecological toxicity potential - the potential of the battery being toxic to surrounding ecology
*EP: eutrophication potential - nutrient addition that leads to the (over)growth of aquatic plant species; can lead to things like algal blooms and food chain disruptions
*GWP: global warming potential - the potential of warming caused by the release of greenhouse gases as caused by the battery
*HTP: human toxicity potential - the potential the battery process has for releasing chemicals that are toxic (dosage is taken into account) into the environmental
*OCH: occupational cancer hazard - the potential the battery process has for exposing people that work on this battery to carcinogens
*ODP: ozone depletion potential - the potential the battery process has for releasing chemicals that degrade the ozone layer
*OnCH: occupational non-cancer hazard - the potential the battery process has for exposing people that work on this battery to other diseases, injuries, or other health problems
*POP: photochemical oxidation potential - the potential the battery process has for releasing chemicals that react in the sunlight and release harmful products into the environment
*EOL: end-of-life; note that the negative values for the EOL bar signify recovery of the material at the end of battery's life, which reduced the life-cycle impact.
Step 4: Report Results
Life cycle interpretation: findings of the inventory analysis or impact assessment are evaluated in relation to the goal and scope of the study to reach conclusions and recommendations.
In this stage we aim to:
- Identify significant issues
- Evaluate results for completeness, consistency, and sensitivity of the data
- Draw conclusions and make recommendations consistent with the goal and scope of the study
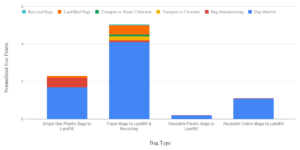
Example: Reusable Shopping Bags LCA Results
Consider the following chart that you put together after conducting an impact assessment on the 4 options for shopping bags. Note in this case that a lower score will mean less environmental impact (ie. lower score is better).
After contacting suppliers, you find that the cost per year for each of the shopping bags is as follows:
- Singe-Use Plastic: 10.40 dollars/year
- Singe-Use Paper: 40.46 dollars/year
- Reusable Plastic: 4.55 dollars/year
- Reusable Cotton: 27.30 dollars/year
Some questions you might ask:
- Which bag would you promote given the impact information?
- Which bag would you promote given the cost information?
- Which bag would customers most likely lean towards given the cost?
- Are there any assumptions you would change?
- Did your final result differ from your initial guess?
Given both the cost information and the environmental assessment, you might decide to go with the reusable plastic shopping bags, or offer these alongside re-useable cotton bags with some information to customers.
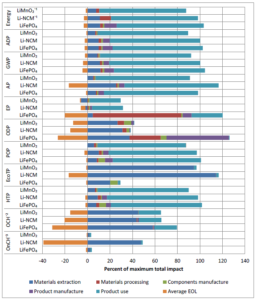
Exercise: LCA Results on Different Lithium-Ion Batteries
A life-cycle assessment is conducted on two different types of vehicle batteries: electric vehicle (EV) batteries and plug-in hybrid electric vehicle (PHEV) batteries. Each of these has different lithium-ion chemistries. The EV batteries have 3 different chemistries ([latex]LiMnO_{2}[/latex], [latex]Li-NCM[/latex], and [latex]LiFePO_{4}[/latex]), while the PHEV batteries have 2 different chemistries ([latex]LiMnO_{2}[/latex] and [latex]LiFePO_{4}[/latex]).[1]
Legend for the charts:
*ADP: abiotic depletion potential
*AP: acidification potential
*EcoTP: ecological toxicity potential
*EP: eutrophication potential
*GWP: global warming potential
*HTP: human toxicity potential
*OCH: occupational cancer hazard
*ODP: ozone depletion potential
*OnCH: occupational non-cancer hazard
*POP: photochemical oxidation potential
EV Batteries:
PHEV Batteries:
Your client is asking you to make a recommendation on which vehicle type (EV or PHEV) they should manufacture based solely on human toxicity potential through product use for batteries. Which vehicle type do you recommend based on the information you have and why?
Solution
Step 1: Determine where the human toxicity potential (HTP) is located on the graph.
Step 2: Compare the data of both EV and PHEV batteries side by side. Note that the 'product use' factor is the light blue/teal bar
EV:
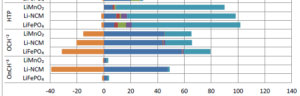
PHEV:
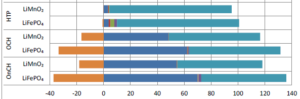
Step 3: Determine the approximate percentages for 'product use' for each of the factors and the batteries.
EV:
| Health Factor | [latex]LiMn_{2}[/latex] | [latex]LiFePO_{4}[/latex] | [latex]Li-NCM[/latex] |
|---|---|---|---|
| HTP | 80% | 80% | 80% |
PHEV:
| Health Factor | [latex]LiMn_{2}[/latex] | [latex]LiFePO_{4}[/latex] |
|---|---|---|
| HTP | 90% | 90% |
Step 4: Determine which battery type is the best choice based on your client's specifications.
Since the percentages are consistent among battery chemistries, our choice will be between the EV battery and the PHEV battery. The EV has a smaller impact on human toxicity potential through product use when compared to PHEV. Therefore, we recommend an EV battery.
References
[1]"Application of LifeCycle Assessment to Nanoscale Technology: Lithium-ion Batteries for Electric Vehicles", United States Environmental Protection Agency, 2013.

Feedback/Errata