30 Txy Diagram
Learning Objectives
By the end of this section, you should be able to:
Read Txy diagrams for binary mixtures
Find bubble points and dew points on a Txy diagram
Calculate the mole fraction of substances in the vapour and liquid states
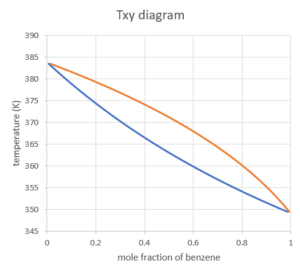
The following diagram is the Txy diagram (at a constant pressure of 1 atm) for a mixture of benzene and toluene. The y-axis (ordinate) reads the temperature value, and the x-axis (abscissa) corresponds to the mole fraction of benzene. We can use the x-axis to find the mole fraction of benzene in the liquid and vapour phase.
Because this is a binary mixture, we can calculate the mole fraction of toluene as [latex]1-x_{benzene}[/latex] in the liquid phase and [latex]1-y_{benzene}[/latex] in the vapour phase.
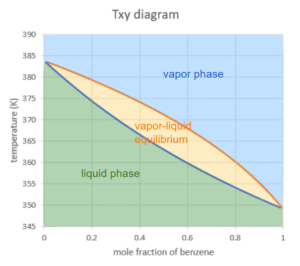
The two curves separate the digram into 3 regions:
Liquid region: when the mixture of both components are in liquid phase, this is the lowest temperature region. This makes sense as liquid is a lower energy state than a gas, so we would expect it at lower temperatures.
Vapour region: when the mixture of both components are in vapour phase, this is the highest temperature region. Again, the higher the temperature, the more energy, and thus more likely to be a gas.
Vapour-liquid equilibrium region: when the mixture splits into a liquid and a vapour, this is the region in the middle
Given a mole fraction of benzene and temperature of this system, we can locate which of the three regions our system would be in. Note we have to ensure we are at the same pressure as the graph states when using these graphs.
Two particular points we will analyze are when the mole fractions of benzene in the system are 1 or 0:
mole fractions of benzene = 1: [latex]x_{i}=y_{i}=1[/latex] , "mixture" is pure benzene. The system vapourizes/condenses at a contant temperature, which is the normal boiling point of benzene at 1 atm (~349 K in this case).
mole fractions of benzene = 0: [latex]x_{i}=y_{i}=0[/latex] , "mixture" is pure toluene. The system vapourizes/condenses at a contant temperature, which is the normal boiling point of toluene at 1 atm (~383 K in this case).
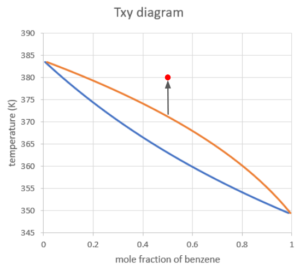
Let's take the following example to demonstrate how to read a Txy diagram: suppose we start with a mixture of 0.5 mole fraction of liquid benzene in the system at 80°C and 1 atm.
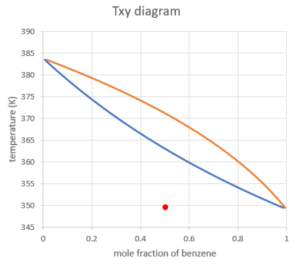
Shown above is the point we can locate on the Txy diagram. We can see that the point is completely in the liquid region, which means the mixture is completely in the liquid phase.
- In terms of phase change, the system of mixture behaves as a whole - the substance with a lower boiling point does not boil before the other, but the difference in boiling points is shown in the mole fraction of the components in each phase.
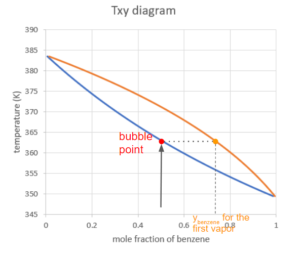
We then increase the temperature (keeping the pressure constant as defined by the diagram) until we hit the first curve on the boundary of the liquid region:
This point is called the bubble point of this mixture. At this point, we see the first bubble of vapour being formed in the liquid. The composition of this first vapour can be found at the point on the other curve at the same temperature:
Calculate the Composition of Vapour at the Bubble Point
We can also use the phase change data to calculate the composition of the first vapour. This is useful when the phase diagram is not provided:
The phase change data can be obtained from the NIST website:
| substance | A | B | C |
| benzene | 4.60362 | 1701.073 | 20.806 |
| toluene | 4.07827 | 1343.943 | -53.773 |
Solution
We can also use the phase change data to calculate the composition of the first vapour. This is useful when the phase diagram is not provided:
The phase change data can be obtained from the NIST website:
Using Raoult's law, we can calculate the molar composition of the vapour:
[latex]y_{i}×P=x_{i}×p_{i}^*(T)[/latex]
where
We are looking for the molar fraction of components in the vapour phase: [latex]y_{benzene}[/latex] and [latex]y_{toluene}[/latex].
P is the pressure of the system, in this case, it is kept constant at 1 atm=1.013bar
At the bubble point, there is a very small amount of vapour being formed, therefore we assume the change in the composition of the liquid is negligible. We can take [latex]x_{benzene}=0.5[/latex].
[latex]p_{i}^*[/latex] can be calculated using the Antoine Equation:
[latex]log_{10}(p^*)=A-\frac{B}{T+C}[/latex]
However, we don't know the T for the bubble point (we are assuming the diagram is not given):
When we don't know the bubble point temperature, we use a trial and error approach: We guess a temperature and use this to find [latex]p_{i}^*[/latex] for the substances involved. We then calculate the [latex]y_{i}[/latex] for both substances using Raoult's law and the [latex]x_{i}[/latex] in the liquid phase. If we are at the right temperature (the bubble point temperature) this should result in the sum of [latex]y_{i}[/latex] being equal to 1 ([latex]\sum_{i} y_{i}=1[/latex]).
- If the guess results in [latex]\sum_{i} y_{i}<1[/latex], that means the guess of temperature is lower than the bubble point. We should raise the temperature for the next trial so that the substances are more likely to vapourize.
- If the guess results in [latex]\sum_{i} y_{i}>1[/latex], that means the guess of temperature is higher than the bubble point. We should lower the temperature for the next trial so that the substances are more likely to condense.
- You can use a software (e.g. "solver" in excel) to directly solve the bubble point temperature.
A safe place to start is taking the average of the boiling points of the two substances, but the starting point does not affect the result. It may just affect the number of iterations needed before finding the actual bubble point temperature.
From the NIST website, we can find that the boiling point of benzene at 1 atm ≈ 80°C and the boiling point of toluene at 1 atm ≈ 110°C, so we can take [latex]T=95°C=368K[/latex] for our initial guess:
Step 1: Calculate [latex]p^*[/latex] for both substances using the Antoine Equation:
\begin{align*}
log_{10}(p*) &=A-\frac{B}{T+C}\\
p*& = 10^{A-\frac{B}{T+C}}\\
p*_{benzene}&= 10^{4.60362-\frac{1701.073}{368+20.806}}= 1.692 bar \\
p*_{toluene}&= 10^{4.07827-\frac{1343.943}{368-53.773}}=0.633 bar
\end{align*}
Step 2: Calculate the [latex]y_{i}[/latex] for both substances using Raoult's law:
\begin{align*}
y_{i}×P & =x_{i}×p_{i}^*(T)\\
y_{benzene}& =\frac{x_{benzene}×p_{benzene}^*(T)}{P}\\
&= \frac{0.50×1.692bar}{1.013bar}\\
& = 0.835
\end{align*}
\begin{align*}
y_{toluene}& =\frac{x_{toluene}×p_{toluene}^*(T)}{P}\\
&= \frac{(1-0.50)×0.633bar}{1.013bar}\\
& = 0.312
\end{align*}
Step 3: Check our result by adding up the [latex]y_{i}[/latex] and adjust the guess of temperature accordingly.
[latex]\sum_{i} y_{i}=0.835+0.312=1.147>1[/latex]
So the guess for [latex]T[/latex] should be decreased for the next guess.
After several trials, we can prove that [latex]T=363K[/latex] is the bubble point temperature:
Step 1: Calculate [latex]p^*[/latex] for both substances using the Antoine Equation
\begin{align*}
log_{10}(p*) &=A-\frac{B}{T+C}\\
p^*& = 10^{A-\frac{B}{T+C}}\\
p^*_{benzene}&= 10^{4.60362-\frac{1701.073}{363+20.806}}= 1.484 bar\\
p^*_{toluene}&=10^{4.07827-\frac{1343.943}{363-53.773}}=0.633 bar=0.540bar
\end{align*}
Step 2: Calculate the [latex]y_{i}[/latex] for both substances using Raoult's law:
\begin{align*}
y_{i}×P & =x_{i}×p_{i}^*(T)\\
y_{benzene}& =\frac{x_{benzene}×p_{benzene}^*(T)}{P}\\
&= \frac{0.50×1.484bar}{1.013bar}= 0.732
\end{align*}
\begin{align*}
y_{toluene}& =\frac{x_{toluene}×p_{toluene}^*(T)}{P}\\
&= \frac{(1-0.50)×0.540bar}{1.013bar}= 0.267
\end{align*}
Step 3: Check our result:
[latex]\sum_{i} y_{i}=0.732+0.267=0.999[/latex]
Because there are rounding errors involved in the calculations, we can say that T=363 K is our bubble point temperature (at least to +/- 1 K).
Therefore, the molar fractions of the substances for the first vapour at the bubble point are [latex]y_{benzene}=0.732[/latex] and [latex]y_{toluene}=0.267[/latex]. Note that this matches what we see on the diagram.
The composition of the vapour at the bubble point can also be solved with the solver add-in in excel:
How to load "Solver Add-in" in Excel:
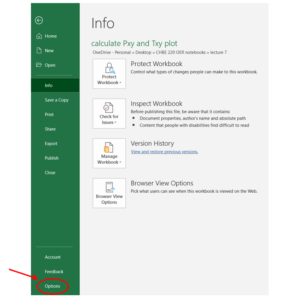
Step 1: Click "file" in the header and open the "Options" menu:
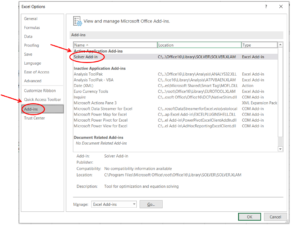
Step 2: In the Excel Options menu, select "Solver Add-in" in the "Add-ins" section, then click "OK".
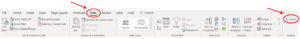
Step 3: Then you can find the "Solver" in the "Analyze" section under the "Data" menu.
Solve for the composition of the vapour at the bubble point with the solver add-in in excel:
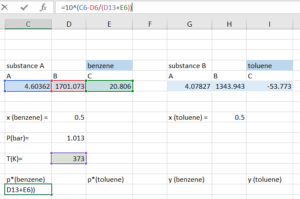
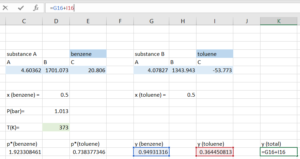
Step 1: To find the composition of the vapour at the bubble point, we first input all the know information for the calculation, including:
- Antoine equation parameters
- pressure, which is kept to be constant during the process
- composition of the mixture in the liquid phase
- a guess of the bubble point temperature (does not need to be accurate, again the average of the boiling points of the two pure substances is a safe place to start)
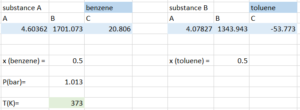
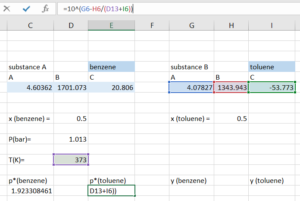
Step 2: Compute the vapour pressure of both substances using the temperature we guessed:
Step 3: Compute [latex]y_{i}[/latex] for both substances using:
[latex]y_{i} =\frac{x_{i}×p_{i}^*(T)}{P}[/latex]
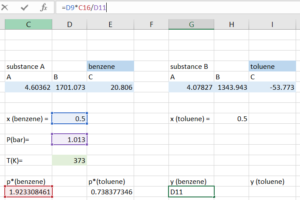
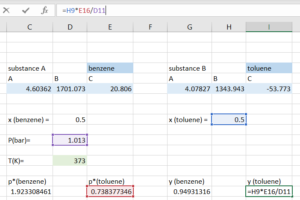
Step 4: Compute the [latex]y_{total}[/latex] by adding the [latex]y_{i}[/latex] for both substance. With our initial guess, the [latex]y_{total}[/latex] we get should be close, but not equal to 1.
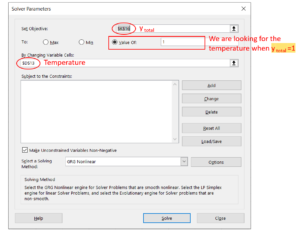
Step 5: Open the "Solver", indicate that we want to solve for the temperature that makes our [latex]y_{total}=1[/latex].
- Set objective to be the cell containing [latex]y_{total}[/latex]
- To be: value of 1
- By changing variable cells containing temperature
- Click "Solve"
Step 6: Click "OK" if the window says the solver found a solution. If the solver cannot find a solution, it is maybe because our initial guess is too far away from the actual bubble point temperature, if so, we can change the temperature and try to solve it again.
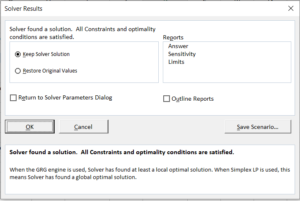
Step 7: After the window closes automatically, the value for temperature and all cells affected by temperature are changed to the corresponding values calculated for the bubble point temperature found.
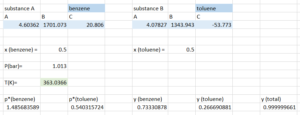
Therefore, according to the result generated by solver:
Bubble point temperature = 363.04K
The molar fractions of the substances for the first vapour at the bubble point are [latex]y_{benzene}=0.733[/latex] and [latex]y_{toluene}=0.267[/latex]. Note this matches what we see on the diagram and our result from the trial-and-error approach. Note, that you could also use excel without solver to make guess and check faster, we would simply guess temperatures and see the effect on [latex]y_{total}[/latex]. This then uses excel to do the calculations each time we update the guess, making solving much faster. However, solver automates this process of guessing temperatures.
If we keep increasing the temperature, the system will be in the vapour-liquid equilibrium region. We locate the point using the total mole fraction of benzene and the temperature of the system, so the x-coordinate is 0.5 no matter what phase the system is at.
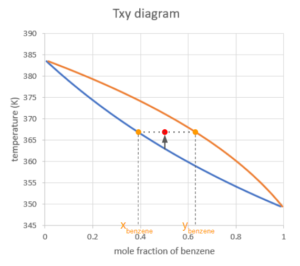
After we find the point, we draw a horizontal line (representing that the temperature of the liquid and vapour are equal under vapour-liquid equilibrium conditions), the line will hit both curves. The x-coordinates of the points where the horizontal line hits the curves are the mole fraction of benzene, with the one on the boundary of the liquid region as the mole fraction in the liquid phase and the other one as the mole fraction in the vapour phase.
At vapour-liquid equilibrium, there is always more benzene in the vapour phase compared to benzene in the liquid phase. That is because benzene is the more "volatile" compound compared to toluene, which means it has weaker intermolecular interactions, therefore it's more likely to vapourize. A more volatile compound has a lower boiling point.
Exercise: Calculate the Mole Fraction at Vapour-Liquid Equilibrium
Calculate the molar fraction of the total liquid component ([latex]\frac{n_{liquid}}{n_{total}}[/latex]) in the system at the point shown above in the vapour-liquid region. Use values for the mole fraction of benzene in the vapour and liquid phases as read off the graph to find this.
Solution
We know that the total benzene in the system is from the sum of the benzene molecules from the liquid and vapour phase, which is equal to 0.5 (as we start with a half/half mixture):
[latex]x_{benzene}*n_{liquid}+y_{benzene}*n_{vapour} = 0.5*n_{total}[/latex]
[latex]x_{benzene}×\frac{n_{liquid}}{n_{total}}+y_{benzene}×\frac{n_{vapour}}{n_{total}}=0.5[/latex]
We can replace the expression of [latex]\frac{n_{vapour}}{n_{total}}[/latex], starting from [latex]n_{vapour}+n_{liquid} = n_{total}[/latex] because the are only liquid phase and vapour phase present in the system:
\begin{align*}
n_{vapour}+n_{liquid} &= n_{total}\\
\frac{n_{vapour}}{n_{total}}+\frac{n_{liquid}}{n_{total}}&=1\\
\frac{n_{vapour}}{n_{total}}&=1-\frac{n_{liquid}}{n_{total}}
\end{align*}
Substitute [latex]1-\frac{n_{liquid}}{n_{total}}[/latex] into the [latex]\frac{n_{vapour}}{n_{total}}[/latex] in the equation:
[latex]x_{benzene}×\frac{n_{liquid}}{n_{total}}+y_{benzene}×(1-\frac{n_{liquid}}{n_{total}})=0.5[/latex]
From reading the x-coordinates of the points on the curves, we can get: $x_{benzene}≈0.39,y_{benzene}≈0.62$
\begin{align*}
0.39×\frac{n_{liquid}}{n_{total}}+0.62×(1-\frac{n_{liquid}}{n_{total}}) & =0.5\\
(0.39-0.62)\frac{n_{liquid}}{n_{total}}& = 0.5-0.62\\
\frac{n_{liquid}}{n_{total}}&= \frac{0.5-0.62}{0.39-0.62}\\
& = 0.52
\end{align*}
Note this means we have roughly half vapour and half liquid. This is shown by our overall system point (red dot) being roughly between the two lines. Within the vapour-liquid region, the closer this point is to a certain line on the diagram the more of that phase will be in the system. Think back to our bubble point, where our system was almost entirely liquid (and very close to the liquid line).
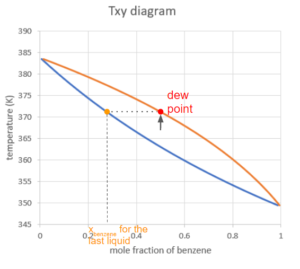
If we then keep heating up the system under the same pressure, the system will hit the second curve at a certain point. We call this point the dew point. At this point, the last drop of liquid turns into vapour. The composition of the last drop of liquid can be found on the curve on the boundry of the liquid region at the same temperature.
In the Txy graph, the line connecting all the dew points (saturated vapour line) is always higher than the line connecting all the bubble points (saturated liquid line). Whether the slopes of the curves are positive or negative, the saturated vapour line will still be above the saturated liquid line because the system is more likely to be in the vapour phase when the temperature is higher.
Exercise: Dew Point Mole Fraction
Taking a similar approach to the bubble point and using Raoult's law, calculate the [latex]x_{benzene}[/latex] and [latex]x_{toluene}[/latex] for the last drop of liquid at the dew point using the Antoine equation constants below.
| Substance | A | B | C |
| benzene | 4.60362 | 1701.073 | 20.806 |
| toluene | 4.07827 | 1343.943 | -53.773 |
Solution
Raoult's law states:
[latex]y_{i}×P=x_{i}×p_{i}^*(T)[/latex]
We know that P = 1.013 bar for the system is kept constant, then we just need to calculate the [latex]p^*[/latex] at the temperature of the dew point, then substitute this into the Raoult's law equation to calculate [latex]x_{i}[/latex].
To find [latex]p^*[/latex] using the Antoine equation, we must first guess a temperature. Similar to the bubble point calculation, a safe place to start is the average of the boiling points of the pure substances T=368K.
Step 1: Calculate the [latex]p^*_{i}[/latex] for both substances:
\begin{align*}
log_{10}(p*) &=A-\frac{B}{T+C}\\
p*& = 10^{A-\frac{B}{T+C}}\\
p*_{benzene}&= 10^{4.60362-\frac{1701.073}{368+20.806}}= 1.692 bar \\
p*_{toluene}&= 10^{4.07827-\frac{1343.943}{368-53.773}}=0.633 bar
\end{align*}
Step 2: Substitute into the Raoult's law equation to calculate [latex]x_{i}[/latex] for both substances:
Use [latex]y_{benzene}=0.5[/latex], because when there is only very little amount of liquid left in the system, we can approximate the mole fraction of benzene in the vapour to be equal to the total mole fraction of benzene in the system.
\begin{align*}
y_{i}×P & =x_{i}×p_{i}^*(T)\\
x_{benzene}& =\frac{y_{benzene}×P}{p^*_{benzene}}\\
&= \frac{0.5×1.013bar}{1.692bar}\\
& = 0.299
\end{align*}
\begin{align*}
x_{toluene}& =\frac{y_{toulene}×P}{p^*_{toluene}}\\
&= \frac{0.5×1.013bar}{0.633bar}\\
& = 0.800
\end{align*}
Step 3: Calculate the sum of the liquid mole fractions, and adjust the temperature guess accordingly:
[latex]\sum_{i} x_{i}=0.299+0.800=1.099>1[/latex]
The next guess for T should be higher so that the substances tend to condense less.
After several trials, we can show that [latex]T=371.2K[/latex] is the bubble point temperature:
Step 1: Calculate the [latex]p^*_{i}[/latex] for both substances:
\begin{align*}
log_{10}(p*) &=A-\frac{B}{T+C}\\
p*& = 10^{A-\frac{B}{T+C}}\\
p*_{benzene}&= 10^{4.60362-\frac{1701.073}{371.2+20.806}}= 1.837 bar \\
p*_{toluene}&= 10^{4.07827-\frac{1343.943}{371-53.773}}=0.699 bar
\end{align*}
Step 2: Substitute into the Raoult's law equation to calculate [latex]x_{i}[/latex] for both substances:
\begin{align*}
y_{i}×P & =x_{i}×p_{i}^*(T)\\
x_{benzene}& =\frac{y_{benzene}×P}{p^*_{benzene}}\\
&= \frac{0.5×1.013bar}{1.837bar}\\
& = 0.276
\end{align*}
\begin{align*}
x_{toluene}& =\frac{y_{toulene}×P}{p^*_{toluene}}\\
&= \frac{0.5×1.013bar}{0.695bar}\\
& = 0.725
\end{align*}
Step 3: Calculate the sum of the liquid mole fractions, and adjust the temperature guess accordingly:
[latex]\sum_{i} x_{i}=0.276+0.725=1.001[/latex]
Because there are rounding errors involved in the calcuations, we can say that T=371.2K is our bubble point temperature.
Therefore the molar fractions of ths substances in the last drop of liquid at the dew point are [latex]x_{benzene}=0.276[/latex] and [latex]y_{toluene}=0.725[/latex].
If we keep increasing the temperature above the dew point, the system will be in the vapour phase only. The mole fraction of benzene will still be 0.5 since it is the ratio of total benzene molecules and total molecules in the system, regardless of the state.

Feedback/Errata