2. Thermodynamic Properties of a Pure Substance
2.3 Phase diagrams
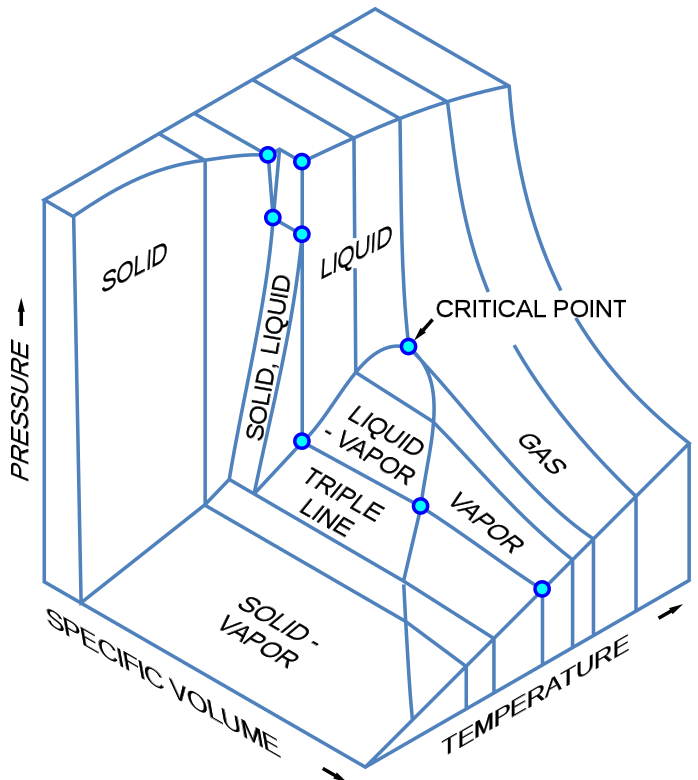
A pure substance may exist in any of the three phases: solid, liquid, and vapour, at certain temperatures and pressures. When its temperature or pressure changes, a substance may transition from one phase to another. For example, liquid water at 1 atm turns into ice when its temperature drops to the freezing point of 0oC. The equilibrium state of a pure substance and its phase transitions are commonly illustrated in phase diagrams. Figure 2.3.1 is a three-dimensional [latex]P-v-T[/latex] phase diagram, where the three axes are pressure, specific volume, and temperature, respectively. This phase diagram clearly shows the single phase regions of solid, liquid, and vapour or gas, as well as three two-phase regions, where solid-liquid, liquid-vapour, or solid-vapour coexist in equilibrium. The three-dimensional [latex]P-v-T[/latex] phase diagram can be projected to generate two-dimensional phase diagrams, such as [latex]P-T[/latex], [latex]P-v[/latex], and [latex]T-v[/latex] diagrams. When analyzing processes and cycles, these two-dimensional phase diagrams are commonly used, and therefore will be discussed in detail here.
2.3.1 P-T diagram
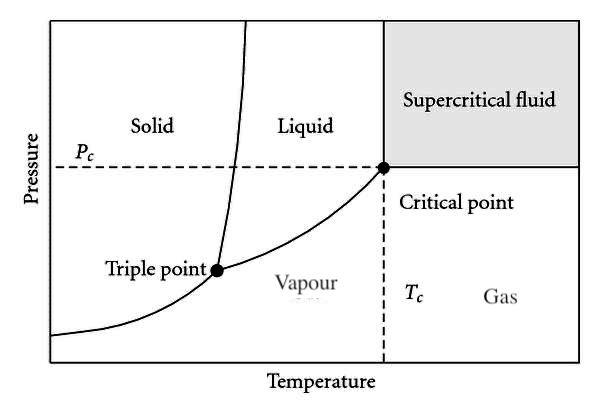
Figure 2.3.2 shows a generic pressure-temperature, [latex]P-T[/latex], diagram, from which we can observe three single-phase regions, three curves representing the two-phase mixtures, and two unique points: the triple point and the critical point.
The single phase regions are labeled as solid, liquid, and vapour or gas in the [latex]P-T[/latex] diagram. The liquid and vapour phases are often called compressed liquid and superheated vapour, respectively.
In the [latex]P-T[/latex] diagram, the two-phase regions appear as curves separating different single phases. The curve that lies between the liquid and vapour phases is called vaporization line. Each point on the vaporization line represents an equilibrium state of saturation; the substance is either a saturated liquid, a saturated vapour, or a two-phase liquid-vapour mixture. The temperature and its corresponding pressure at each point on the vaporization line are called saturation temperature, [latex]T_{sat}[/latex], and saturation pressure, [latex]P_{sat}[/latex], respectively. Each saturation temperature corresponds to a unique saturation pressure, and vice versa. A liquid (or vapour) starts to evaporate (or condense) when its temperature and pressure reach [latex]T_{sat}[/latex] and [latex]P_{sat}[/latex]. The saturation properties of selected fluids can be found in the thermodynamic tables in Appendices A-D.
The curve that represents the transition between the solid and liquid phases is called fusion line. Each point on the fusion line has a unique set of temperature and pressure called freezing temperature and freezing pressure, respectively. Along the fusion line, the substance may exist as a saturated liquid, a solid, or a two-phase solid-liquid mixture.
The curve below the triple point is called sublimation line, across which a substance can change directly from solid to vapour or vice versa without a transition through the liquid phase. Each point on the sublimation line represents an equilibrium state, at which the substance may exist as a saturated vapour, a solid, or a two-phase solid-vapour mixture.
The vaporization, fusion and sublimation lines meet at the triple point, at which the three phases, solid, liquid, and vapour, coexist in equilibrium. Appendix F lists the triple points of a selection of pure substances. It is noted, from Figure 2.3.2, that the liquid phase cannot exist below the triple point pressure. When a substance is at a pressure lower than the triple point pressure, it can only transition between the solid and vapour phases.
The critical point in the [latex]P-T[/latex] diagram is where the vaporization line ends. The pressure and temperature at the critical point are called critical pressure, [latex]P_c[/latex], and critical temperature, [latex]T_c[/latex], respectively. A state above the critical point has a pressure [latex]P>P_c[/latex] and a temperature [latex]T>T_c[/latex]; therefore, it is referred to as a supercritical state. A substance at a supercritical state is called supercritical fluid, which has a unique characteristic: no distinct liquid and gas phases can exist anymore in the supercritical zone. In this book, we will mainly focus on the subcritical zone, where [latex]P < P_c[/latex].
Example 1
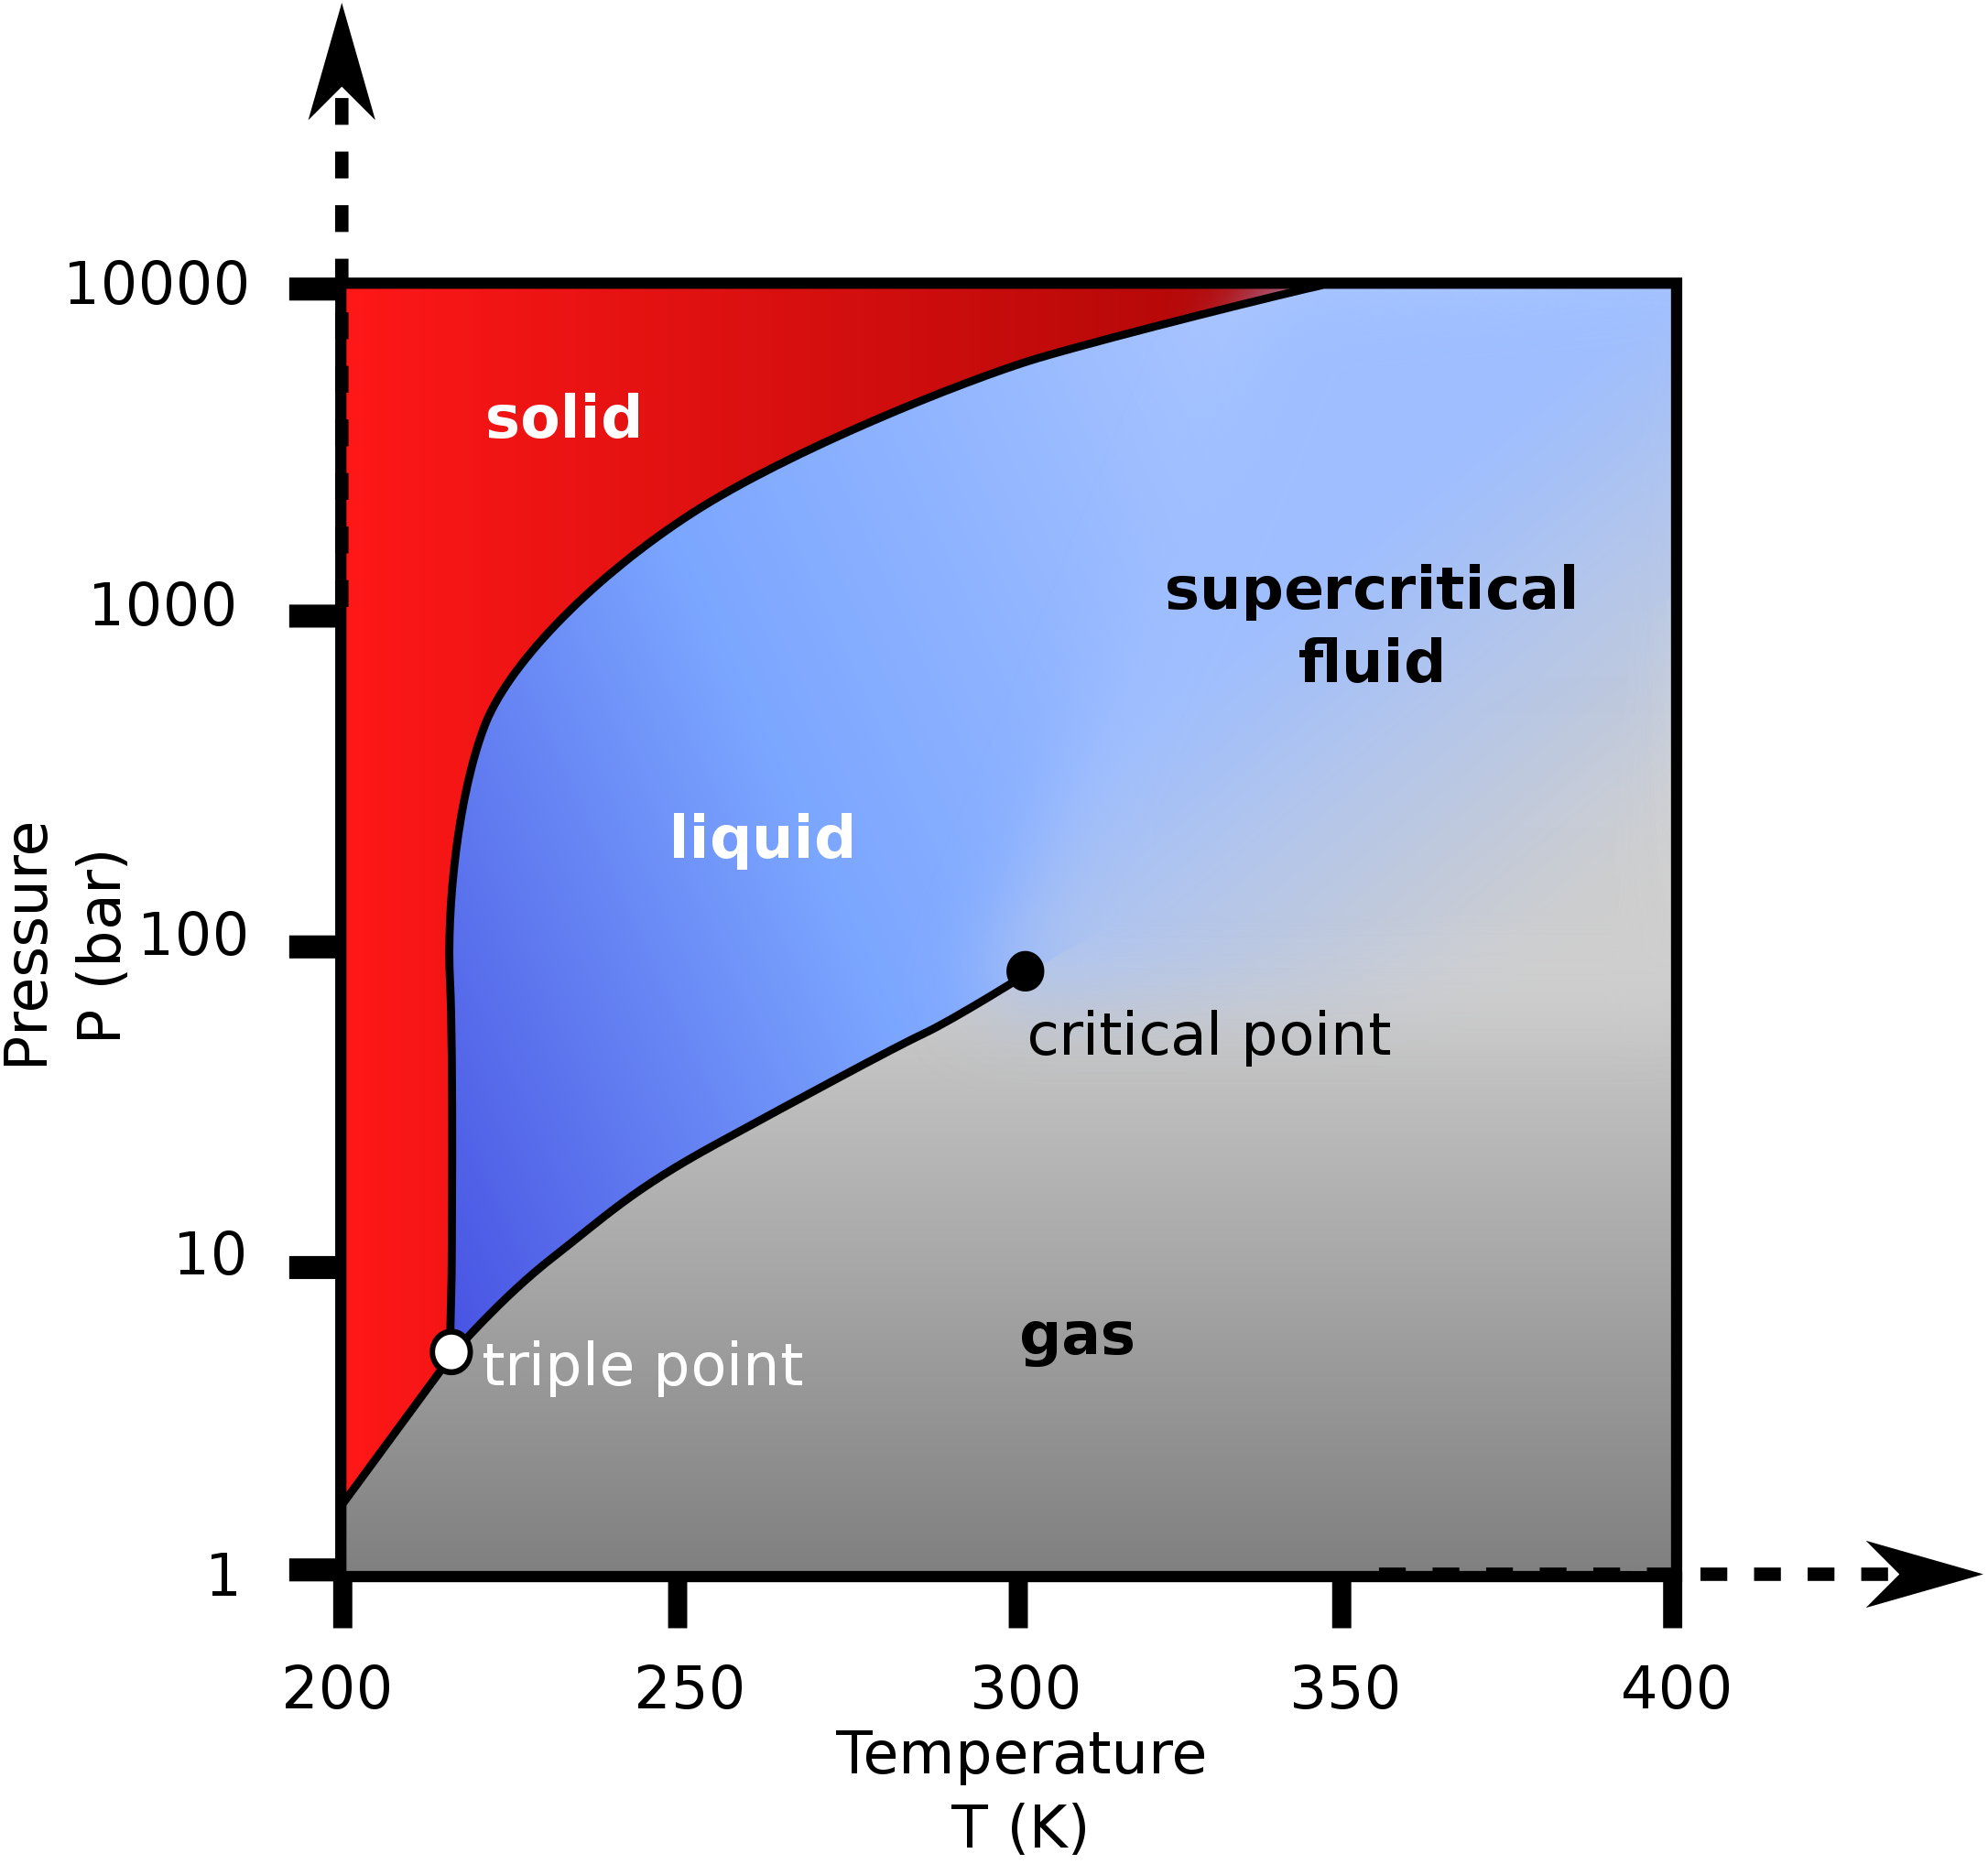
Review the P-T diagram for CO2, as shown in Figure 2.3.3.
- What is the lowest pressure for liquid CO2 to exist?
- Is CO2 at 100 bar, 275 K a solid, liquid or gas?
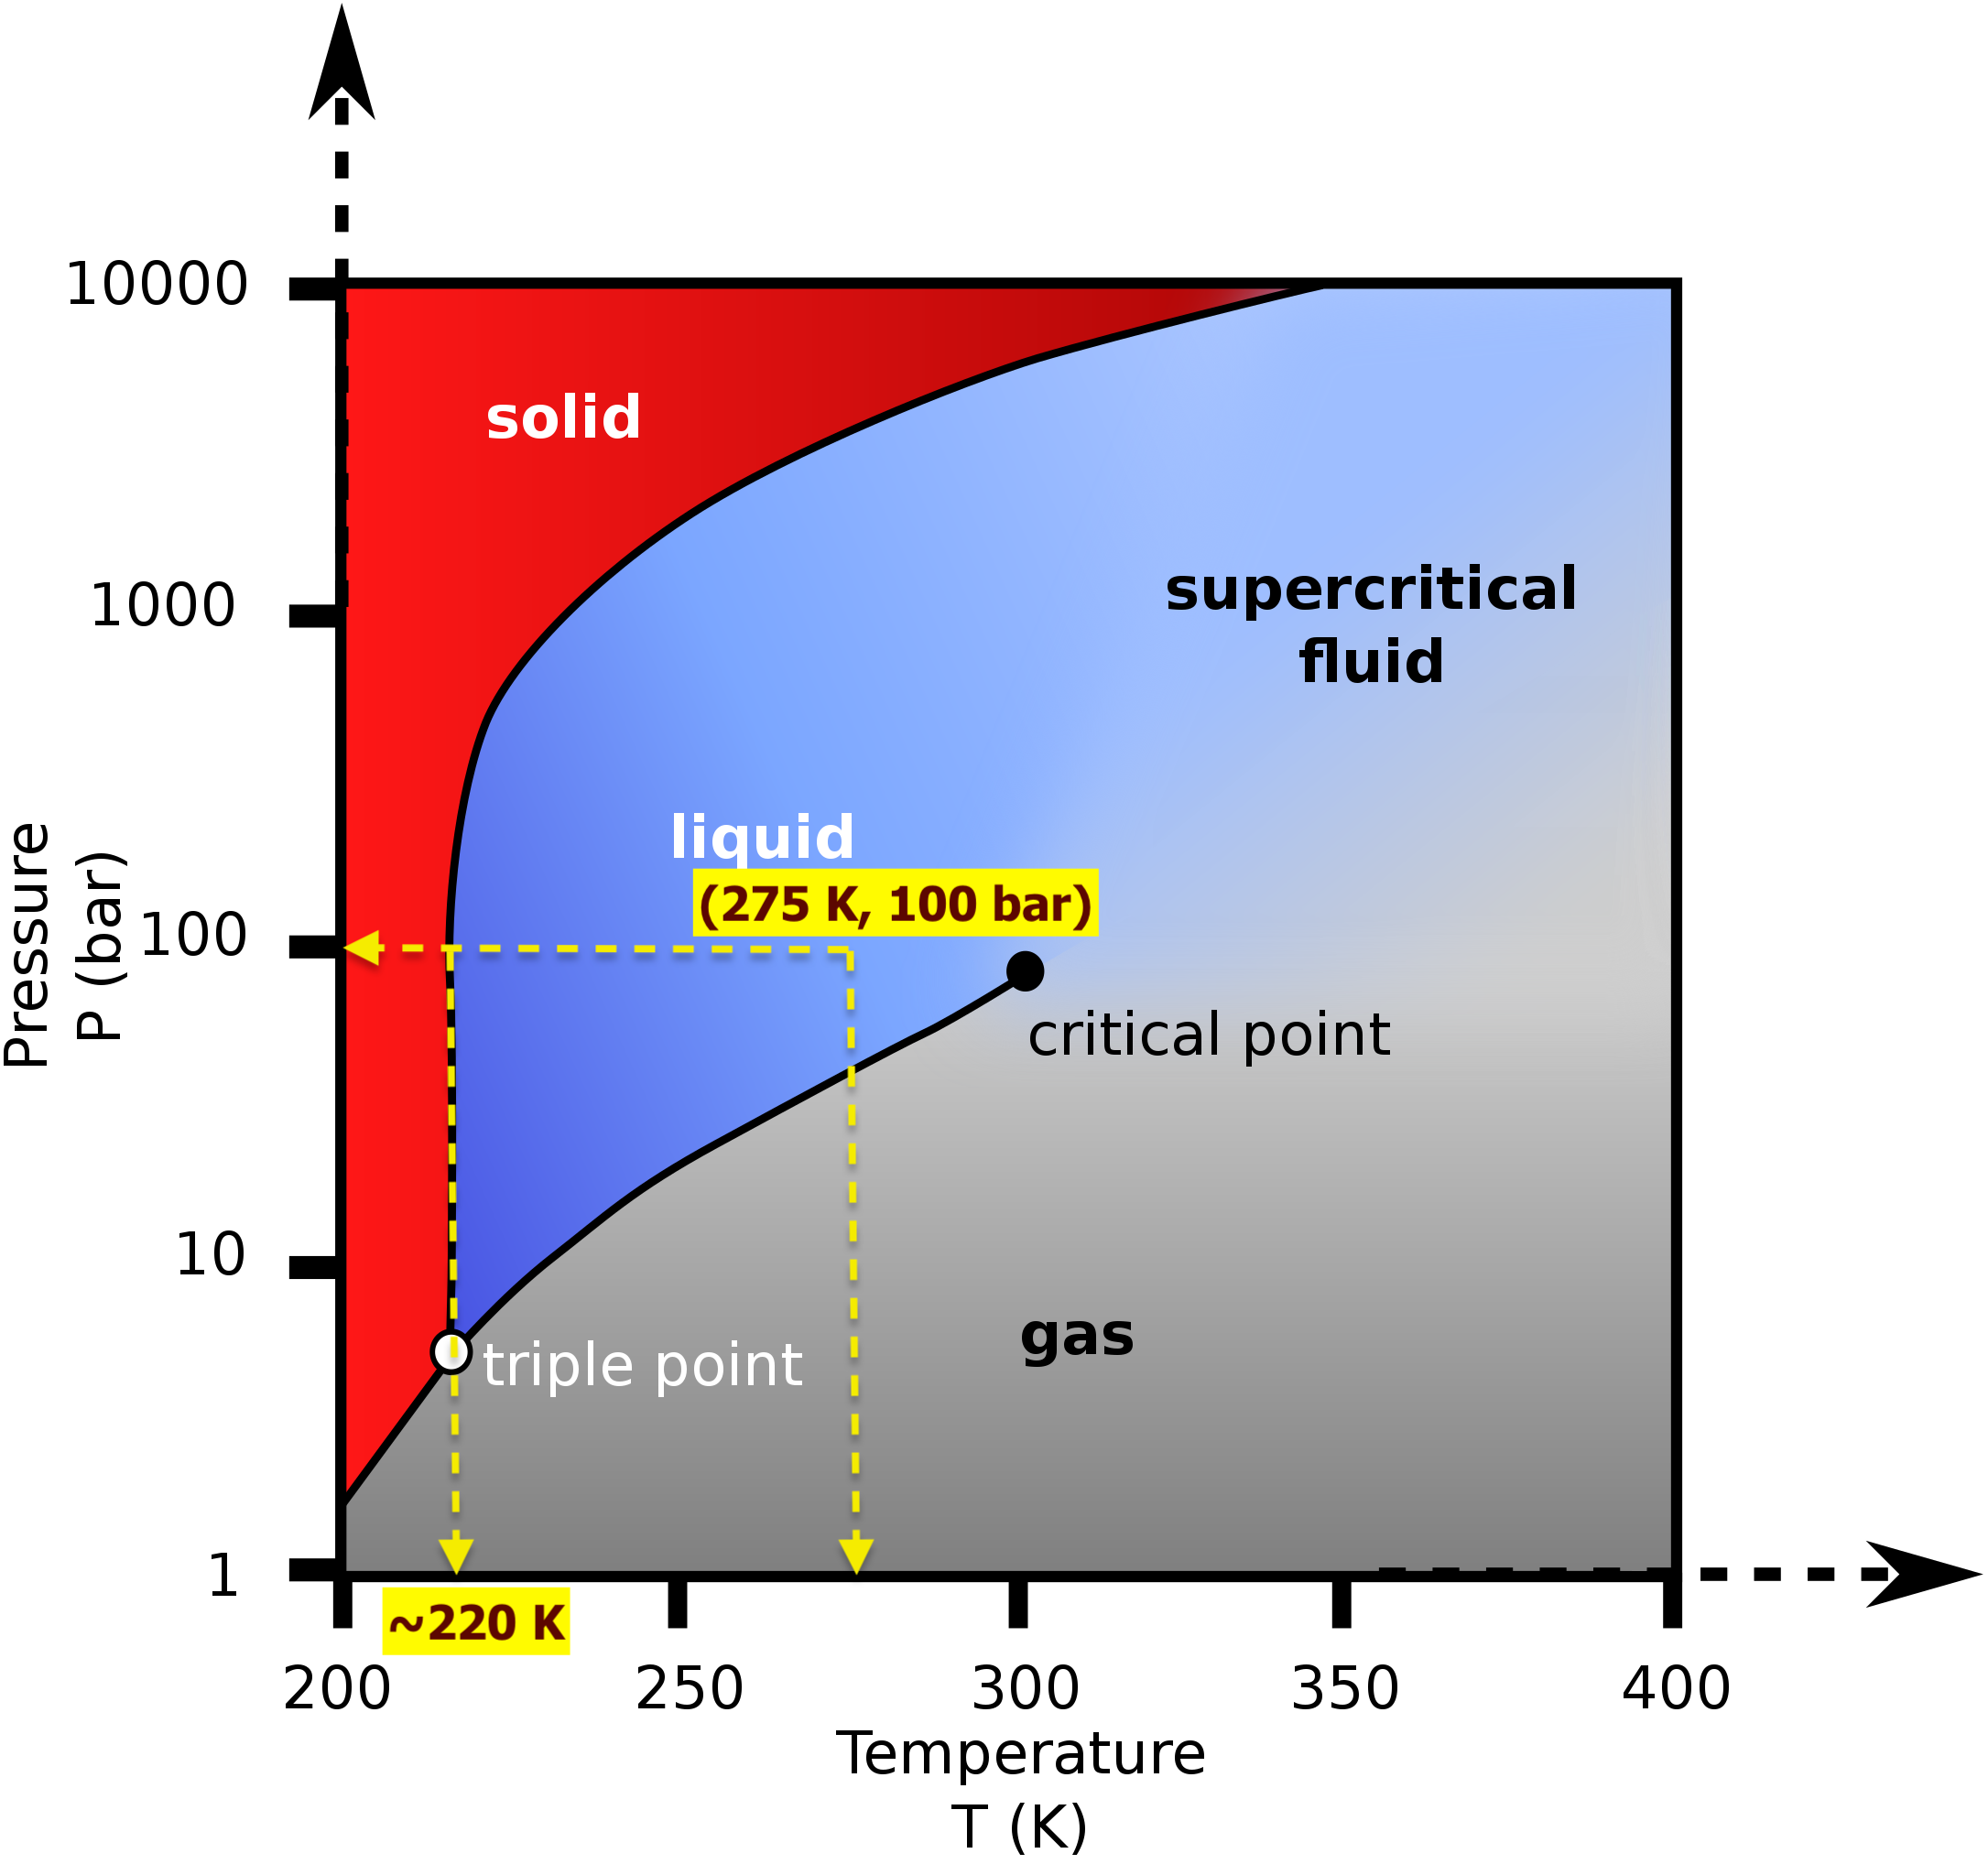
- CO2 at 100 bar, 275 K is cooled in an isobaric process. At approximately what temperature will CO2 start to change its phase? Will it change to a liquid or a solid? Draw the process line.
Solution:
- From the P-T diagram, the liquid phase can only exist when the pressure is great than the triple point pressure. From Appendix F, Table F1, CO2 has a triple point pressure of 517 kPa and a triple point temperature of 216.55 K (−56.60 °C), respectively; therefore, the lowest pressure for liquid CO2 to exist is 517 kPa.
- From the P-T diagram, Figure 2.3.e1, CO2 at 100 bar, 275 K is in the liquid phase.
- The isobaric process is shown as the horizontal, yellow line with a constant pressure of 100 bar, see Figure 2.3.e1. At approximately 220 K, the isobaric process line meets the fusion line, and the liquid CO2 starts to change to solid CO2.
2.3.2 T-v and P-v diagrams
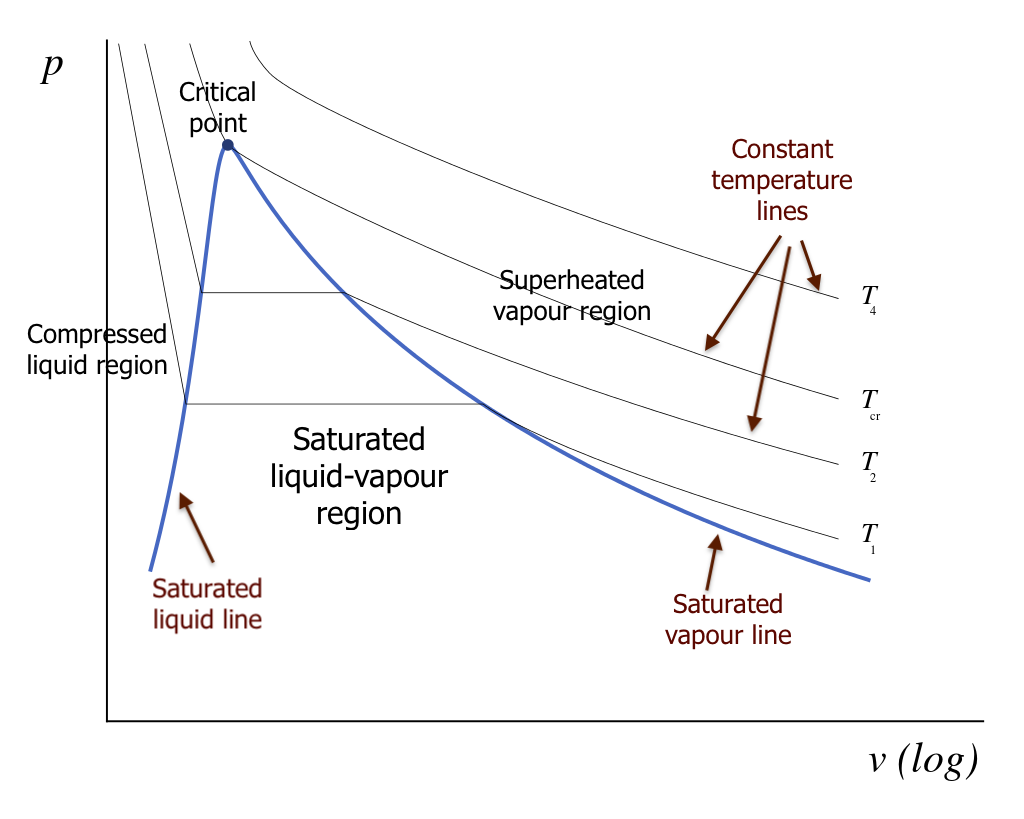
In many thermodynamic cycles, a working fluid experiences phase changes between liquid and vapour in the subcritical zone, such as water in a steam power plant and R134a in a vapour-compression refrigeration system. The liquid-vapour phase change can be illustrated in the [latex]T-v[/latex] and [latex]P-v[/latex] diagrams, as shown in Figures 2.3.4 and 2.3.5. In these diagrams, we can clearly see the three regions: compressed liquid region, saturated liquid-vapour region, and superheated vapour region. The curve that separates the compressed liquid region and saturated liquid-vapour region is called the saturated liquid line. Any point on the saturated liquid line represents a saturated liquid state. In a similar fashion, the curve that lies between the saturated liquid-vapour region and the superheated vapour region is called the saturated vapour line. Any point on the saturated vapour line represents a saturated vapour state. The two saturation lines meet at the critical point.
It is important to note that the liquid state is commonly called compressed liquid or subcooled liquid, and the vapour state is commonly called superheated vapour. In the liquid-vapour, two-phase region, the corresponding isothermal and isobaric processes coincide and remain as horizontal lines. This indicates that, during the phase change process, both temperature and pressure remain constant, i.e., [latex]T=T_{sat}[/latex] and [latex]P=P_{sat}[/latex].

2.3.3 The saturated liquid-vapour two-phase region
For a saturated liquid-vapour, two-phase mixture, we define quality x to denote the mass fraction of the saturated vapour in the mixture.
where
[latex]m_g[/latex]: mass of the saturated vapour, in kg or g
[latex]m_{mix}[/latex]: mass of the saturated liquid-vapour mixture, in kg or g
[latex]x[/latex]: quality of the saturated liquid-vapour mixture, dimensionless
With the concept of quality, we can calculate the specific volume, specific internal energy, specific enthalpy, and specific entropy for a saturated liquid-vapour, two-phase mixture by using the following equations.
[latex]\begin{align*} v &= v_f+x\left(v_g-v_f\right)=\left(1-\ x\right)v_f+xv_g \\ u &= u_f+x(u_g-u_f)=(1-\ x)u_f+xu_g \\ h &= h_f+x(h_g-h_f)=(1-\ x)h_f+xh_g \\ s &= s_f+x(s_g-s_f)=(1-\ x)s_f+xs_g \end{align*}[/latex]
where
[latex]v[/latex], [latex]v_f[/latex], and [latex]v_g[/latex]: specific volumes of the two-phase mixture, saturated liquid, and saturated vapour, respectively, in m3/kg
[latex]u[/latex], [latex]u_f[/latex], and [latex]u_g[/latex]: specific internal energies of the two-phase mixture, saturated liquid, and saturated vapour, respectively, in kJ/kg
[latex]h[/latex], [latex]h_f[/latex], and [latex]h_g[/latex]: specific enthalpies of the two-phase mixture, saturated liquid, and saturated vapour, respectively, in kJ/kg
[latex]s[/latex], [latex]s_f[/latex], and [latex]s_g[/latex]: specific entropies of the two-phase mixture, saturated liquid, and saturated vapour, respectively, in kJ/kgK
Practice problems
Media Attributions
- P-v-T phase diagram © Д.Ильин: vectorization is licensed under a CC0 (Creative Commons Zero) license
- P-T diagram © Xia Liao, Haichen Zhang, and Ting He is licensed under a CC BY (Attribution) license
- P-T Diagram for CO2 © Rifleman_82 is licensed under a CC0 (Creative Commons Zero) license
- P-T diagram for CO2 (example 1 solution) © Rifleman_82 is licensed under a CC0 (Creative Commons Zero) license
- T-v diagram © Olivier Cleynen is licensed under a CC0 (Creative Commons Zero) license
- P-v diagram © Olivier Cleynen is licensed under a CC0 (Creative Commons Zero) license
Phase diagram is a graphical representation of a substance's state (solid, liquid or vapour) under different conditions of temperature and pressure.
Single phase refers to the solid, liquid or vapour (or gaseous) phase that a substance exists at a certain condition.
The vapourization line refers to the curve that represents the transition between the liquid and vapour phases of a substance in a phase diagram.
Fusion line is a curve that represents the transition between the solid and liquid phases of a substance.
The sublimation line is the curve that represents the transition between the solid and vapour phases of a substance in a phase diagram.
The triple point refers to a unique state of a substance, at which the three phases, solid, liquid and vapour, coexist in equilibrium.
