Additional Accessibility Guides
Excel

Microsoft Office includes built-in tools to assist you in making accessible documents. This chapter includes best practices and instructions to create accessible Excel spreadsheets.
On this page:
Document Properties
The document title is announced to assistive technology and is much more pleasant and informative than the file name (but allows you to retain your file naming conventions). Other fields are useful but not required.
Document Title
To add a document title:
- Navigate to File > info.
- On MacOS: File > Properties > Summary tab.
- Enter a descriptive title in the Title field.
This cannot be done in Office Online.
Accessible Font
For Excel spreadsheets:
- Use sans-serif or simple serif font, size 11 or greater
- Size 9 is acceptable for foot/endnotes or captions
- For PowerPoint, use font size 18 minimum
- Use an accessible colour
- Font must have a contrast ratio of at least 4.5:1 against the background
- Left-align text
- Use built-in tools for spacing and alignment
To set font colour:
- Navigate to the Home tab.
- Select Font Colour.
- Click Automatic.
If your document has hard-to-read text contrast, the status bar will indicate Accessibility: Investigate. Go to the Review tab and click Check Accessibility button. Under Warnings the hard-to-read text will be noted with a dropdown menu to change the font color.
- Older versions of Word’s Accessibility Checker will not catch contrast issues.
- Consider checking your colours with WebAIM’s Contrast Checker if you are unsure.
Do not use colour as the only means of communication.
Visit the accessible colour chapter of this Pressbook for more information.
To set text alignment:
- Use left-aligned text for languages that read to left to right, use right align for languages that read right to left.
- Set alignment in the Paragraph tools on the Home tab.
- Avoid justified alignment as it can create excessive blocks of white space when zoomed and can create ‘rivers of white space’ which are gaps that appear to run through a paragraph due to coincidental alignment of spaces.
- Use at least 1.5 line spacing.
Spreadsheet Structure
Providing structure to spreadsheets is essential for assistive technology, but help all readers navigate your data efficiently and understand relationships between topics.
Styles (Styles group > Headings and Titles) in Excel have no semantic meaning like they do in Word, they are only decorative. Feel free to use styles, but also include textual cues to indicate meaning and importance.
Excel structure best practices:
- Include white space around the text in the template, so it’s easier to read.
- Ensure appropriate row height: Home > Format > Row Height.
- Ensure appropriate column width: Home > Format > Column Width.
- Use accessible colour contrast.
- Use 12 point or larger text (Home > Font Size).
- Include worksheet names and table titles.
- Right-click on sheet and select Rename.
- Give each sheet a unique, meaningful title.
Microsoft guide to finding accessible templates for Office products.
Floating elements such as charts, graphs, or images are read by assistive technology in the order the element was added to the sheet. However, the reading order can be amended:
- Navigate to Home.
- Select Find and Select.
- Choose Selection Pane.
- The reading order is from the bottom of the list to the top.
- Click and drag items in the Selection Pane to the correct order.
- Moving items in the Selection Pane does not change the visual layout of items on the sheet.
Sheet Names
Each spreadsheet appears as a tab within an Excel workbook. The default name is Sheet 1. Provide sheets with descriptive names to aid navigation and help readers draw connections between information. To change a sheet’s name:
- Right-click the sheet’s tab.
- Select Rename.
- Type a descriptive and unique name that describes the sheet’s content.
Alternative Text
Assistive technologies employ alternative text (alt text) attached to images to inform users of the context and purpose of images and visual elements. Alt text is a text alternative to non-text content to ensure all users can access information.
When including images in Excel:
- Right-click the object.
- Select Edit Alt Text…
- Enter a concise text-equivalent of the image or select Mark as decorative.
However, when adding a chart or graph to Excel:
- Right-click the object.
- Select Edit Alt Text…
- Enter a broad description of the chart or graph and make reference to the equivalent tabular data.
- Include the data table immediately following.
Review this Pressbooks’ chapter on Alternative Text for more information.
Include table data for charts.
Ensure embedded media has text equivalents. Videos must have closed captions and audio must have a transcript.
Images and Graphics
Apart from adding effective alt text to images, there are a few additional considerations for visual elements in Office documents.
To add a chart in Excel:
- Select data, go to Insert and select chart type desired.
- Add a descriptive, unique Chart title.
- Select chart, go to Design > Add Chart Element > Axis Titles. Select Primary Horizontal or Primary Vertical and type a descriptive title for the axis.
- Select chart, go to Design > Add Chart Element > Data Labels > Select appropriate label type for clarity.
- Select horizontal or vertical axis, go to Format > Current Selection > Format Selection. From the Format Axis pane, adjust axis type, axis crosses, position, tick marks, label position, interval, and number format for maximum legibility.
- Ensure colour is not the only way to differentiate chart data. Consider using symbols or dots on line graphs or add a text legend to a bar chart, for example. Try previewing your document in greyscale (via print preview) to understand how problematic it is to rely on colour alone.
- Add a legend by navigating to Design > Add Chart Element > Legend.
- Ensure chart elements have sufficient contrast. Change chart shape or line colour by selecting the shape > Format Data Point > Fill and Line > Fill > Color > More Colors.
- Ensure font is sans serif, 12 point or larger, and has sufficient contrast (4.5:1). Home > Font, Font Size, Font Colour to adjust font.
- Ensure chart data is available in tabular form as well, preferably directly following the chart itself.
- When following this practice, Right-click the chart.
- Select Edit Alt Text…
- Mark the chart as decorative or reference location of table data.
- Learn more about creating charts and learn about different chart types in Office.
Floating elements such as charts, graphs, or images are read by assistive technology in the order the element was added to the sheet. However, the reading order can be amended:
- Navigate to Home.
- Select Find and Select.
- Choose Selection Pane.
- The reading order is from the bottom of the list to the top.
- Click and drag items in the Selection Pane to the correct order.
- Moving items in the Selection Pane does not change the visual layout of items on the sheet.
For a chart or graph, provide data in table form beside the element. If size and spacing is a concern, place the data in another sheet and provide a link near the floating element.
To link within Excel:
- Select the cell in which you wish to place the link.
- Navigate to Insert > Links group > Link or right-click the cell and select Link or select the cell and press CTRL+K (CMD+K on Mac).
- Select Place in This Document and enter the cell reference (ex. A1), ensuring you have selected the correct sheet.
- In the Text to Display field, enter descriptive text to explain the link’s purpose.
- Click Ok.
- Repeat the process to provide a link back to the object.
Read more information on links in Excel.
Hyperlinks
Create meaningful hyperlink text.
- Avoid vague instructions like “see” or “click here” or “read more”.
- Not only are those not helpful out of context, but self-describing links may help you locate your resource if the URL changes.
- Do not paste URLs as hyperlink text.
- If URLs must be included, provide self-describing hyperlink text and format URLs as normal text with no link attached.
- Use default link styling (blue, underlined text).
Tables
Tables are useful for organizing data. Properly built and formatted tables are completely accessible.
In Word and PowerPoint, navigate to:
- Insert tab.
- Table.
- Insert Table.
- Indicate number of columns and rows and press Ok.
- You can add columns and rows later.
Set a header row/column:
- Click anywhere in your table,
- Select Table > Table Design tab > click Header Row (or Header Column, if applicable) checkbox,
- Select Banded Rows or Banded Columns for a landscape document,
- Accessible tables only have one header row, one header column, or both.
Right-click on table and select Table Properties for advanced table options via the table properties dialogue.
Navigate to Table Layout, select Repeat Header Rows to repeat headers across page breaks.
In some instances it may make sense to add alt text to a table as a summary. To do so:
- Navigate to Table Properties.
- Select the Alt Text tab.
- Add a Title and a Description.
- Click Ok.
Convert Excel data into a table:
- Select the data to be included in the table.
- Insert > Table.
- Double check select cells are correct and check My table has headers.
- Select Ok.
- Select anywhere in the table, use Design > Table Name and give the table a meaningful title.
Consider putting tables on separate worksheets. If you place multiple tables on the same worksheet, leave a blank row between each table. All tables should start with a title in column A.
Use accessible table designs:
- Select the table and go to Design.
- Select the features you want (Header Row, Banded Rows, or First Column).
- A Header Row or Header Column or both are required for an accessible table.
- To show all available table styles, select More or the dropdown arrow.
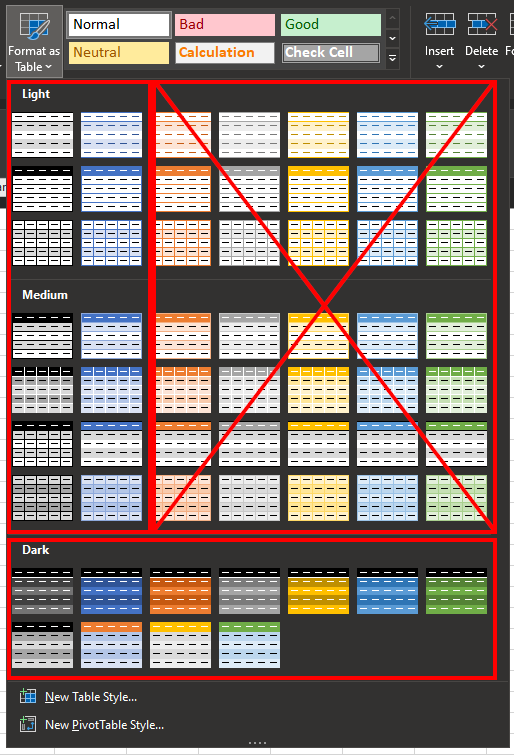
- Most accessible tables will be Medium styles with strong contrasting colors.
Best practices:
- A concise, descriptive table title helps with context and organization.
- Do not use nested, merged, split, or unnecessary blank cells.
- Ensure cells have adequate padding and margins.
- Do not use coloured cells or text alone to indicate meaning.
- Do not use tables with invisible borders to format layout.
- Office accessibility checker does not note table errors.
- Click in the top left cell, then use the Tab key to see ensure your table reading order is logical and consistent.
Additional Excel Features
Best practices:
- If you have no data to enter in cell A1, use it for a title or to indicate the number of sheets in a workbook.
- For a workbook with many sheets, the first sheet should be used a summary and index with links to other sheets.
- Avoid merged cells in tables.
- However, an acceptable practice is to add a descriptive title above a data set by merging the cells and centering the text.
- Cell A1 is the best place for a description of a sheet.
- Avoid blank cells for formatting or alignment purposes (adjust column/row width and height instead).
- A single blank row or column is allowed where appropriate. Best practice would be to include the text “No data” in blank cell.
- Ensure cell has appropriate format by number type.
- Home > Number drop down > select relevant number formatting (date, currency, time, etc.).
- Ensure appropriate decimal place from Home > Numbers group > Increase Decimal or Decrease Decimal.
- Colour, such as conditional highlighting, may be used but should be accompanied by a text equivalent indicating meaning.
- Comments are accessible and a great way to convey information or messages.
Hide unused cells:
- Select the first column cell to be hidden.
- Press Shift and CTRL (CMD on Mac) and Right Arrow key.
- Right-click and select Hide.
- The process is the same to hide unused rows, by selecting the first row to be hidden.
- Press Shift and CTRL (CMD on Mac) and Down Arrow key.
- Right-click and select Hide.
However, avoid hiding cells in the middle of data. If you must, add a comment indicating so. Excel comments are accessible and a great way to communicate with readers.
An additional method would be to include an “End of Table” message after the last row of data. The text can be in white as this is only a hint to assistive technologies that the table is complete.
Multiple data sets:
- Multiple sets of data should be split into separate sheets
- Sheet names should be meaningful and unique
- Each sheet should follow the same accessible formatting
Within a worksheet, you may group data for easier navigation. Select the data you want include and select Formulas > Define Name. Enter a descriptive name and double check the selected cell range, then click Ok. This allows users to press CTRL + G to quickly jump to different groups of data.
Cell padding:
Ensure appropriate cell padding by adjusting column width and row height.
- Right-click on row or column label.
- Select Column Width… and/or Row Height… to adjust.
- Or in Home > Cells group > Format dropdown.
- Select Autofit Row Height and/or Autofit Column Width.
- Text should not overflow cells.
- Adjust column width or use text wrapping: Home > Wrap Text button.
Named regions and header names:
Using the Excel Names feature, it is possible to name a range of cells in such a way that header cells are spoken along with the value of the cell. This allows a person using a screen reader to understand the structure of a table more clearly. This is only necessary for more complex or lengthy sets of data.
The following formatting and object types are not communicated to assistive technology or present significant barriers to some users:
- Strikethrough
- Highlighting
- Dropcap
- Word Art, Smart Art, text effects
- Ungrouped related shapes
- Watermarks
- Symbols, except for the following safe characters:
When converting data to a table, keep in mind the contrast of the default styles. Only the White, Light Blue, and Blue styles in the Light and Medium categories have sufficient contrast between cell shading and font colour. All of the styles in the Dark category have sufficient contrast
Accessibility Checker
Use Office products’ built-in accessibility checker to check for common issues. Note, these tools may not catch all possible accessibility issues.
The Microsoft Accessibility Checker report can be used to find common errors like missing image ALT text, merged cells and other issues in an Excel document. Select Review > Check Accessibility. The accessibility pane will show errors, warnings, solutions, and tips.
In the Accessibility pane select Keep accessibility checker running while I work checkbox to see a realtime accessibility message in the bottom status bar. Click Accessibility: Investigate at anytime to open the Accessibility pane.
Like any automated tool, Office’s accessibility checker will not catch any and all accessibility issues. Here is a summary of what it does look for and how well it catches those issues:
| Element checked | Reliability of checker |
|---|---|
| Structure and use of heading styles | Poor.
Will show if there are no headings on a long document but doesn’t flag issues on shorter documents. A single heading is enough to pass the checker even though the document remains inaccessible. It cannot test the logic of the heading structure. |
| Colour | Moderate.
Can find poor colour contrast but cannot tell if colour has been used as a sole indicator for information. |
| Use of images | Moderate.
Will find images that have neither Alt text, nor are marked as decorative as well as those where the Alt text is just the file name. But it cannot identify whether the Alt text is appropriate or even meaningful. It will find images that are not in line with the text. In-line images may not be as aesthetically pleasing but they are easier for screen readers to find. |
| Links | Poor.
It does not check for link text. |
| Plain English | Poor.
It does not check for this, but you can check yourself by switching on the readability stats as described in the section on Understandable Content. |
| Tables | Fair.
It finds whether the table has the Header row marked. It may warn if tables have split or merged cells. |
| Miscellaneous | Poor.
Does not check text justification, videos for captions, or form labels. |
Read more about checking for accessibility issues with the Office Accessibility Checker and learn about Office Accessibility Checker rules and messages.
Sharing
Best practice is to share material in advance of presentation or class.
-
- This allows users to check for barriers beforehand
- All users can take additional, in-depth notes and understand terminology and names with greater comprehension
- Users that experience barriers can zoom in or adjust the documents to their viewing preferences
Excel documents have various options for protecting your Excel workbook, sheet, or part of your spreadsheet. Choose the appropriate level of protection.
Export to PDF
Excel documents can be exported to PDF, however the amount of time and expertise required to create an accessible PDF of an Excel document means all other avenues should be pursued first.
Best practice is to share the Excel file directly. You can protect an Excel file to prevent changes.
Microsoft outlines best practices to make documents accessible.
Make your excel Excel documents accessible.
Contact assistivetech@langara.ca for further information or assistance.
Microsoft videos on accessible Excel spreadsheets.
General Microsoft documentation on accessible Excel spreadsheets.
Learn about creating charts using Excel.
WebAIM’s guide to Excel is a useful guide.
Use this online tool to convert Excel tables to HTML.
- This table is adapted from work originally developed by AHEAD and Alistair McNaught and is made available under a CC BY-NC-SA creative commons license. ↵
Colour contrast is the difference in saturation, brightness, and pigment of different elements relative to one another. A contrast ratio of at least 4.5:1 between text and background is required by common accessibility standards.
The use of code (HTML attributes, PDF tags, XML, etc.) to distinguish content by meaning, not appearance. For example, a <h1> heading tag creates both a visual and coded navigation waypoint whereas increasing the font size and bolding simply makes regular text appear larger.
Alternative text is a text equivalent of graphics in a document or webpage. Alternative text is coded to be hidden visually, but read to a screen reader user.
Information presented in a grid format of rows and columns, generally to show a relationship between sets of data
A text equivalent of audio content in a video, displayed synchronously. Closed captions are toggled on or off by viewers, as opposed to open captions that are burned into the video and always displayed.
Transcription is the process of converting audio into written text. A transcript is a written record of all audio in media. Captions are synced to the content.
Linked text to another document or part of document that the user can follow by selecting. Effective hyperlink text should make sense independent of the content around it.
Automated tools built-in to many platforms that check for common accessibility issues. Are not to be considered a guarantee of accessibility.
