Chapter 2 What Data Looks Like and Summarizing Data
2.3.4 What Frequency Tables Really Look Like
Before we move on to the last section of this chapter, take a look at what frequency tables of real variables look like, using SPSS. All three variables in the tables below come from the General Social Survey 2016 (or GSS 2016) (Statistics Canada 2018) which I’ll formally introduce in Chapter XX.
Table 2.5 Frequency Table for Sex of Respondent (GSS 2016)
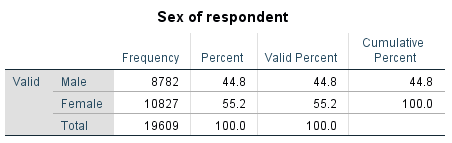
Table 2.5 shows a nominal variable, sex of respondent, with no missing data (thus both Percent and Valid Percent columns contain the same information).
Unlike it, Table 2.6 below shows an ordinal variable, workplace size, where almost half (47.4 percent) of the respondents didn’t supply a valid response. In cases like this one it’s imperative you only use the data as presented in the Valid Percent column, and not the Percent one.
Table 2.6 Frequency Table for Workplace Size (GSS 2016)
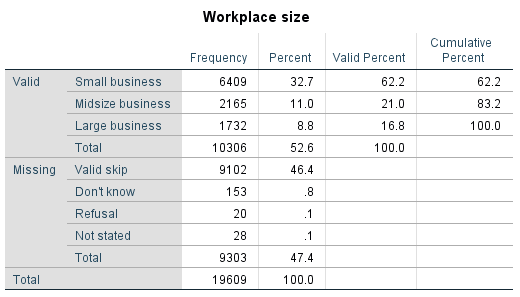
Table 2.7 below presents a ratio variable, purchasing grocery store takeout dishes in the past month, with relatively moderate number of data points missing (9.3 percent). Again, Valid Percent is the column at which you should be looking. As well, note that the first (blue) column lists the categories (or values) of the variable as supplied by the respondents, as it normally does. Since these consist of actual numbers, you might be tempted to see them as some sort of consecutive listing, and that would be wrong. If you look carefully, you’ll see that numbers like 11, 19, 22, 23, etc. are not listed there. This is not because they are somehow “missing” but because no respondent provided such a response.
Table 2.7 Frequency Table for Purchasing Grocery Store Takeout Dishes (GSS 2016)
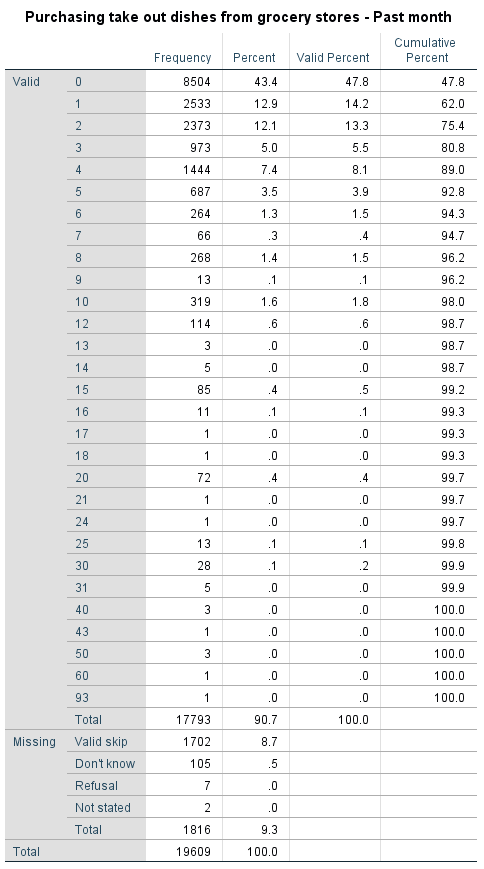
Finally, note that although the Cumulative Percent column is less useful when we are dealing with nominal variables, it’s quite handy to have when working with ordinal and especially with interval/ratio variables. Thus we can easily state that 83.2 percent of respondents work at a small or a midsize workplace and that almost 90 percent of respondents have purchased no more than 4 grocery takeout dishes in the past month.
SPSS Tip 2.1: How to Request Frequency Tables
From the Main Menu:
- Click Analyze, then Descriptive statistics, and then Frequencies;
- Select variable/s from the left-side of the window and use the arrow button to move the variable/s to the right side;
- Click OK.
- The Output window will display the selected variable/s frequency table/s.