Chapter 6 Sampling, the Basis of Inference
While describing variables is all nice and good — and useful — statistics would be rather limited if we only used it for that. In reality, descriptive statistics, while popular (consider sports statistics, for example), is only a relatively tiny part of all that statistics has to offer. The true power of statistics lies in granting us a superpower: the ability to infer — to know (and even to predict), within reason, things we cannot otherwise possibly know through observation alone. This part of statistics is called inferential statistics, and it’s based on probability theory, a branch of mathematics of which you had a small taste in Chapter 5.
How do we know that life expectancy at birth is 82.3 years in Canada and 78.7 years in the United States but only 51.8 years in Siera Leone (REFERENCE World Bank, 2016)? How can we predict, with reasonable certainty, the outcome of elections? How can we predict how many people will die of a particular cause in a specific country in a year? How do we know if most Canadians approve of immigration? Or what percentage of the Canadian work force is employed part-time? How do we predict how many people will be added to the world population in any year, or how many people will the world have in 2100?
Figure 6.1 World Population Projection 2100
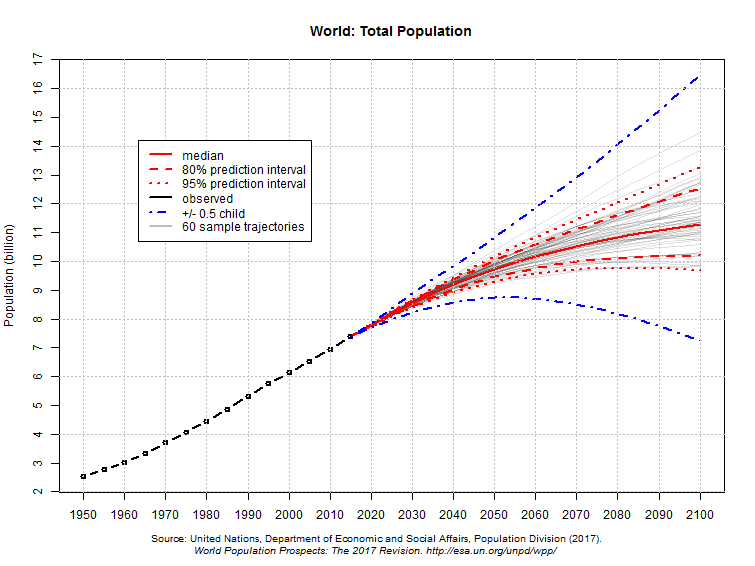
[https://population.un.org/wpp/Graphs/Probabilistic/POP/TOT/]
Fig. 6.1 above might seem complicated to you now, but soon enough you would be able to read it, as we will be covering all the concepts listed in the legend.[1] We can do all that, and more, courtesy of inferential statistics.
While I’ll leave the demography examples and projections about the future aside (as the scope of this text is quite more modest), let’s take an example from closer to home and, say, talk about the attitudes to immigration in Canada. How do we know if Canadians approve of immigration? What do we mean when we even say “Canadians”? If we say “Canadians approve of immigration,” does that mean all Canadians do? If not, how many Canadians approve and how many disapprove?
To answer these questions we need to introduce more vocabulary than we have been using so far; vocabulary that is generally used in all sorts of research, both quantitative and qualitative, and not pertaining to statistics per se, though very relevant to it. In short, we have to start differentiating between a sample and a population (a term that has a more general meaning than the way we use it in everyday life), and we need to talk about sampling.
Following that, I’ll explain the concept of randomness in greater detail, which, coupled with what you now know about probability, will help us get to the sampling distribution. With that and the Central Limit Theorem, we’ll be ready. Then, and only then, we’ll be able to answer questions like How do we know if Canadians approve of immigration? along with any other question we might have about things/entities about which we cannot directly obtain information.
But I am getting too far ahead and too fast in my overview which, as any abstract talk, easily gets confusing. Let’s take it slowly from the beginning: samples and populations in the next section, and build from there. Be forewarned, however: what follows is indeed quite a bit theoretical and abstract, I’m afraid. (Yes, more than the last chapter, sorry.) Believe me, I wouldn’t do this to you if it weren’t necessary.
- As it's somewhat difficult to see it on the graph, the answer to the last question -- what is the projected population of the world for 2100? -- is 11.2 bln. people (REFERENCE UN Population Division, 2017). ↵