Marine mammals and fisheries
What are the ecosystem-level impacts and economic consequences of prioritizing marine mammal recovery versus fisheries yields, and how can management strategies be optimized to balance these competing objectives?
This overarching question can be explored using EwE to model different scenarios and evaluate the trade-offs. The question is particularly relevant given the recovery of many marine mammal populations n many parts of the world following protection after exploitation or culling, combined with the ongoing challenge of managing fisheries in complex ecosystems. It also addresses a key aspect of ecosystem-based management: balancing multiple, sometimes conflicting, objectives within the same ecosystem.
Model choices
For evaluation of impact of marine mammal rebuilding, Anchovy Bay has (only) an unspecified whale group and a seal group. In the basic model configuration (representing 1970), whales were slowly rebuilding while seals were in decline due to culling, which, however, stopped in 1972. We can use the model to explore what would happen if we fit the model to time series up to the present (to let whales and seals rebuild), and then explore what impact these marine mammals have in the present situation. You can download a fitted version of the Anchovy Bay model from this link.
To evaluate the impact of marine mammals, load the model. You can simultaneously load the one scenario and time series file in the model, from the top menu as shown in Figure 1. Just click 1: anchovybay, i.e. the time series, (which also loads the Scene 1 scenario).
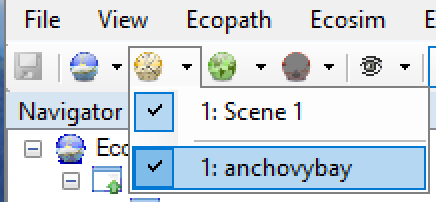
Figure 1. Loading Ecosim scenario and time series from the top menu.
Then run the model (Ecosim > Output > Run Ecosim > Run) and check the predation impacts of the marine mammals in the group plots (Ecosim > Output > Group plots > Predators ranked). Next, let’s look forward, extend the duration of the simulation to 61 years at Ecosim > Input > Ecosim parameters > Duration of simulation (years). Now extract results for the “with marine mammals” run at Ecosim > Output > Ecosim results, for Fleets, copy the columns with Fleet name, Catch (end), and Value (end) to a spreadsheet. From Group landed by, copy the Group name, Biomass (end), and Catch (end) columns.
Now, sorry, let’s eradicate the marine mammals. At Ecosim > Input > Fishing mortality, select the 1: Whales icon at the bottom part, then sketch a high fishing mortality, e.g., 0.5 year-1 from 2012 onwards. Do the same for 2: Seals, where you may have to sketch several times to get the Y-axis to go high enough. Run the model and extract the same results for this “without marine mammals” run as you did for the “with marine mammals” run. Compare the two run, e.g, by calculating the ratio of “without marine mammals” to “with marine mammals”.
But while there’s no discussion that Anchovy Bay is great, remember, models are not like religion – you can have more than one (and you shouldn’t believe them). Here, the results from Anchovy Bay – which are quite drastic – begs the question, are they realistic? To evaluate that, it would be pertinent to use a model that actually was designed to address the overarching policy question in this chapter.
For this, we can turn to a model published by Woodstock et al. “Marine Mammal and Seabird Population Changes Have Contrasting but Limited Impacts on Fisheries Catches in the North Sea”.[1] You can download the database from this GitHub link.[2] There are four EwE databases in the download, and for our testing we used the one named “Mean Mammals_balanced.EwEmdb”, which uses average numbers of estimated marine mammals and birds. We will refer to that model version in the following, but feel free to use any of the four model versions in the download.
As an option, you could base your analysis on the following scenarios.
1. Best estimate of ecosystem history
This is the Woodstock et al. (2025) scenario, which forces the marine bird and mammal biomass over time and otherwise fits the ecosystems groups to fisheries data to model the ecosystem history. Woodstock et al. compared competitive interactions between fisheries and marine mammals and birds over time by evaluating their relative mortality contributions over time.
Download the file from Github, open the Mean Mammals_balanced.ewemdb model, and similar to in Figure 1, load the NS_mean Ecosim scenario and the Mean_Time Series time series. Run the model, Ecosim > Output > Run model > Run. Extract the fleet and biomass results for the last year (“end”) from Ecosim > Output > Ecosim results and copy-paste to a spreadsheet.
2. No rebuilding of marine mammals and birds: retrospective
Load the Ecosim scenario as above, but do not load the time series. If you check Ecosim > Output > Ecosim group plots, the marine mammals and birds should now not be increasing as in the original run. Similar to above, extract the results and copy to your spreadsheet.
3. No marine mammals or birds: retrospective
This more drastic (and hypothetical) simulation asking what would the situation be for the ecosystem and for fisheries if there were no marine mammals and birds in the (central and southern) North Sea?
We will evaluate this by removing marine mammals and birds from the system through an imaginary fishery. For this, introduce a new fleet, Fishery > Fleets > Define fleets, and Edit > Insert to add a new fleet. Move the new fleet to the end #13 position, and call it, e.g., “Culling”. Go to Ecopath > Input > Fishery > Landings and enter a landing of 0.01 t km-2 year-1 for each of the marine mammals and birds (the first 9 groups).
If you add a fleet with this level of catches, you’re bound to unbalance the model. To circumvent that, we can make a slight modification. Remember the 2nd Ecopath Master Equation, which says,
Production = predation mortality + fishing mortality + biomass accumulation + net migration + other mortality,
where we have just entered large fishing mortalities for the marine mammal and birds. We can balance the equation by adding a same-sized negative biomass accumulation for each group. In essence, we’re saying that if there were large catches as we’ve entered, they would have resulted in the biomasses of the same groups being reduced with the corresponding amount. When going to Ecosim, we can then set the effort for the Culling fleet to 0 until we want the fleet to kick in.[3]
To implement this, go to Ecopath > Input > Other production and set Biomass accumulation (t km-2 year-1) to -0.01 for each of the marine mammal and birds groups. Also go to Ecosim > Input > Fishing effort and click Fleet 13, Culling and Set to 0. Run Ecosim again, and there should be no changes. You can now click Set to value … and enter 1 to reset the effort to unity. Run again, and extract the fleet and biomass results for the last year from Ecosim > Output > Ecosim results and cut-paste to a spreadsheet.
4-5. Rebuilding vs. culling: forward-looking
An alternative would be to take the current situation as the baseline and then project forward in time, thus focusing on the potential current trade-offs between fisheries and marine mammals and birds. To set this up, locate and open the Mean_Time Series.csv file in the GitHub timeseries directory. Make the following changes,
Scenario 4: Rebuilding projected
- Column A: Extend the time series with 20 years to 2034
- Column B-N: these are fishing mortalities by functional group and needs to be extended with constant fishing pressure. So just copy the values to all years up to 2034
- Columns AN-AV: these are forced biomasses and should be copied to all years to 2034
Save the file as new time series file, e.g., Mean_Time Series extended.csv. Import the time series to Ecosim (Ecosim > Input > Time series > Import then browse to find the file). Run Ecosim, extract results for the last year as earlier.
Scenario 5: Culling projected
Load the Mean_Time Series extended.csv and save it, e.g., as Mean_Time Series culling.csv. Make the following changes
- Columns AN-AV: Delete the forced biomasses for years 2015-2034
- Add a new column AW with row 1, Name = Culling fleet, row 2, Pool Code = 13 (for Culling fleet), and row 3, Type = 3 (for fishing effort). Set the effort for 1990-2014 to 0, and for 2015-2034 to 1.
Save the csv file, import it to Ecosim as explained above, run Ecosim, and extract results for the last year.
Potential policy questions
The models and scenarios described above can be used to evaluate a suite of policy questions, for instance,
- Ecological impacts: How does increasing marine mammal populations affect fish stocks, both target and non-target species?
- Economic analysis: What are the potential economic losses to fisheries versus gains from increased marine mammal-based tourism?
- Time scales: How do short-term versus long-term outcomes differ when prioritizing either marine mammals or fisheries?
- Trophic cascades: Are there unexpected ecosystem impacts to marine mammal recovery that affect fisheries indirectly?
- Management strategies: Are there combinations of marine protected areas, fishing regulations, and other management tools that can help achieve a balance?
- Species-specific effects: How do the impacts differ depending on which marine mammal species are recovering (e.g., seals vs. whales)?
- Spatial considerations: Are there ways to spatially manage ecosystems to reduce conflict between marine mammals and fisheries?
Ecological impacts: How does increasing marine mammal populations affect fish stocks, both target and non-target species?
This question raise parallels to the forage fish management policy question. Does marine mammals and birds compete efficiently with fisheries? For this, you could evaluate how marine mammals and bird predation mortality over time compares to fishing mortality, similar to what Woodstock et al. (2025) did.
Also, compare the development over time for the various groups using the retrospective scenarios 1 through 3, or compare the forward scenarios 4 and 5.
Economic analysis: What are the potential economic losses to fisheries versus gains from increased marine mammal-based tourism?
The first step here is to evaluate income from fisheries. For the Anchovy Bay model, there are off vessel prices included, allowing a direct evaluation of revenue from the fishing fleets. For the North Sea model, the off vessel prices have not been included, so they will need to be obtained and entered, be it from European statistics or Sea Around Us.
The next step is to value the whale watching industry’s income. A simple way of doing that is to assume a simple relationship between the biomass of marine mammals and birds and the income from whale watching. The relationship can be species-dependent, and can be entered on Ecopath > Input > Fishery > Non-market price. What parameters to use: look for evaluations of whale watching revenue and relate that to the biomasses of marine mammals and birds.
A major shortcoming with this routine is the assumption about proportionality between biomass and whale watching revenue. That relationship is more likely to be sigmoid, so that it takes a certain biomass threshold before it pays-off to start a whale watching industry, and once there are more-than-enough of a species, adding more won’t provide more revenue. Diversity would matter too, providing better insurance over the year for sightings and getting more to go on repeated trips to see different species.
We have not incorporated such a more complex routine in EwE because there’s no direct[4] feedback to the ecosystem from whale watching, (and because we haven’t had an opportunity to implement it). It is, however, straightforward to develop such an evaluation by saving time series of biomasses and doing the analysis outside EwE.
Time scales: How do short-term versus long-term outcomes differ when prioritizing either marine mammals or fisheries?
Time trends in marine ecosystems after policy changes are closely related to turnover rates (P/B), hence regulation will likely have much quicker impact on fishes and birds than on marine mammals. You can evaluate this on any of the scenarios by imposing a policy change and evaluate time trends in the following years.
Trophic cascades: Are there unexpected ecosystem impacts to marine mammal recovery that affect fisheries indirectly?
We are often quite good at evaluation direct impacts of exploitation or predator-prey relationships, but less so when it comes to indirect impacts, which can be surprising.[5] We can, however, examine Ecosim output from both retrospective and projection analysis to look for unexpected impacts (as models are better at this than we are). Also, one might get ideas of where to look for unexpected impacts by carefully examining the Ecopath Mixed Trophic Impacts analysis[6] (Ecopath > Output > Tools > Network analysis > Mixed trophic impacts).
Management strategies: Are there combinations of marine protected areas, fishing regulations, and other management tools that can help achieve a balance?
Calls for a spatially explicit model. Can be addressed using a spatial version of the Anchovy Bay model, but will for management call for strong empirical information to become credible.
Species-specific effects: How do the impacts differ depending on which marine mammal species are recovering (e.g., seals vs. whales)?
Can also be explored with Anchovy Bay (or any other model with more than one functional group with marine mammals. Keep fishing pressure high on one group, and remove it from the other(s).
Spatial considerations: Are there ways to spatially manage ecosystems to reduce conflict between marine mammals and fisheries?
Calls for a spatially explicit model with good information about the species distributions.
- Woodstock, M.S., Kiszka, J.J., Evans, P.G.H., Waggitt, J.J., Zhang, Y., 2025. Marine mammal and seabird population changes have contrasting but limited impacts on fisheries catches in the North Sea. Can. J. Fish. Aquat. Sci. 82, 1–14. https://doi.org/10.1139/cjfas-2025-0056 ↵
- Woodstock, Matthew (2025). Github repository for the paper: "Marine Mammal and Seabird Population Changes Have Contrasting but Limited Impacts on Fisheries Catches in the North Sea". figshare. Online resource. https://doi.org/10.6084/m9.figshare.30490466.v1 ↵
- We often use this trick to consider fleets that are introduced in a system after the Ecopath base year. ↵
- Indirect feedback such as e.g., whale watching impacting killer whale behaviour can be evaluated with mediation effects. ↵
- e.g., Pine, W.E., Martell, S.J.D., Walters, C.J., Kitchell, J.F., 2009. Counterintuitive Responses of Fish Populations to Management Actions. Fisheries 34, 165–180. https://doi.org/10.1577/1548-8446-34.4.165 ↵
- Libralato, S., Christensen, V., Pauly, D., 2006. A method for identifying keystone species in food web models. Ecological Modelling 195: 153–171. doi:10.1016/j.ecolmodel.2005.11.029 ↵
