56 Spatial planning: MSP Challenge
Jeroen Steenbeek
Marine or Maritime Spatial Planning (MSP) has developed as a tool to evaluate how the many and often conflicting uses of the marine environment may best be designed. However, management of marine space, at various scales, across a wide range of socioeconomic sectors and national and transnational boundaries, under the influence of natural processes and climate change, with their associated uncertainty, is a daunting task for which managers and planners are often ill-prepared[1].
As a reaction to this challenge, the Marine Spatial Planning (MSP) Challenge simulation platform was developed to integrate best available geographic, maritime, and marine data provided by many proprietary institutions with science-based simulation models for shipping, energy, and ecology. The data and models are linked together in a Unity game-engine based interactive platform[2]. This simulation platform allows anyone, experts as well as nonexperts, to operate it for planning support such as stakeholder engagement, codesign, interactive scenario development, professional learning, and student education.
The MSP Challenge simulation platform has been used for many interactive sessions with planners, stakeholders, and students in various parts of the world. In an interactive session or “game”, participants take up the role of planner (or stakeholder) in one of the countries in a sea basin. As planners, users have an overview of the entire sea region and can review many different data layers to make an assessment of the current status. They design management plans for future uses of space in their exclusive economic zone over a period of several decades, and need to negotiate with neighbouring planners to have their plans approved. They can also consult other countries or develop and implement transboundary plans regarding a wide range of planning activities, including shipping routes, wind farms and power grids, and marine protected areas (MPAs). In a typical MSP session, planning phases alternate with simulation phases where the consequences of planning decisions for energy, shipping, and the marine environment are simulated and visualized as indicators and heat maps at the sea basin level. Digital game technology makes it fun and easy to draw and modify plans, run the simulations, and interact with others. Elements of gameplay such as challenges and objectives, a story line, role-play, and performance feedback can be used to facilitate interactions among the participants in a session.
The MSP Challenge simulation platform and the EwE approach have now been integrated to translate the gradual implementation of spatial plans into changes in environmental conditions and fisheries regulations (henceforth called pressures). These pressures were incorporated into the calculations of Ecospace to affect the state of the marine ecosystem components over time and space. Aggregated, spatially explicit Ecospace predictions (henceforth called outcomes) were sent back to the MSP Challenge to disseminate the state of the ecosystem components to session participants.
Both the MSP Challenge and the EwE approach are data-driven software systems. Within the bounds of a fixed set of equations and behaviours embedded within the software, these systems are parameterized to represent any ecosystem with its specific challenges and dynamics. We have connected the MSP Challenge and EwE software systems through a few new software components as shown in Figure 1.
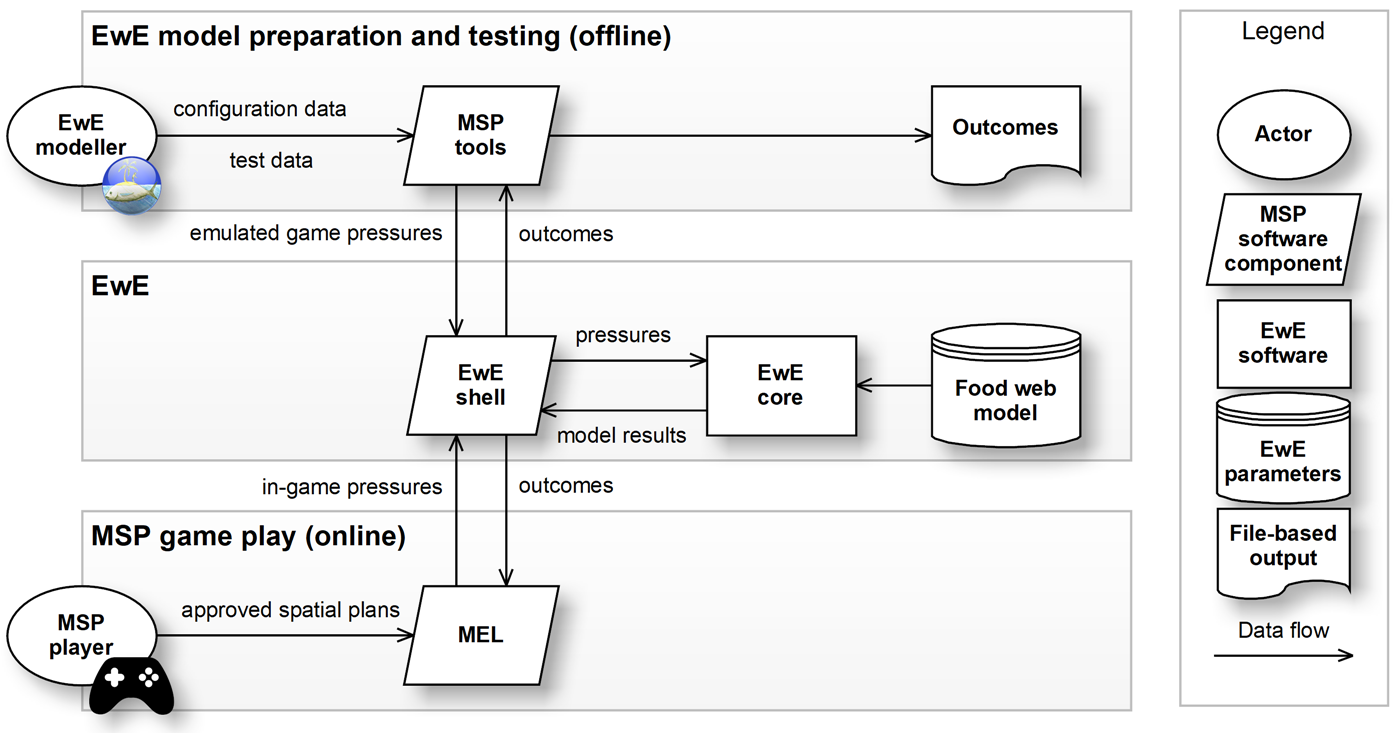
Figure 1. An overview of software components needed to connect the Ecopath with Ecosim (EwE) computational core to the marine spatial planning (MSP) challenge. EwE shell is the central software library that encapsulates the EwE modeling logic to receive MSP player-derived pressure layers and to deliver outcome layers back to the MSP software system. MSP Tools is a plug-in to the EwE desktop software that allows EwE modellers to design the connectivity between a specific MSP scenario and an EwE model, and to test the behaviour of this EwE model as if connected to the actual MSP game. MEL, the MSP-EwE Linker, is a software library that integrates EwE shell into the MSP game engine by converting MSP player actions to pressure maps for consumption by the EwE shell, and by delivering ecological outcomes to the MSP Challenge game.
Pressures: impacting the ecological model
Several distinct pressure categories were defined,
- Noise is the spatial distribution and intensity of low frequency noise resulting from shipping, construction, etc. The noise map layer acts as an environmental driver layer in the Ecospace habitat capacity model and affects per-cell foraging suitability for functional groups sensitive to low-frequency noise.
- Surface disturbance and bottom disturbance are the spatial distribution and intensity of physical disturbance at the surface and the bottom, respectively. This pressure includes the presence of temporary and transient structures and vehicles, turbidity due to anthropogenic activity, some forms of pollution, etc. The disturbance map layers act as environmental driver layers in Ecospace and affect per-cell foraging suitability for functional groups sensitive to these disturbances.
- Artificial substrate is the spatial distribution and intensity of artificial structures that provide shelter and/or habitat to sensitive functional groups. This layer acts as an additional habitat in Ecospace to increase habitat-derived cell suitability in Ecospace.
- Protection is the spatial distribution of locations where fishing is impossible due to the presence of other activities or prohibited through fisheries restrictions. This per-fleet map layer acts as a MPA layer in Ecospace, blocking fishing effort for all sensitive fishing gears in cells where MSP activities that generate this pressure are present.
- Fishing intensity is a scalar pressure to increase or decrease the nominal amount of fishing across the game area.
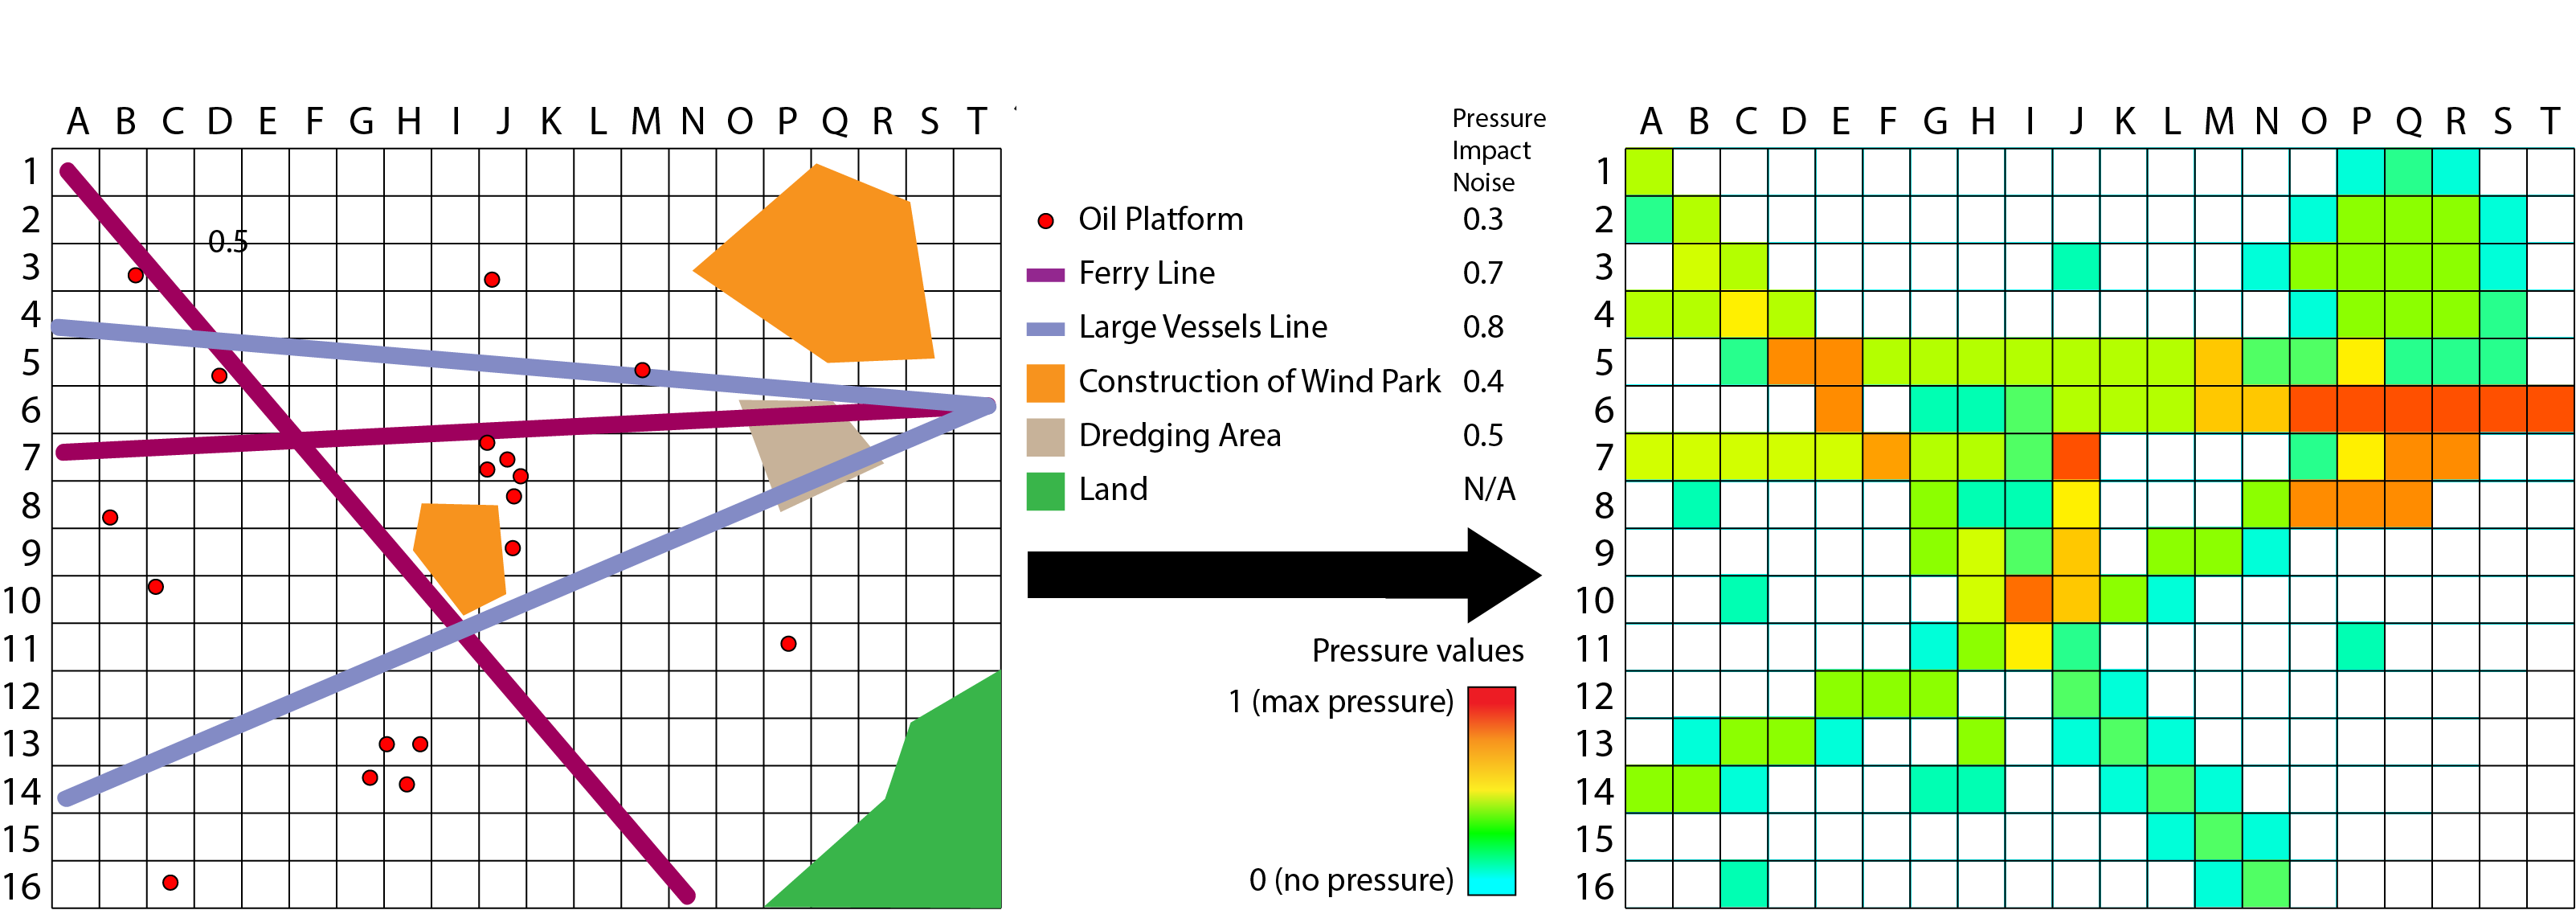 Figure 2. Schematic overview showing how spatial plans (actions), in vector format, are converted to pressure grids, in raster format. This example shows how oil platforms, ferry and shipping lines, wind park construction, and dredging contribute to the noise pressure grid via conversion factors unique to each type of action.
During simulation phases, the MSP Challenge software converts spatial plans created by players into pressure maps using an action-pressure conversion matrix, as follows (Figure 2).
- Spatial plans, which are entered as points (e.g., anchorages, oil and gas platforms) and lines (e.g., shipping routes, cables, pipelines, etc.), are spatially expanded to their area of impact using impact factors, expressed in the action-pressure conversion matrix as a ratio of Ecospace cell size. The zone width may be multiplied by the intensity of the spatial plan where applicable (e.g., shipping intensity). The zone-to-cell surface overlap is then calculated as a measure of spatially explicit pressure intensity on a value range from zero (no pressure) to one (maximum pressure).
- The cell area overlap of spatial plans, which are entered as polygons (e.g., dredging sites, marine protected areas, harbours, wind farms, etc.), is directly calculated and multiplied by the impact amount stated in the action pressure matrix and intensity of the spatial plan, where applicable.
- Total pressures from point, line, and polygon features are added per cell and range from zero (no pressure) to one (maximum pressure). Ecospace directly integrates the pressure grids into designated maps of environmental drivers, habitats, and protection, and directly incorporates the per-fleet fishing effort multiplier, to affect ecosystem dynamics.
Ecospace directly integrates the pressure grids into designated maps of environmental drivers, habitats, and protection, and directly incorporates the per-fleet fishing effort multiplier, to affect ecosystem dynamics.
Outcomes
Outcomes are spatially explicit aggregations of Ecospace predictions. The complex results of food web dynamics are condensed to provide MSP session participants with key ecological results and indicators. Outcomes can consist of four types of Ecospace predictions: group biomass, group catch, fleet effort, and biodiversity indicators.
The data in the outcome maps are reflected in the MSP software on a fixed colour gradient that represents one order of magnitude deviation from Ecopath baseline values. This relatively simple display system facilitates game participants to perceive drastic (local) changes in ecosystem functioning on a uniform scale across all outcomes.
Attribution The chapter is an extract from Steenbeek et al. 2020[3] adapted under a Creative Commons Attribution-NonCommercial 4.0 International License. Rather than citing this chapter, please cite the source.
Media Attributions
- Figure-2_EwE-desktop-tools
- Figure-3_Vector-to-raster-conversion_v2
- Mayer, I., Zhou, Q., Lo, J., Abspoel, L., Keijser, X., Olsen, E., Nixon, E., Kannen, A., 2013. Integrated, ecosystem-based Marine Spatial Planning: Design and results of a game-based, quasi-experiment. Ocean & Coastal Management 82, 7–26. https://doi.org/10.1016/j.ocecoaman.2013.04.006 ↵
- Abspoel, L., I. Mayer, X. Keijser, H. Warmelink, R. Fairgrieve, M. Ripken, A. Abramic, A. Kannen, R. Cormier, and S. Kidd. 2021. Communicating maritime spatial planning: the MSP Challenge approach. Marine Policy 132. https://doi. org/10.1016/j.marpol.2019.02.057 ↵
- Steenbeek, J., G. Romagnoni, J. W. Bentley, J. J. Heymans, N. Serpetti, M. Gonçalves, C. Santos, H. Warmelink, I. Mayer, X. Keijser, R. Fairgrieve, and L. Abspoel. 2020. Combining ecosystem modeling with serious gaming in support of transboundary maritime spatial planning. Ecology and Society 25(2):21. https://doi.org/10.5751/ES-11580-250221 ↵
