10 Mass balance
Mass balance is performed using a number of algorithms and a routine for matrix inversion, see the energy balance of a box for a description of these. Once the program has estimated the missing parameters, the system balances the input and output of each group, using respiration for adjustments. The relationship used is
Master Equation 1:
[latex]Consumption = production + respiration + unassimilated \ part\tag{1}[/latex]
where, consumption is the total consumption for a group, i.e., biomass · (consumption / biomass). Respiration is the part of the consumption that is not used for production or recycled as egestion or excretion. Respiration is nonusable currency, i.e., it cannot be used by the other groups in the system. Autotrophs with Q/B = 0[1] and detritus have zero respiration. Unassimilated food is an input parameter expressing the fraction of food that is not assimilated, (i.e., is egested or excreted). For models whose currency is energy, the default is 0.20, i.e. 20% of consumption for all groups, though this is most applicable for finfish groups following Winberg[2]. The non-assimilated food is directed to the detritus.
If the model currency is a nutrient, there is no respiration. Instead, the model is balanced such that the non- assimilated food equals the difference between consumption and production.
To illustrate some of the basic rules and options for mass balance, see Figure 1.
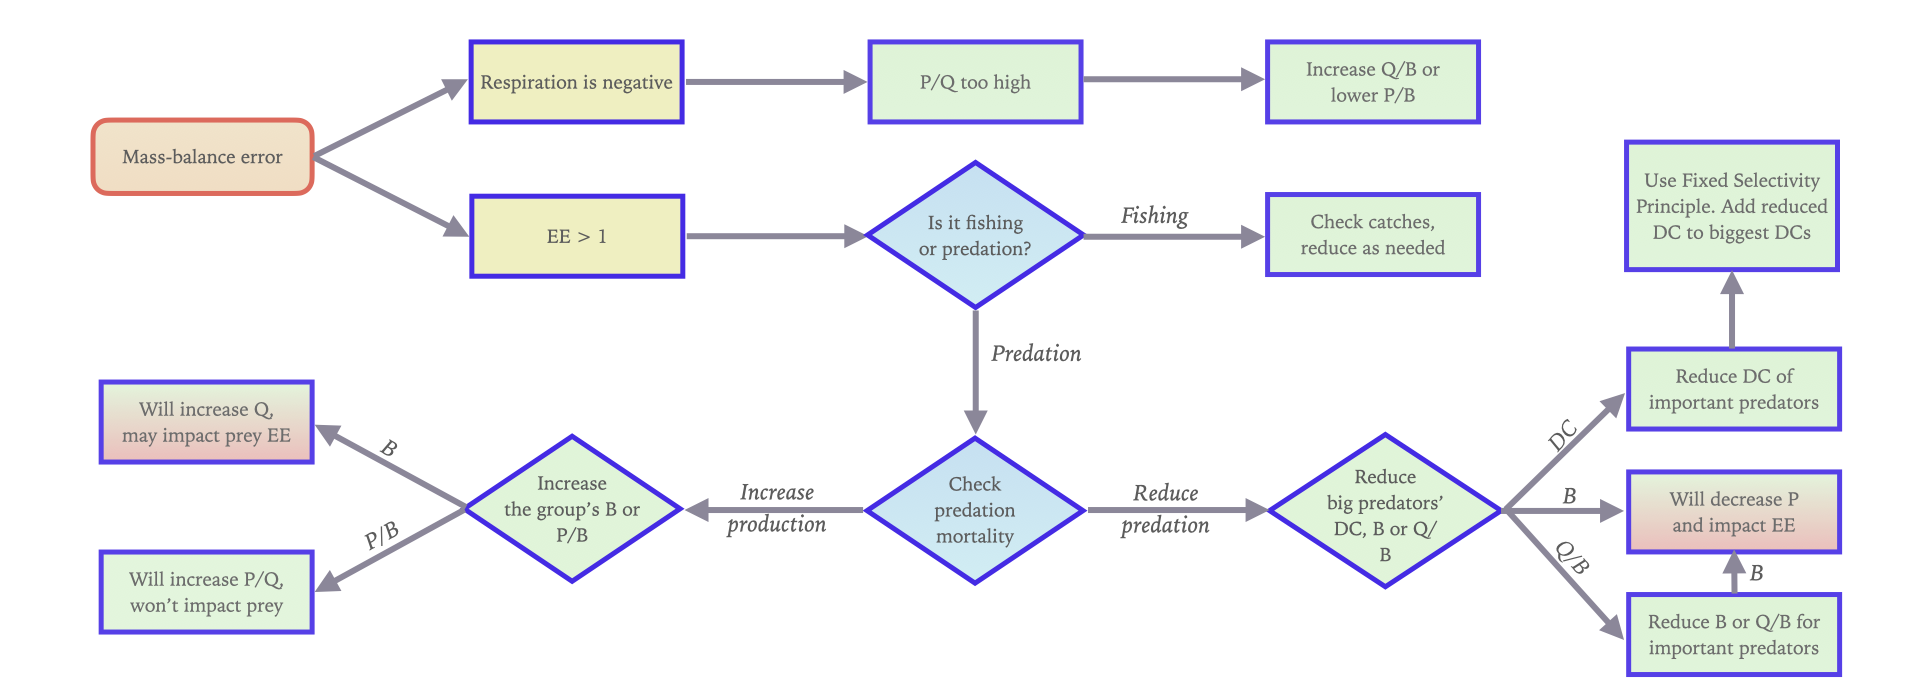
Figure 1. Options for mass balancing.
An exhaustive set of guidelines for how a model should be balanced cannot be given. However, if it existed, such a set would include the following general guidelines
- Make sure to document what is done in the balancing process by entering remarks for all parameters and to extract these subsequently. A model where the balancing process is not appropriately documented is not likely to be publishable;
- Remember which data that are the more reliable and avoid changing these;
- Formulate assumptions and argumentation for changes: the ones easy to explain are likely to be the better assumptions;
- Start by looking at the estimated values. Are the EE values possible (less than 1)? Are the g (= P/Q) values physiologically realistic (0.1-0.3 for most groups, perhaps lower for top predators and higher for very small organisms, (e.g., up to 0.5 for bacteria). If not decide from where the problem is the biggest if you want to balance your model starting from the bottom (producers) or from the top down;
- Search out one group with a bigger problem and try to solve this. Are the P/B, Q/B and B values appropriate for this group? What would happen to, e.g., the g and the EE if you changed the parameters? If the problem is the consumption by predators, look at the Predation mortality form, and identify the quantitatively most important predators. Check the diet compositions and B and Q/B values for these predators;
- Continue for as long as necessary, documenting carefully what changes are made. It may be a good idea to save the data file under a new name before/after making the set of changes;
- You may get warnings that the "Respiration cannot be negative". If this happens the second master equation of Ecopath has been violated. We have:
Consumption = production + respiration + unassimilated food
or
Q = P + R + U
Expressing this relative to consumption we have:
1 = P/Q + R/Q + U/Q
Of these P/Q is entered as the gross food conversion efficiency (g) (or estimated from entered P and Q) and U/Q is the proportion of food that is not assimilated. If g + U/Q exceeds unity, then R/Q and hence the respiration, R, has to be negative. You will need to reduce the production/consumption (g) ratio by lowering the production/biomass (P/B) ratio or increasing the consumption/biomass (Q/B) ratio, and/or reduce the proportion of unassimilated food;
- Examine the respiration/biomass (R/B) ratios for each group. Generally this ratio reflects activity level. For fish it should as a rule be in the range 1-10 year-1, for copepods perhaps around 50-100 year-1. Please consult physiology texts for more information. If the ratio seems high it may be necessary to change the (assumed) proportion of the food that is not assimilated on the basic input form;
- Examine the Electivity form. Do the preferences seem reasonable?
- Examine the predation mortalities at Ecopath > Output > Mortality rates > Mortalities, along with the predation mortality spreadsheet (Ecopath > Output > Mortality rates > Predation mortality rates) to identify how important the various predators are for any group. Does this show what you expect? Are the predators shown to be the most important predators in accordance with what you expect? If not, re-evaluate your model’s diet compositions. The information on the mortality forms is very important!
- Noting how the energy balance of a group is formulated, it is clear that, for instance, increasing the proportion of the consumption that is not assimilated will leave less energy to respiration (production being unaffected). This will result in a lower R/B ratio and a larger flow to the detritus. The latter may be necessary to balance the model if there is only little system surplus production.
Fixed Selectivity Principle for diets
When balancing a model there are often groups for which the information about diet has less detail than required in the model or is qualitative rather than quantitative. You may for instance have a predator that feeds on "small fish"; blue heron could be an example.
A common assumption when defining the diet composition for such predators is to use a seemingly parsimonious assumption of "all equal", i.e. for a start set the, e.g., "20% small fish" to 5% for each of the four potential prey groups. Such an assumption will very likely lead to the model not balancing.
For such predators, it is more reasonable to assume that they take prey in proportion to how common the prey is in the environment. We can quantify this using what we call the 'fixed selectivity' principle, assuming the prey preference for such predators when feeding on suitable prey should be comparable across species or functional groups.
When setting this up, consider that it's not the biomass of a group that is eaten by a predator, it's the production. Therefore, to use this principle, estimate the production (B x P/B) for each (i) of the potential prey groups (n) for a predator (j). Then assume that the proportion each contribute to the predator diet (DCji) is proportional to their production. We have,
[latex]DC_{ji} = \frac{B_i \cdot (P/B)_i}{\sum_{k=1}^n B_k \cdot (P/B)_k} \tag{1}[/latex]
We first used this principle for the Roberts Bank Terminal 2 ecosystem model[3] to adjust the diet composition of pinnipeds, diving waterbirds, great blue heron, shorebirds, chinook adult, chinook juvenile, chum juvenile, dogfish, flatfish, large demersals, lingcod, rockfish, salmon juvenile, skate, and starry flounder. The total contribution of "small fish" in the diet of these predators was maintained, but the distribution among potential prey groups was estimated relative to prey productivity. In that model, the ‘fixed selectivity’ principle was also used to adjust the contribution of invertebrates in the diets of diving waterbirds, waterfowl, forage fish, herring, carnivorous zooplankton, jellyfish, macrofauna, and polychaetes. Contribution of vegetation was also adjusted in a similar way in the diets of American wigeon, waterfowl, epifaunal grazer, epifauna.
Parameter evaluation
The program estimates the missing parameters and a number of indices without further input. Your model will probably not look very convincing the first time you run it. Keep an eye open for warning messages while you make your way through the forms. In the more serious cases, the parameter estimation will be aborted, and you will have to edit your data. To improve your chances of identifying problems, you will in some cases only get a warning and the program will continue.
The following sections may help you evaluate the results of a run.
Are the EE’s between 0 and 1?
Ecotrophic Efficiencies (EE) represents the proportion of the production that is "used" in the system, or to be more precise, the proportion of the production that the model describes the "fate" of – see the EE chapter. This is a parameter that is difficult to measure empirically, but it is one we can relate to. If your model is detailed with lots of predators and fisheries impacting, e.g., small pelagics, we'd expect that the EE for that group should be close to 1. A top predator with only low fishing pressure should have a low EE, and in a system with seasonal plankton blooms the EE for phytoplankton should be intermediate, maybe 0.5, to give a few examples.
EE should as proportion be between 0 and 1 (inclusive). A value of zero indicates that no other group or fishery consume the given group. Conversely, a value close to 1 indicates that the group is being heavily preyed upon or grazed and/or that fishing pressure is high, thus describing almost fully what happens to the group's production.
If, in a first run, any of the EEs are larger than 1, something is wrong: it is not possible for more to be eaten or caught than is produced. The problem can of course be due to the equilibrium assumption not being met, e.g., when the model includes a new fishery on a previously unexploited stock – in that case include a negative biomass accumulation term. So, you should have a closer look at the input parameters.
It may be worthwhile to check the food consumption of the predators, and the production estimates of the group. Compare the food intake of the predators with the production of their prey. Most often, the diet compositions will have to be changed - often the diets are more "pointers" to, than reliable estimates of the real values.
"Cannibalism" in the sense of within-group predation often causes problems. If a group contributes 10% or more to its own diet, this alone may result in consumption being higher than the production of the group. The solution to this is to split the group into juveniles and adults, with the adults acting as predator on the juveniles. The juveniles must then have a higher production rate than the adults, as production is almost always inversely related to size.
It is advisable to make one change at the time when editing input parameters. Make that one change, note down what you did, rerun the Basic estimates routine, re-examine the run, and if necessary re-edit the data, etc. Continue with one change at a time until you get a run you consider acceptable. Make sure, through the entry of remarks in the Remarks window, to record en route what you do and why.
Ecotrophic efficiency of detritus
The ecotrophic efficiency, EE, of a detritus group is defined as the ratio between what flows out of that group and what flows into it. Under steady-state assumption, this ratio should be equal to 1.
Estimates of EE of less than 1 indicate that more is entering a detritus group than is leaving it.
Estimates of EE of more than 1 for a detritus group also require attention. They indicate that the primary production and/or the inputs to the lower parts of the food web are too small to support consumption from that group. It will be necessary to examine the basic inputs that define production and consumption of the lower parts of the food web closely, and to examine whether more detritus should be directed to the detritus group.
Of importance for the flow to detritus is the parameter for non-assimilated food. The default value of 0.2 often underestimates egestion, especially for herbivores and detritivores. For zooplankton eating phytoplankton a value of 0.4 results in more detritus being produced and also often leads to more reasonable respiration/biomass ratios than obtained with the default excretion rate of 0.2. Higher parameter values means that a greater flow is directed to detritus and less to respiration for a given group.
Are the efficiencies possible?
Recall that the gross food conversion efficiency, g, is defined as the ratio between production and consumption. In most cases, production/consumption ratios will range from 0.1 to 0.3, but exceptions may occur, (e.g., bacteria, nauplii, fish larvae and other small, fast-growing organisms). If the g values are unrealistic, check the input parameters, especially for groups whose production has been estimated. In such cases, carefully editing the diet composition of the predators of the problem groups will generally help.
Next are some notes about some common causes of problems during balancing.
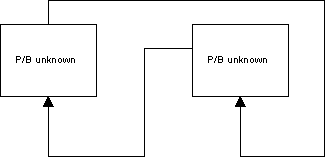
Problem 1: Loops
In cases where P/B is to be estimated for groups that feed on each other (cycles) the program may first estimate a P/B for one group based on the consumption by the other groups. Subsequently it may estimate the P/B for the second group based on the consumption by the first, and then it may continue with the P/B for the first again, and so on in a loop. The result may be completely unrealistic parameter estimates.
It is necessary to break such loops, e.g., by entering the P/B for one of the groups. If all ecotrophic efficiencies are low it indicates that the trophic transfer efficiencies are low. This may be OK for a system with high production and low abundance of organisms. It may however also indicate that the estimates of the biomasses in the system are too low.
Problem 2: Cannibalism (0-order cycles)
Groups where 0-order cycles (cannibalism) are important should be broken into two or more groups. Such cases occur, for example, when a predatory fish feeds on fish of the same species or functional group. The prey fish will, however, be smaller fish, and often the P/B value for the group is based on the recruited part of the population only, and thus does not cover the dynamics of the juveniles, (which generally have much higher P/B values than the recruited part of the population). The solution may be to split the group in an adult and a juvenile fish group. This will also be an advantage for subsequent Ecosim simulations.
Remember that the gross food conversion efficiency (g) is the P/Q ratio. Typically, this ratio is in the range of 10-30%. If the proportion of the 0-order cycle is in the same range there may not be any production left over for other purposes (predation and export). As a guideline if a 0-order cycle includes more than say 5% of the diet composition it is necessary to consider if it would be better to split the group in two.
Problem 3: Estimation of predator consumption and prey production
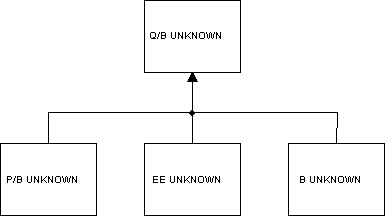
In this example it is assumed that the consumption is unknown for the predator and the (used part of the) production, (i.e., the B, P/B or EE) unknown for all of the prey groups. In this case, it will not be possible for the program to calculate meaningful parameters and it will (probably) resort to the trivial solution: set the Q/B for the predator to zero, and see what can be estimated for the other groups. The problem is easily identified from an examination of the estimated parameters and statistics. The solution may be to either input a gross efficiency for the predator or one of the missing input parameters for one of the prey groups.
Earlier versions of EwE (5) had an automatic mass-balance routine.[4], but we have not migrated that utility to later versions. The reason for this is GIGO = Garbage in, Garbage out. Input parameters have to checked carefully before doing mass-balance, one has to weed out error, such as notably unit conversion errors. Our experience is that that process cannot be automated. (But it was a nice and elegant routine).
Attribution: This chapter is in part adapted from the unpublished EwE User Guide: Christensen V, C Walters, D Pauly, R Forrest. Ecopath with Ecosim. User Guide. November 2008.
- Primary producers actually have respiration, the difference between total and net productivity. We tend to ignore this in Ecopath modelling as it only relates to the efficiency with which producers convert nutrients. ↵
- Winberg, G. G., 1956. Rate of metabolism and food requirements of fishes. In: Transl. Fish. Res. Board Can., Translation Series 194. pp. 1-253. https://waves-vagues.dfo-mpo.gc.ca/library-bibliotheque/38248.pdf ↵
- Impact Assessment Agency of Canada, Roberts Bank Terminal 2 Project, Appendix 10-B Roberts Bank Ecopath with Ecosim and Ecospace Model Parameter Estimates. https://iaac-aeic.gc.ca/050/evaluations/proj/80054 ↵
- Kavanagh, P., N. Newlands, V. Christensen and D. Pauly. 2004. Automated parameter optimization for Ecopath ecosystem models. Ecol. Model. 172:141-149. https://doi.org/10.1016/j.ecolmodel.2003.09.004 ↵
