36 Case study: How fitting impacts advice
Jacob Bentley; David Chagaris; Marta Coll; Sheila JJ Heymans; Natalia Serpetti; Carl J. Walters; and Villy Christensen
The Irish Sea EwE model[1] and Northwest Atlantic Continental Shelf EwE model[2] (hereafter called NWACS-MICE) have both been used to inform fisheries advice for their respective regions using ecological/ecosystem reference points[3]. Both models were designed to focus on commercial fisheries however, they have very different structures in terms of model complexity (Table 1). The two models were used to demonstrate the outcomes and management implications of vulnerability multiplier (kj or kij) estimation and compared estimates of FMSY and ecosystem indicators. Ecosystem indicators selected for this analysis included total system biomass, commercial biomass, total catch, system diversity (Kempton’s Q), the trophic level of the catch, and the trophic level of the community. Estimates of FMSY and ecosystem indicators were compared across the following nine fitting approaches:
- Predator kj values, where the number of parameters estimated is one less than the number of available calibration time series (K-1).
- Predator kj values estimated for all functional groups with time series.
- Predator kj values using the automated stepwise fitting approach, where the applied kj values are taken from the model with the lowest AICc, and the vulnerabilities are reset to the default (2) at each fitting iteration.
- Predator kj values using the automated stepwise fitting approach, where the applied kj values are taken from the model with the lowest AICc, and the vulnerabilities are retained from previous fitting iterations.
- Predator-prey kij values, where the number of parameters estimated is one less than the number of available calibration time series (K-1).
- Predator-prey kij values using the automated stepwise fitting approach, where the applied values are taken from the model with the lowest AICc, and the vulnerabilities are reset to the default (2) at each fitting iteration.
- Predator-prey kij values using the automated stepwise fitting approach, where the applied values are taken from the model with the lowest AICc, and the vulnerabilities are retained from previous fitting iterations.
- Predator-prey kij values using a repeated manual stepwise fitting approach, where the estimated kij (K-1) are retained from one iteration to the next (with a total of 5 iterations) and the final configuration is that with the lowest AICc, as was done in Chagaris et al.,[4].
- A combination of predator kj and predator-prey kij values using the methods outlined by Bentley et al., (2020). Predator kj values were estimated using the automated stepwise fitting approach in #3. Predator-prey kij values were estimated using a manual stepwise fitting approach and the remaining degrees of freedom. The number of additional predator-prey kij’s was determined by their AICc score (note this approach was only carried out for the Irish Sea model in this study).

Alternate fitting approaches led to the emergence of different vulnerability multipliers in the corresponding models of best fit (as determined by sum of squared deviations and AICc) for the Irish Sea (Figure 1) and NWACS-MICE (Figure 2). Different fitting approaches impacted estimates of FMSY in both models due to changes in species sensitivity to F with alternate vulnerability multipliers. Despite the increased complexity of the Irish Sea model, the patterns in FMSY variability are comparable between models, with certain species having consistent FMSY estimates across the nine approaches for vulnerability multiplier estimation. This includes cod and whiting for the Irish Sea and striped bass for the NWACS. As demonstrated in case study 1 (previous chapter), these species are opportunistic feeders which are also predated on by higher trophic levels, giving them a relatively high degree of connectivity within the food web models, which may constrict the emergence of vulnerability multipliers. Additionally, these groups have experienced a period of collapse, and in some cases recovery, which provides contrast for the model to estimate the vulnerability multipliers. Fitting approaches with similar properties resulted in more closely related FMSY estimates[5]. For example, FMSY estimates generated by approaches, which searched for vulnerability multipliers by “predator” tended to be more similar to each other when compared to those generated by approaches which searched by “predator-prey”, and vice versa. This emergent trend is perhaps most clearly seen in the FMSY estimates for menhaden and bluefish adults from the NWACS-MICE model (Figure 2).
The approach used to estimate vulnerability multipliers had an impact on the derived ecosystem indicators (Figure 1b and Figure 2b). These impacts were relatively small, most deviations being within the range of 5-10% when compared to indicators from the published models. Trophic level indicators were particularly robust across estimation approaches, despite often larger differences being observed in diversity (Kempton’s Q) catch and commercial biomass indicators. Balanced reconfiguration within the ecosystem models (i.e., increases in some species and decreases in others with similar trophic levels) enabled the trophic indicators to remain similar across approaches. However, the dissimilarity in trophic level of the catch in the NWACS-MICE model was generally higher across scenarios where vulnerability multipliers were searched by “predator”. This reflects the higher FMSY reference points for adult weakfish and bluefish and lower FMSY reference points for menhaden and herring produced under the same fitting approaches. Overall, the Irish Sea EwE model showed greater dissimilarity in derived indicators than the NWACS-MICE model. This outcome is likely linked to the increased complexity of the Irish Sea model, and how a repeated search provides the opportunity to adjust more predator-prey vulnerability multipliers. This may be less of a concern for low complexity models as the parameter space is smaller, increasing the likelihood that the same vulnerability multipliers will be adjusted.
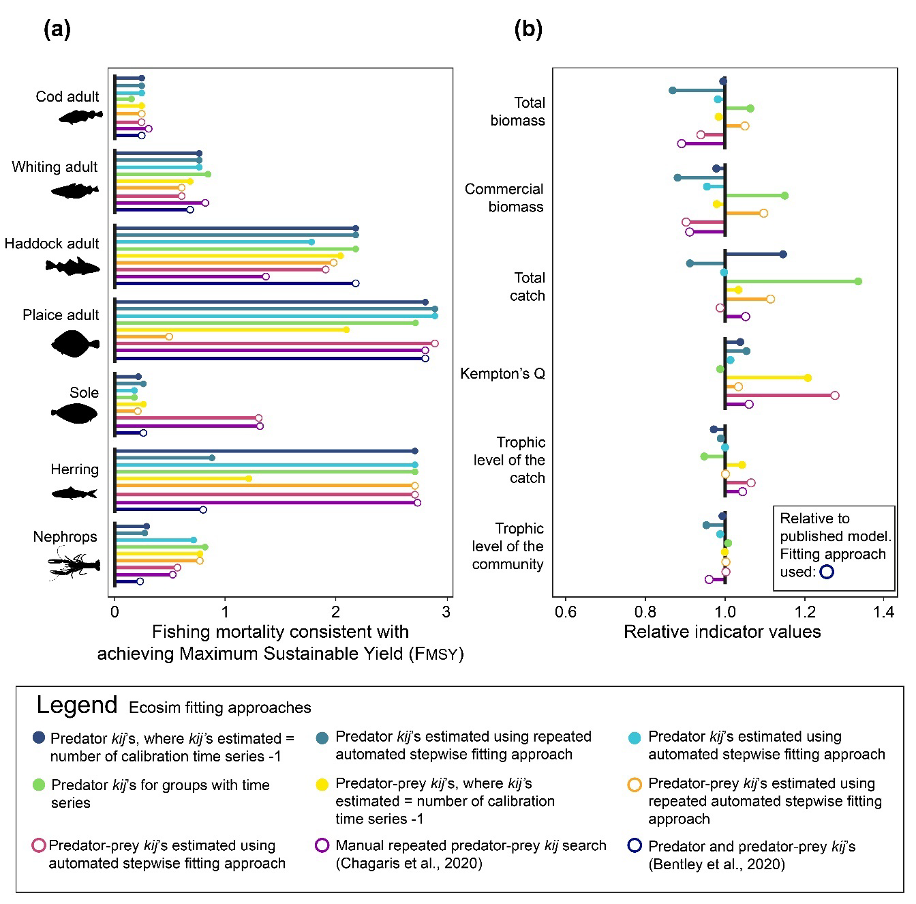
Figure 1. Irish Sea EwE outputs under alternate fitting approaches. Vulnerability multipliers for the Irish Sea Ecosim model were estimated following seven alternate fitting approaches. The impacts of alternate fitting approaches and vulnerability multiplier estimates are shown for (a) estimates of FMSY (b) indicators of ecosystem structure and function. The impacts of vulnerability multiplier estimates on indicator simulations are illustrated by comparing new simulations against the simulations from the published model. The published Irish Sea model has vulnerability multiplier values estimated using the predator and predator-prey approach.[6]
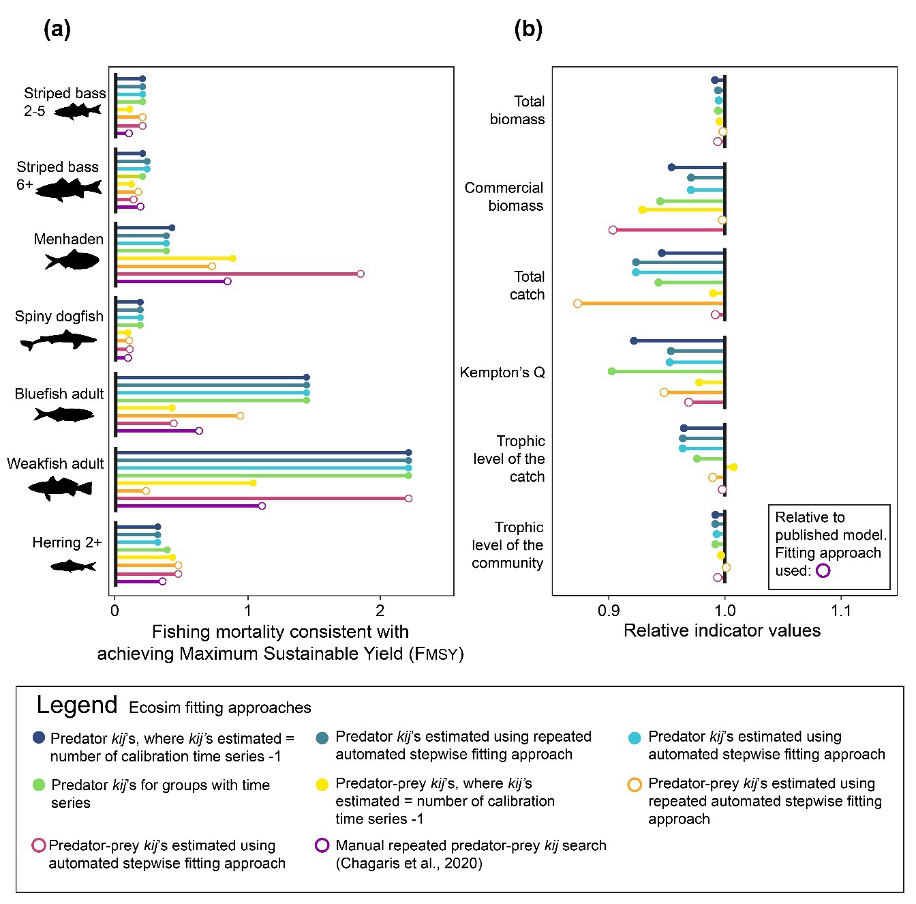
Figure 2. NWACS-MICE EwE outputs under alternate fitting approaches. Vulnerability multipliers for the NWACS-MICE Ecosim model were estimated following seven alternate fitting approaches. The impacts of alternate fitting approaches and vulnerability multiplier estimates are shown for (a) estimates of FMSY (b) indicators of ecosystem structure and function. The impacts of vulnerability multiplier estimates on indicator simulations are illustrated by comparing new simulations against the simulations from the published model. The published NWACS-MICE model has vulnerability multiplier values estimated using the manual repeated predator-prey vulnerability multiplier search approach.[7]
Media Attributions
- From Bentley et al. 2024. Table 1
- From Bentley et al. 2024. Figure 7
- From Bentley et al. 2024. Figure 8
- Bentley, J.W., Serpetti, N., Fox, C.J., Heymans, J.J. and Reid, D.G., 2020. Retrospective analysis of the influence of environmental drivers on commercial stocks and fishing opportunities in the Irish Sea. Fisheries Oceanography, 29(5), pp.415-435. https://doi.org/10.1111/fog.12486 ↵
- Chagaris, D., Drew, K., Schueller, A., Cieri, M., Brito, J. and Buchheister, A., 2020. Ecological reference points for Atlantic menhaden established using an ecosystem model of intermediate complexity. Frontiers in Marine Science, 7, p.606417. https://doi.org/10.3389/fmars.2020.606417 ↵
- Howell, D., Schueller, A.M., Bentley, J.W., Buchheister, A., Chagaris, D., Cieri, M., Drew, K., Lundy, M.G., Pedreschi, D., Reid, D.G. and Townsend, H., 2021. Combining ecosystem and single-species modelling to provide ecosystem-based fisheries management advice within current management systems. Frontiers in Marine Science, 7, p.607831. https://doi.org/10.3389/fmars.2020.607831 ↵
- Chagaris et al. 2020. op. cit. ↵
- See Supplemental figure 3 in Bentley et al. 2024 ↵
- Bentley et al., 2020. op. cit. ↵
- Chagaris et al., 2020. op cit. ↵
