Tutorial: Maximum sustainable yield (MSY)
Learning Objectives
This exercise is designed to,
- Obtain experience with evaluation of single-species vs. ecosystem-level MSY
MSY and evaluating trade-offs for anchovy fishery
The first management scenario includes a comparison of a single-species versus ecosystem-level Maximum Sustainable Yield (MSY). The methodology is described by Walters et al. (2005[1]). While MSY is a concept that has some clear problems as a management objective, notably from a conservation perspective[2]), it does provide a reference point for management, including from a societal perspective[3].
- Use the Anchovy Bay model in a version that is fitted to time series. If you don’t have one, you can download one from this link. Once loaded, load the Ecosim scenario (but not the time series), check that you have vulnerabilities saved (Ecosim > Input > Vulnerabilities). Make a run to check model. Then reset the effort for all fleets (Ecosim > Input > Fishing Effort > Reset All).
- Run the model, extract the results for the final year, and save the values from the run in a spreadsheet. You can extract the values from the Ecosim > Output > Ecosim results form, save Fleet, value end, and Group, biomass end.
- Then increase the fishing effort for bait boat fleet (which are targeting anchovy) to 10. Run. Extract results, and copy to your spreadsheet.
- Stop fishing altogether for the bait boats and extract results.
- You will notice that shrimps are impacted indirectly by the anchovy fishery. Try setting a high fishing effort for anchovy and also increase the shrimpers’ effort.
- Try changing effort for other fleets (do some ecosystem manipulations) to see if you can increase the value of the fishery without crashing the ecosystem.
After playing with this, examine the results in your spreadsheet. Notice that your results depend on two major factors:
-
- Prices by species (and by fleet): examine the landing prices (Ecopath > Basic input > Fishery > Off-vessel prices. Consider how your results depend on the prices.
- How each species reacts to changes in fishing pressure. This factor is closely related to the vulnerability multipliers in Ecosim, (remember: 2 is default setting; below 2 is closer to carrying capacity, above 2 is further from carrying capacity).
Evaluate how changes in fishing pressure for a species impacts itself and the ecosystem through MSY analysis (Ecosim > Tools > FMSY). Notice that there are two main options for the MSY search: Full compensation, (which includes ecosystem effects on other species), and Stationary system, (which assumes no ecosystem effects, i.e. single-species analysis). With full compensation, Ecosim runs normally including species interactions. With the stationary system option, only the target groups will be impacted, the abundance of predator and prey species will be kept constant, frozen as they were.
-
- On the FMSY form, run analysis by fleet, choose ‘both’ for Assessment to display and Data to display. [If after a run, the Run button isn’t enabled, then click Group, Fleet, Group, or close the FMSY form and open it again].
- For the seiners and bait boats, you may have to increase the relative F to, e.g., 10 or 30 to make sure you get to an overexploited state
- Are the MSY’s realistic? If not, you need to reconsider your vulnerability settings.
- On the FMSY form, run analysis by fleet, choose ‘both’ for Assessment to display and Data to display. [If after a run, the Run button isn’t enabled, then click Group, Fleet, Group, or close the FMSY form and open it again].
The figures below (Figure 1 and 2) show Anchovy Bay MSY output for seiners and for cod.
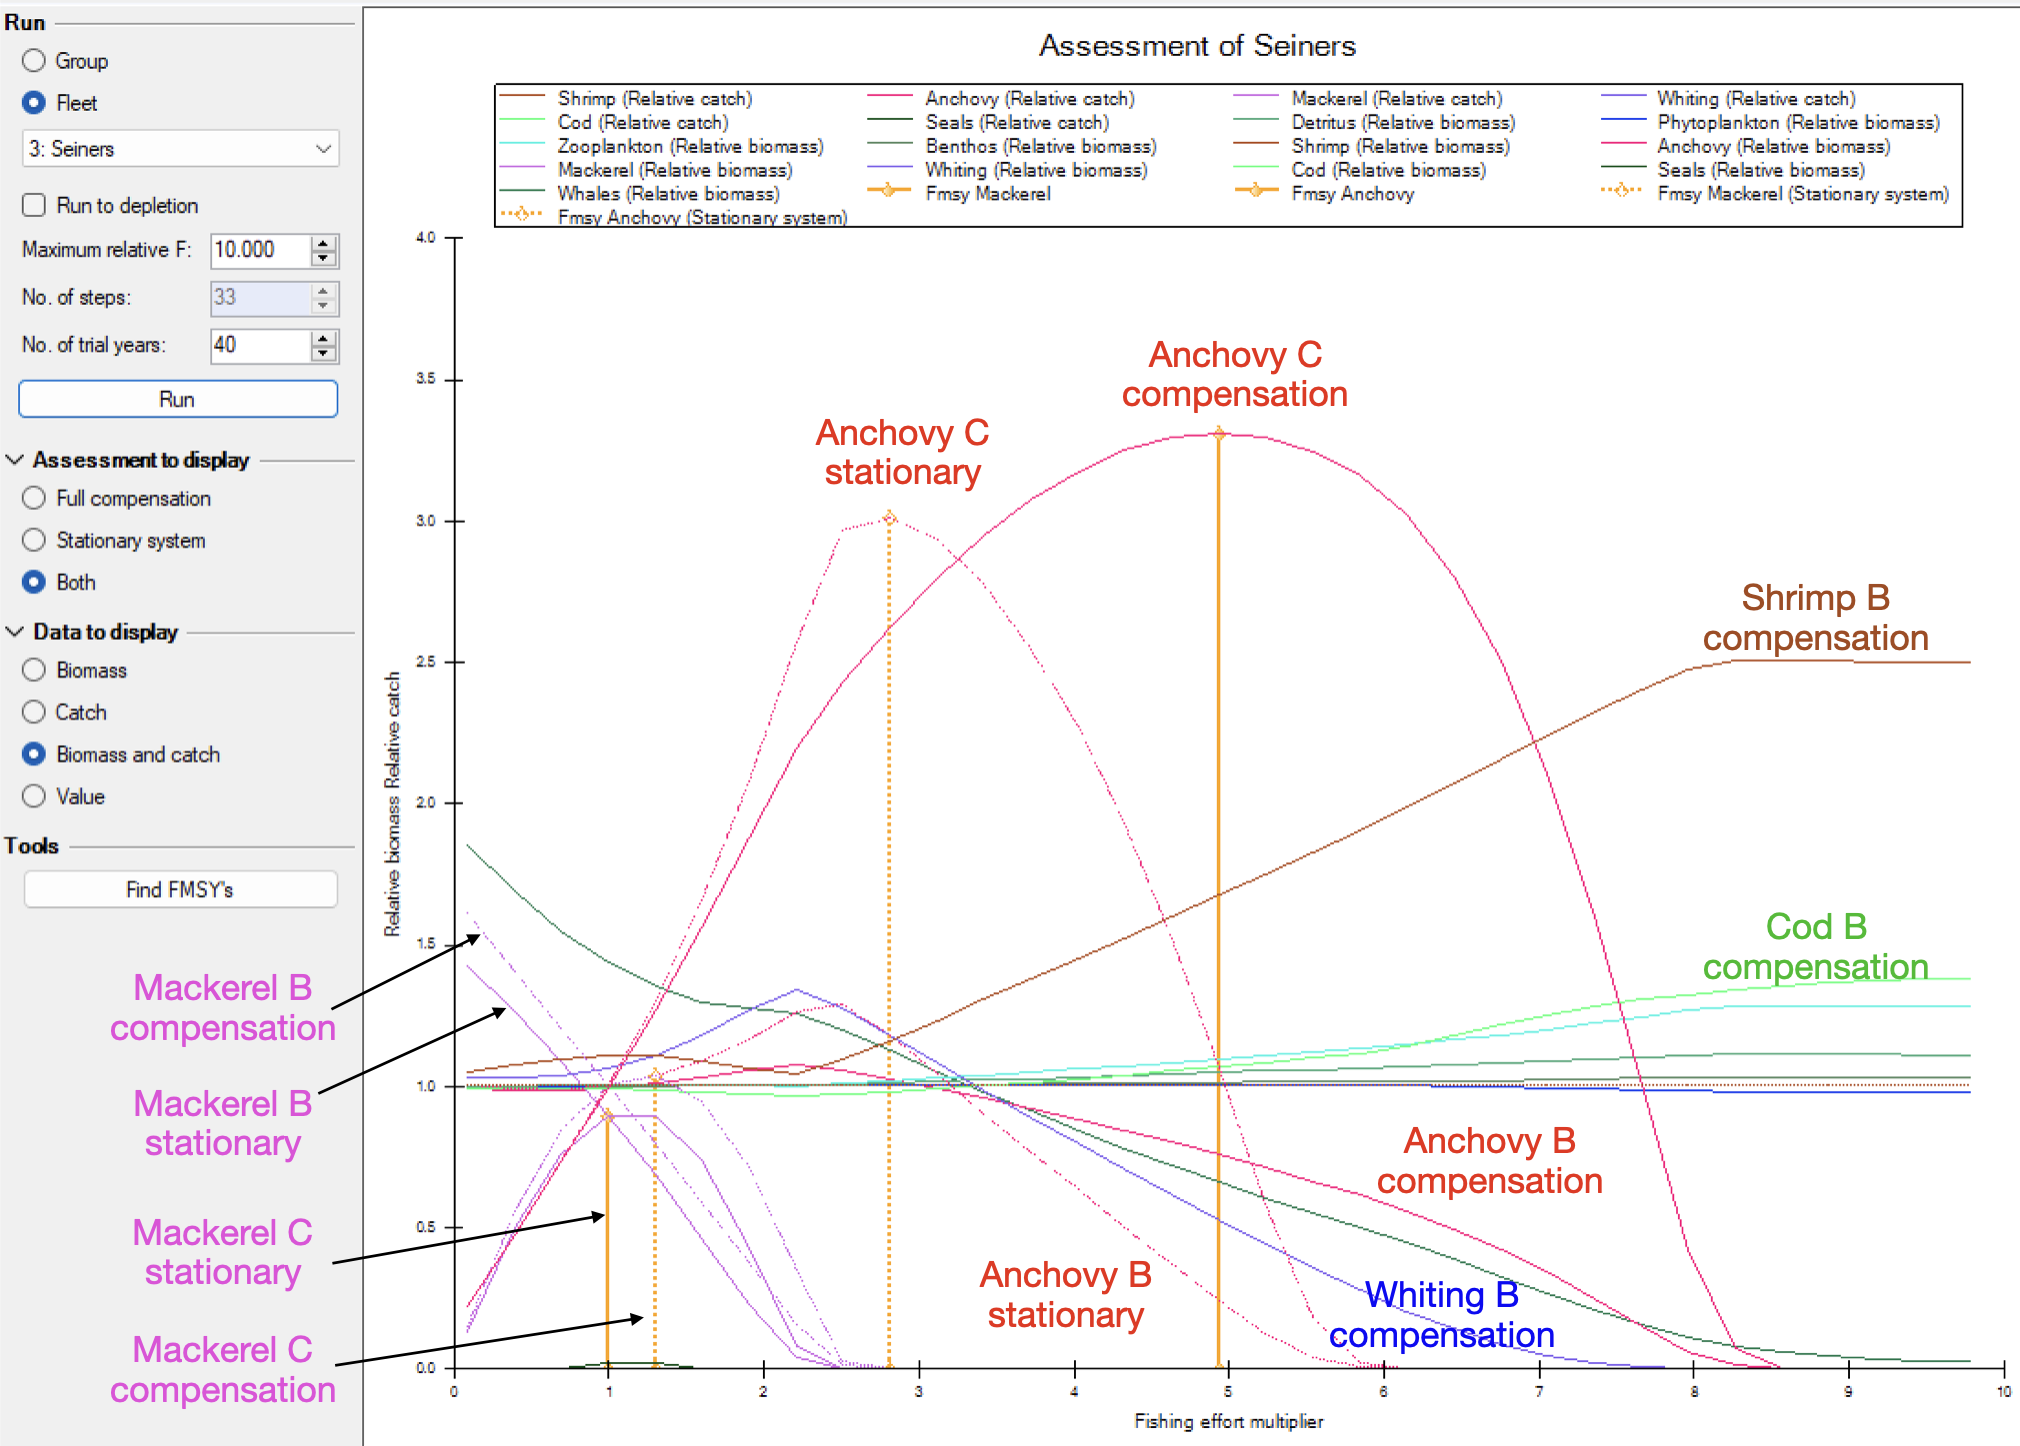
Figure 1. MSY interface for the seiner fleet showing complex species interactions showing run with compensation (due to species interaction) as well as stationary system run (no food web effects). The seiners catch both mackerel and anchovy, therefore increased effort will benefit anchovy as the higher effort has more impact on their predator, mackerel. Note in the stationary run, anchovy MSY is lower than with compensation, whereas it is opposite for mackerel. Increased seiner effort will benefit cod as whiting (their competitor and predator), suffers from decreased anchovy availability. Shrimp increases because of less predation by whiting.
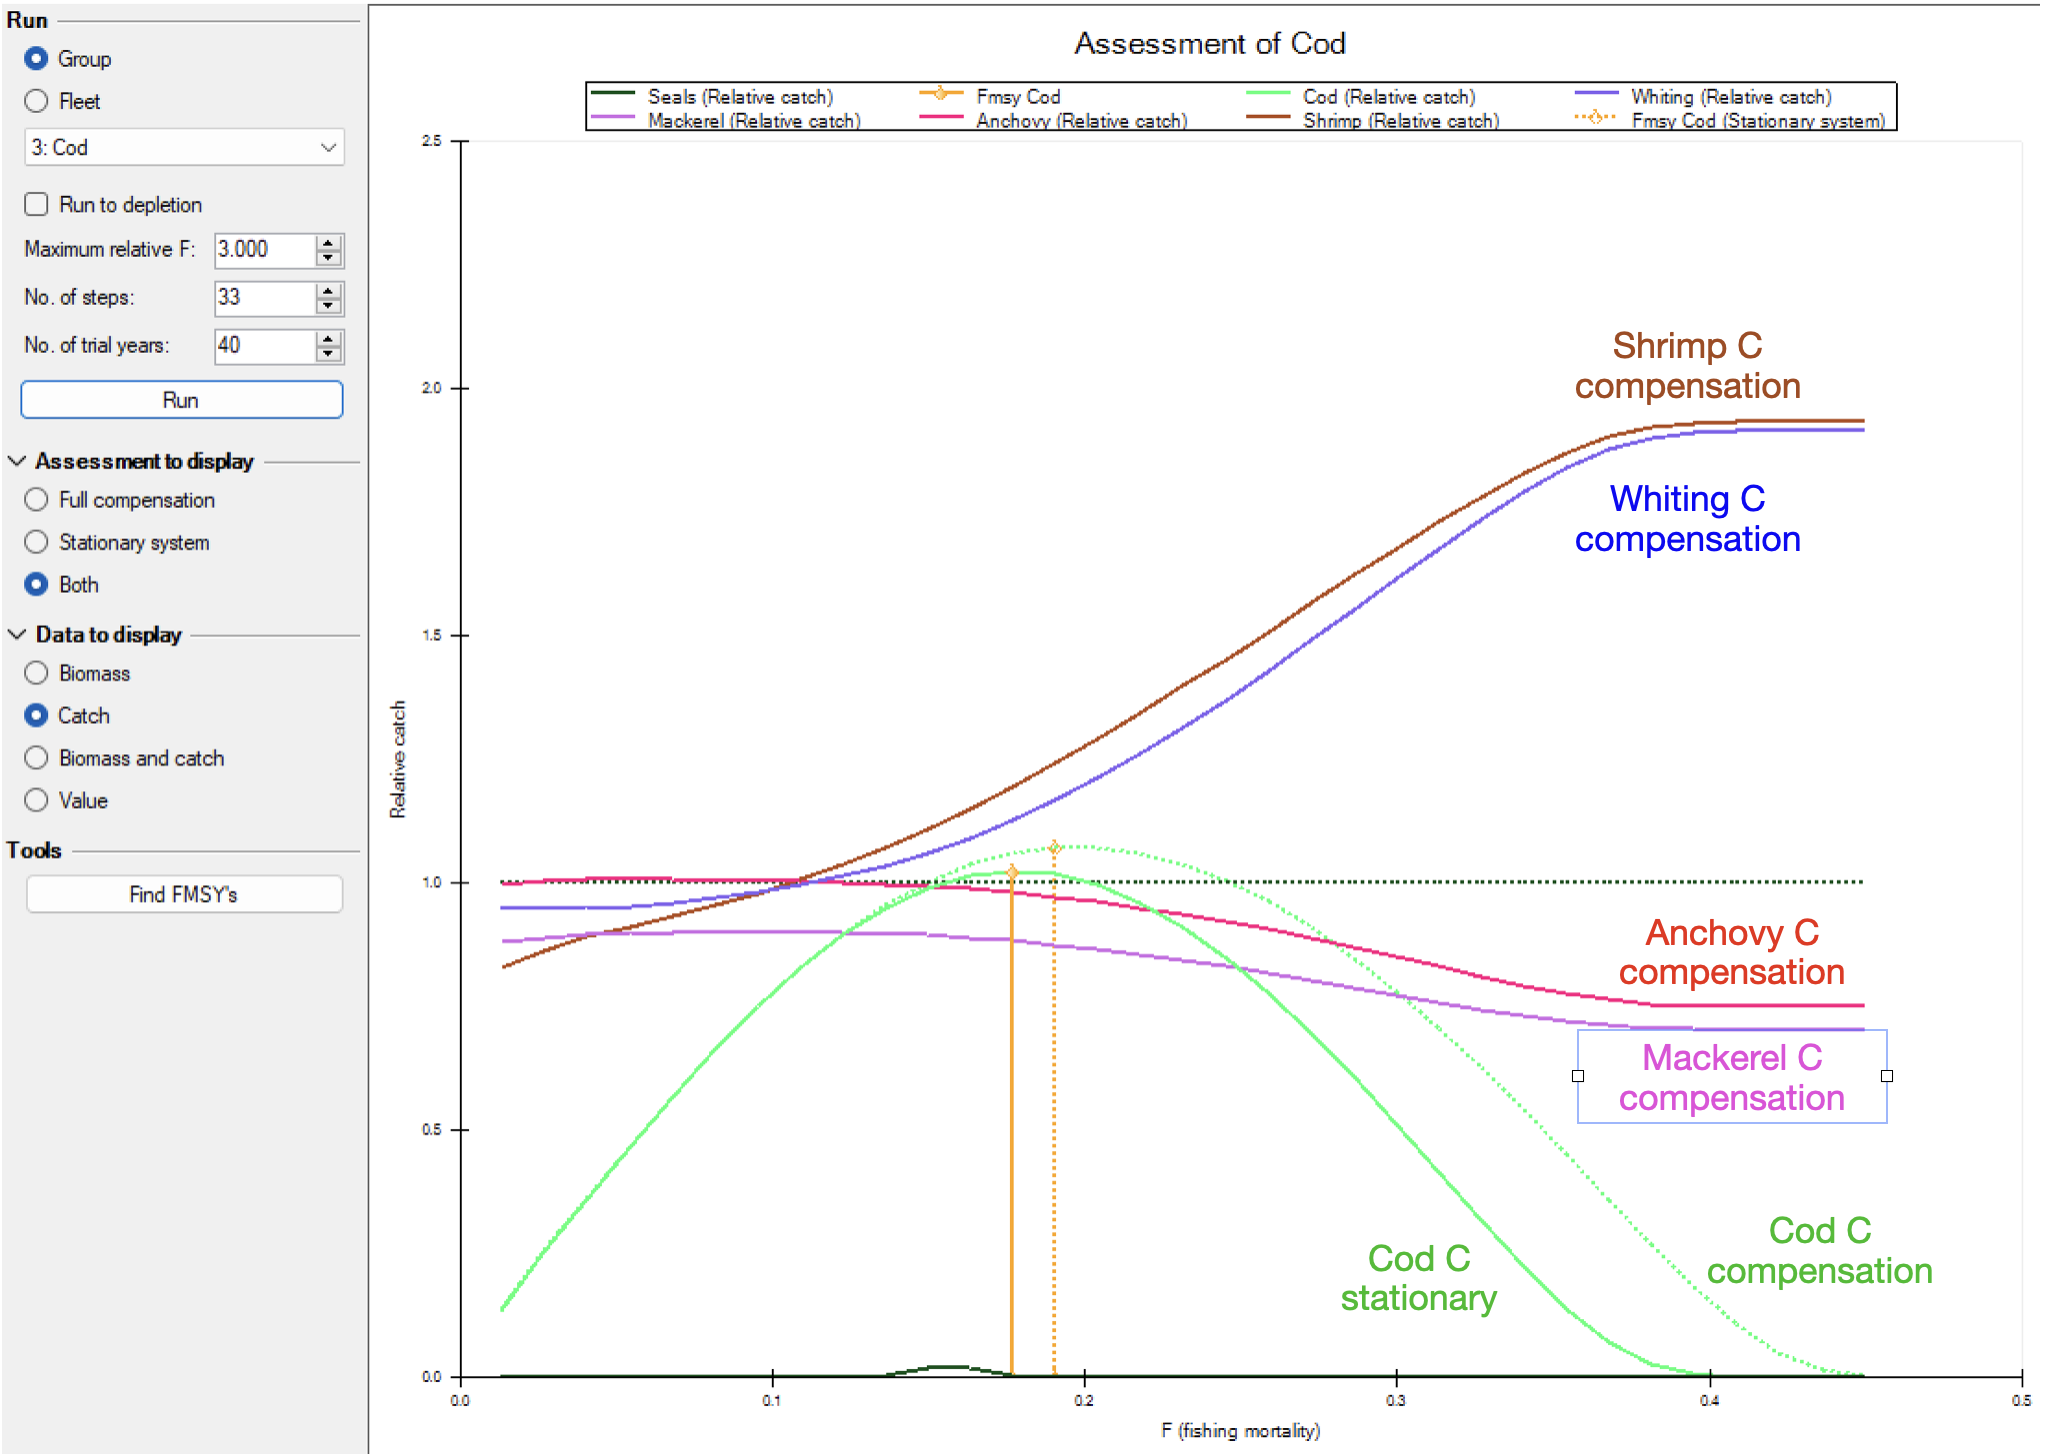
Figure 2. MSY analysis for Anchovy Bay cod. With the stationary system only cod is impacted, while runs with compensation (full Ecosim species interaction) have whiting abundance increasing (not shown) leading to corresponding increase in whiting catches. Shrimps also benefits from increased cod fishing. In contrast, anchovy declines when whiting increases and this in turn leads to their predator mackerel decreasing as well.
You can do batch runs to evaluate MSY for all species using the Find FMSY routine on the Ecosim > Tools > FMSY form. For this, first click the Auto-save output at the top of the form, then the save symbol on the second menu at the top of the form. From the Menu > Tools > Options > File management form you can find the folder location for where the MSY results are saved (named MSY iterations). See output in Table 1.
Table 1. Output from Find FMSY batch run, extracted from the files FMSY_FullCompensation.csv and FMSY_StationarySystem.csv. For anchovy, the effort was increased enough to estimated FMSY in the full compensation run (FmsyFound = 0), but the full compensation has much higher FMSY for anchovy compared to the stationary system. For shrimp the stationary system prediction is overly optimistic as it does not consider that shrimp predators are competing with the fishery. The general finding is that FMSY is higher when ecosystem interactions are considered (full compensation).
| Full compensation | ||||
| Group | FmsyFound | Fmsy | Cmsy | Vmsy |
| Whales | – | – | – | – |
| Seals | 1.00 | 0.07 | – | 0.00 |
| Cod | 1.00 | 0.18 | 0.46 | 4.61 |
| Whiting | 1.00 | 0.16 | 0.23 | 0.94 |
| Mackerel | 1.00 | 0.39 | 0.37 | 1.48 |
| Anchovy | – | 0.58 | 3.15 | 6.74 |
| Shrimp | 1.00 | 0.51 | 0.62 | 12.33 |
| Stationary system | ||||
| Group | FmsyFound | Fmsy | Cmsy | Vmsy |
| Whales | – | – | – | – |
| Seals | 1.00 | 0.07 | 0.00 | 0.00 |
| Cod | 1.00 | 0.19 | 0.48 | 4.82 |
| Whiting | 1.00 | 0.12 | 0.20 | 0.80 |
| Mackerel | 1.00 | 0.36 | 0.41 | 1.62 |
| Anchovy | 1.00 | 0.29 | 1.56 | 3.35 |
| Shrimp | 1.00 | 0.34 | 2.46 | 49.27 |
Quiz
Media Attributions
- Ecosim > Tools > FMSY
- Ecosim > Tools > FMSY
- Walters, C. J., Christensen, V., Martell, S. J., and Kitchell, J. F. 2005. Possible ecosystem impacts of applying MSY policies from single-species assessment. ICES Journal of Marine Science, 62(3):558-568. ↵
- P. A. Larkin. 1977. An Epitaph for the Concept of Maximum Sustained Yield, Transactions of the American Fisheries Society, 106:1, 1-11 ↵
- Christensen, V. 2010. MEY = MSY. Fish and Fisheries 11(1):105-110 ↵
